
Education and Training Monitor 2021
2. Seven targets toward a European Education Area
With the ET2020 drawing to a close last year, on 18 February 2021, the Council of the EU adopted a Resolution on a strategic framework for European cooperation in education and training towards the European Education Area and beyond (2021-2030). This Resolution established a new cycle of cooperation in education with an updated set of seven EU-level targets for education and training.
Thus, the previous “2020 benchmarks” have been superseded by the “EU-level targets 2021-2030” The following table compares the two monitoring schemes in a simplified form. The sequence of indicators follows the current framework. A detailed comparison of the two frameworks including the modified numerical target values is presented in the Annex (Figure 75).
Figure 44: Early leavers from education and training by sex, country of birth and degree of urbanisation, 2020 [%]
| EEA and beyond 2021-2030 | ET2020 | |
| 1 | Low achieving 15-year-olds in basic skills | |
| 2 | Low achieving eight-graders in digital skills | Employment rates or recent graduates |
| 3 | Early childhood education and care | |
| 4 | Early leavers from education and training | |
| 5 | Tertiary educational attainment | |
| 6 | Exposure of VET graducates to work based learning | Learning mobility |
| 7 | Participation of adults in learning | |
Source: Council Resolution on a strategic framework for European cooperation in education and training towards the European Education Area and beyond (2021-2030) (2021/C 66/01) of 21 February 2021.
Note: The order of indicators corresponds to the 2021 February Council Resolution. no. 1 underwent minor changes in wording. No. 4. received a complementary indicator (“upper secondary attainment”). No. 7 saw a change in the reference period. For details see Figure 75 in the Annex.
2.1 Underachievement in basic skills
In a nutshell
Underachievement at age 15 focuses on students who perform below the minimum level in reading, maths or science108 necessary to participate successfully in society. Failing to meet this very basic proficiency level lowers a pupil’s future chances both on a personal and professional level. The corresponding EU-level target for 2030 is to ensure that the total average underachievement in these three domains across the EU is below 15%. On average across the EU, the EU-level target – an underachievement rate of less than 15% – has not been reached in any of the three domains tested by PISA 2018. In 2018, the underachievement rate stood at 22.5% in reading, 22.9% in mathematics and 22.3% in science109. Despite progress in 2009-2018 in some countries, performance in science and reading deteriorated at EU level and remained stable in mathematics. PISA results suggest that countries tend to obtain similar results across the three domains. Countries such as Estonia, Finland, Ireland and Poland have low underachievement rates in all three domains. By contrast, in Bulgaria, Romania Cyprus and Malta, more than one in five students underachieve at the same time across all three domains.
2.1.1 Progress towards the EEA target: Reading
In 2018, reading performance showed large variation across the Member States (Figure 45). Four countries met the 15% EU-level target for low achievement: Estonia (11.1%), Ireland (11.8%), Finland (13.5%) and Poland (14.7%) and Denmark was just above the target (16.0%). By contrast, the underachievement rate exceeded 30% in Malta (35.9%), Slovakia (31.4%) and Greece (30.5%), and even 40% in Bulgaria (47.1%), Cyprus (43.7%) and Romania (40.8%).
Performance worsened in most countries compared to the previous 2015 PISA round. This is reflected in the slightly increased EU average, from 20.0% in 2015 to 22.5% in 2018. The deterioration was statistically significant in Cyprus (+8.1 pps), the Netherlands (+6.0 pps), Latvia (+4.8 pps), Germany (+4.5 pps), Luxembourg (+3.6 pps), Slovenia (+2.7 pps) and Finland (+2.5 pps).
Looking at reading performance over a longer time span, performance did not change substantially in most countries between 2009 and 2018. In eight countries (the Netherlands, Slovakia, Greece, Hungary, Finland, Latvia, Belgium and Luxembourg) the underachievement rate increased at a statistically significant rate. Only Ireland and Slovenia experienced a statistically significant decline. Overall, EU reading performance deteriorated, with the 2009 EU average underachievement rate at 19.2%.
Figure 45: Underachievement rate in reading, 2015 and 2018 [%]
2.1.2 Progress towards the EEA target: Maths
The 2018 pattern of underachievement in mathematics is similar to that for reading (Figure 46). Four countries met the 15% target: Estonia (10.2%), Denmark (14.6%), Poland (14.7%) and Finland (15.0%). Ireland (15.7%), the Netherlands (15.8%) and Slovenia (16.4%) were just above the EU-level target. The underachievement rate exceeded 30% in Romania (46.6%), Bulgaria (44.4%), Cyprus (36.9%), Greece (35.8%), Croatia (31.2%) and Malta (30.2%).
Performance remained rather stable in many Member States between 2015 and 2018. A slight majority of countries experienced a decline in the underachievement rate, but it was statistically significant only in Cyprus (–5.7 pps) and Latvia (–4.1 pps). The only statistically significant increases took place in Romania (+6.6 pps) and Germany (+3.9 pps). Consequently, the EU average, at 22.9%, remained stable compared to 2015, when it stood at 22.2%.
The EU average performance in mathematics remained stable also over the longer window of 2009-18, although trends differ across Member States. Three countries experienced a statistically significant increase of their share, namely Finland (+7.1 pps), Slovakia (+4.1 pps) and Luxembourg (+3.3 pps). At the same time, four Member States registered a statistically significant decrease: Poland (–5.8 pps), Latvia ( 5.2 pps), Ireland ( 5.1 pps) and Slovenia ( 3.9 pps).
Figure 46: Low achievers rate in mathematics, 2015 and 2018 [%]
2.1.3 Progress towards the EU-level target: science
The rate of low achievers in science also shows a mixed picture across EU Member States (Figure 47). Four countries met the 15% target in 2018: Estonia (8.8%), Finland (12.9%), Poland (13.8%) and Slovenia (14.6%). By contrast, the rate of low achievers was higher than 30% in Bulgaria (46.5%), Romania (43.9%), Cyprus (39.0%) and Greece (31.7%).
In a few Member States the rate of low achievers increased with statistical significance between 2015 and 2018 (+8.6 pps in Bulgaria, +3.0 pps in Spain, +2.8 pps in Denmark), while Cyprus and Poland experienced a statistically significant decline (—3.2 pps and —2.4 pp, respectively). The EU average slightly increased, from 21.1% to 22.3%.
Long-term trends (2009-18) for science are more negative than for reading or mathematics. The EU average rate of low achievers increased by 4.2 pps over the past decade. No EU country was able to reduce significantly its share of low achievers over the decade. The share increased significantly in Hungary (+10.0 pps), Slovakia (+10.0 pps), Bulgaria (+7.7 pps), Croatia (+6.9 pps), Finland (+6.9 pps), Greece (+6.5 pps), Italy (+5.2 pps), Lithuania (+5.2 pps), Germany (+4.8 pps) and Latvia (+3.8 pps). In many cases, the largest increase took place between 2012 and 2015.
Figure 47: Rate of low achievers in science in 2015 and 2018 [%]
Box 10: Girls in science, technology, engineering and mathematics (STEM)
Performance on the OECD’s PISA scale for science has proved to be a strong predictor of STEM and ICT career aspirations. Girls aspiring to STEM careers are better performers in science than girls with non-STEM career aspirations or boys with STEM career aspirations. On average across OECD countries, boys and girls are almost equally likely to expect to work in a science-related field – although this does not apply for all fields in the sciences. Some 25% of boys and 24% of girls expect to be working in a science-related occupation when they are 30, a small (yet statistically significant) difference. In most countries, similar shares of top-performing boys and girls expect a career in a science-related field; and in Denmark and Poland, top-performing girls are significantly more likely than top-performing boys to expect a career in one of these fields.
As shown in the figure below, the percentage of new entrant girls in 2019 was low both in tertiary and upper-secondary vocational education. Equally, on the labour market, women are underrepresented in high value sectors. In 2019, 41% of scientists and engineers working in the EU were women, and just 21% in high-technology sectors. Similarly, a mere 18% of ICT specialists in the EU were women.
Attracting more women into STEM education and subsequent employment could help to address labour supply and skills shortages in these occupations, as well as avoid talent loss to drive innovation and growth. Additionally, closing the gender gap in STEM is predicted to contribute to an increase in EU GDP per capita by 0.7–0.9% by 2030 and between 2.2% and 3.0% (€610-820 bn) by 2050. Some possible policy initiatives include introducing career counselling in schools, offering gender-sensitive training to staff, as well as providing advice and guidance during the early years. According to the 2021 OECD report Future at Five: Gendered Aspirations of Five-year-olds, children aspire to roles that are known to them. Exposure to STEM jobs and female role models is therefore essential. Several initiatives exist under the 2021-2027 digital education action plan, actions 12 and 13, respectively:
- a series of workshops, training and placement activities for female students at primary, secondary and tertiary education by the European Institute of Innovation and Technology and its Knowledge and Innovation Communities. This will boost digital skills applied to social challenges.
- developing new higher education programmes for STEM, by reinforcing the arts aspect and basing them on the concept of STEAM (STEM plus arts subjects). This will be done by building on the EU STEM Coalition’s expertise to incorporate sustainability and creativity and include guidance and mentorship, to be more attractive for women.
Figure 48: Share of female students in STEM fields by education level in the EU, 2019 [%]
2.1.4 Policy takeaways
The PISA 2018 results show that one in five students cannot complete very basic tasks in reading, mathematics and science. This is not only a worrying social issue, but also a drag on EU future economic competitiveness and resilience. Yet some EU countries have been able to improve their PISA performance over time by putting in place structural education reforms. This section highlights some key takeaways from a few top-performing countries.
Among Member States, Estonia, Poland and Ireland show consistently outstanding results in PISA. Estonia gives particular attention to equity and inclusiveness: every school has coordinators who provide services to students with special needs, and a mandate to give additional personalised support to prevent students from dropping out of education, so that no one is left behind. Factors contributing to Estonia’s strong performance may include compulsory attendance at school until completion (or until the student is 17 years old), the high degree of autonomy enjoyed by schools and the obligation to conduct self-evaluations every three years.
Poland’s good results are likely due to factors such as increased school autonomy and a rapid expansion of early childhood education and care. Evidence shows that past reforms110 have contributed to a significant reduction in education inequalities, in particular among children from rural areas. Supported by EU funding, Poland has also invested extensively in supporting teachers through continuous professional development programmes, as well as online teaching tools and resources.
A stronger focus on equity and the early years is also one of the main features of the Irish education system. Past initiatives111 have helped reduce the impact of students’ socio-economic background on their performance, and this extends to students from an immigrant background. Moreover, teachers are recruited from among high academic performers, and they benefit from extensive professional development.
2.2 Low achieving eight graders in digital skills
In a nutshell
Member States have agreed on a new EU-level target on digital skills, aiming to reduce the share of underachieving students in grade 8 to less than 15% by the end of the decade. Over the past two years, the COVID-19 crisis has emphasised the importance of both basic and advanced digital skills for sustaining economies and societies. Notably, digital skills became a prerequisite for participating in learning, working and socialising during the many lockdowns. In future, it is expected that 90% of jobs in all sectors will require some form of digital skills, highlighting the need to develop these skills from an early age in support of the digital transformation.
2.2.1 Assessment of digital skills
The EU-level target is to reduce the share of low-achieving eighth-graders in computer and information literacy to below 15% by 2030. The source of this new target (not covered in previous frameworks) is the indicator used to measure progress towards the digital skills target – the International Computer and Information Literacy Study (ICILS). The study is conducted every five years by the International Association for the Evaluation of Educational Achievement (IEA), and targets students in their eighth year of schooling. ICILS directly measures students’ digital skills through computer-based assessments in computer and information literacy and computational thinking112.
The digital skills indicator is a measure of the share of students in their eighth year of schooling who perform below the level 2 threshold on the ICILS computer and information literacy achievement scale113. Low achievement in digital skills means that students are unable to use computers to complete basic and explicit information-gathering and management tasks. Examples of such tasks include locating simple information on a website with multiple pages and entering information in a specified cell in a spreadsheet114.
Box 11: Digital Education Action Plan in the Flemish Community of Belgium
The plan was adopted in December 2020 to help enhance digital education in schools. The Covid-19 crisis has shown that the Flemish education system was not ready for distance digital teaching. The plan has four objectives: a future-oriented and secure ICT infrastructure in schools; a supportive and efficient ICT school policy; digitally competent teachers and teacher trainers, plus digital resources; and a Knowledge and advice centre (KAAC) for digital school education. The National Recovery and Resilience Plan will support a large share of the €375 m plan. Measures include the use of ICT devices for all students from grade 5 to 12, better ICT infrastructure and connectivity in all schools, strengthening the number and role of ICT-coordinators in schools, an efficient ICT school policy with measures against cyberbullying and promotion of e-inclusion, training to improve the digital teaching skills and the use of ICT in education for teachers and teacher trainers, access for all schools to high-quality and innovative learning resources and platforms and digital forms of evaluation, including through single sign-in. The KAAC will support schools and pedagogical guidance services with digital educational practices and data, and provide input for data-driven education policies.
Source: Flemish Ministry for Education, Sport, Animal Welfare and the Flemish Rim (in Dutch)..
Two ICILS cycles (2013, 2018) have been completed to date115, albeit with limited participation from EU Member States. The next ICILS cycle will see a substantial increase in coverage, but data collection is not due to start until 2023, with results becoming available in 2024. In total, 14 EU Member States participated in the initial ICILS cycles, nine in 2013116 and seven in 2018117. Denmark and Germany participated in 2013 and 2018, but only Germany has comparable results across cycles118.
2.2.2 Progress towards the EU-level target
Figure 49 presents the distribution of students performing below the threshold for low achievement in EU Member States participating in ICILS 2013 and ICILS 2018.
Figure 49: Low achievement among 8th-graders in computer and information literacy, 2013 and 2018
Considering the two initial cycles of ICILS jointly, the share of low achievers in digital skills only approached the EU level target value in two EU Member States: Czechia in 2013 (15.0%) and Denmark in 2018 (16.2%). In the other participating countries, the share of low achievers ranged from 21.4% in Denmark (2013) to 50.6% in Luxembourg (2018). The data from ICILS 2013 and 2018 suggest that significant effort will be necessary to reduce the share of low achievers in digital skills across all EU Member States, if the EU level target is to be achieved by 2030.
Box 12: Digital sciences are being introduced in secondary education in Luxembourg
Since the school year 2020-21, coding has been embedded in maths classes in cycle 4 (age 10-11) and starting in 2021-22 it is being taught across all subjects in cycles 1 to 3 (age 4-9). In secondary education, computer science is a new subject in 2021-22, including coding and computational thinking. As of 2021-22, some 18 secondary schools – about half of all secondary schools – are participating in a pilot, introducing digital sciences as of grade 7 through the three years of lower-secondary education. This is to be extended to all secondary schools as of 2022-23. As part of the strategy for improving digital education, new continuing professional development courses are offered to both primary and secondary school teachers by the National Teacher Training Institute Source: IFEN – Luxembourgish Training Institute for National Education).
There is evidence of a gender gap in digital skills in the data from ICILS 2013 and ICILS 2018. On average in the participating Member States, boys perform worse than girls119. Figure 50 shows the share of low achievers in digital skills by sex. We see that the difference ranges from 4.5 pps in Czechia (2013) to 16.9 pps in Slovenia (2013).
Although girls on average perform better than boys do, there were only two countries, Czechia (2013) and Denmark (2018), where the share of low achievers among girls was lower than the new EU level target of 15%. The share of low achievers among boys was not below the overall target value in any of the Member States participating in the initial two ICILS cycles.
Figure 50: Low achievers in digital skills by sex [%]
2.2.3 Spotlight on socio-economic status
Similar to the digital divide between girls and boys, ICILS data suggests that there is a digital divide associated with the socio-economic status of students120. That is, students from more advantaged backgrounds perform better in computer and information literacy than their peers from less advantaged backgrounds. This pattern is consistent across the 14 Member States participating in ICILS121.
Lower socio-economic status is associated with poorer labour market prospects, partly due to the low level of skills, including digital skills. Moreover, higher levels of digital skills tend to correlate positively with more favourable labour market positions. Basic digital skills are found to enhance employability, while advanced ICT skills lead to higher wages122. With over 90% of jobs in all sectors expected in future to require some form of digital skills, developing basic digital skills at an early age is key.
Box 13: Socio-economic gaps and labour market disadvantage
A recent IEA Compass Briefs in Education prepared by the Joint Research Centre identified significant different levels of ICT skills among students depending on their family background in the data from ICILS 2018123. Key to their findings is that the socio-economic gap in computational thinking124 test scores is consistently larger than the corresponding gap in computer and information literacy test scores. This suggests that the labour market disadvantage associated with lower levels of ICT skills among individuals from a lower socio-economic status may be larger than previously thought, highlighting the importance of collecting evidence on multiple dimensions of ICT competence. Although even simple and routine jobs require individuals to be able to use ICT at some level, more and more occupations in future will be based on advanced problem-solving abilities. The results suggest that students with a lower socio-economic status are likely to experience unequal opportunities in the labour market by facing a higher risk of being excluded from the best jobs. This may potentially lead to larger social inequality, income and job polarisation, and higher poverty rates.
Addressing socio-economic differences at an early age will be a contributory factor to achieving the EU-level target on digital skills among eighth graders. Reducing the share of underachieving students can also be a factor in meeting the newly proposed EU level target of at least 80% of those aged 16-74 having basic or above-basic digital skills by 2030125. Considering data from the EU survey on the ICT usage in households and by individuals126, we see a similar pattern to that identified by ICILS – namely that the level of digital skills in the population is associated with socio-economic status.
Figure 51: Individuals with basic or above-basic digital skills by income quartile, 2019 [%]
Figure 51 compares individuals living in households with incomes in the bottom and the top income quartiles. There is a difference of more than 30 pps in the share of individuals with basic or above basic digital skills between the top and the bottom income quartiles in 20 Member States127. In the top income quartile, more than 80% of individuals have basic or above-basic digital skills in 10 Member States. This is in contrast to the bottom income quartile, where the share of individuals with basic or above-basic digital skills is below 40% in 16 Member States.
2.2.4 Policy takeaways
Digital skills are becoming crucial for all citizens to participate in an increasingly digital world. Over the past two years, the COVID-19 crisis has further emphasised the importance of both basic and advanced digital skills for sustaining our economies and societies. Particularly during the widespread lockdowns, basic digital skills became a prerequisite for activities such as learning, working and socialising, thereby accelerating the digital transformation. More than 95% of the respondents contributing to the open public consultation on the digital education action plan consider the COVID-19 crisis to be a “turning point” for how technology is used in education and training.128
The 2030 Digital Compass points to digital skills as essential to reinforce our collective resilience as a society, noting that access to education allowing the acquisition of basic digital skills should be a right for all EU citizens129. The European Pillar of Social Rights action plan sets out that at least 80% of those aged 16-74 should have at least basic digital skills by the end of the decade130. In 2019, this number stood at 56% according to the Digital Economy and Society Index131.
In the area of education, COVID-19 brought on a rapid and widespread shift to distance, online and blended learning and teaching. This shows the importance of providing teachers, students with adequate digital infrastructure and skills. Evidence suggests that the pandemic aggravated pre-existing inequalities in the school system, in particular affecting students from lower socio-economic backgrounds. Going forward, it will be important to enrich data collections and develop policy responses to reach those at risk of being left behind.
2.3 Participation in early childhood education and care
In a nutshell
Member States have agreed on a new EU-level target for participation in early childhood education and care (ECEC) at EU level: 96% of children between 3 years old and the starting age for compulsory primary education to participate in ECEC. The latest available data from 2019 puts that share at 92.8%, for the EU as a whole, with increases during the preceding five years observed in most countries. The EU-level target should be seen in conjunction with policy guidance on the quality of ECEC provision. Member States are working both on increasing the accessibility of ECEC and improving the quality of staff and curricula. At EU level, a Working Group on ECEC supports the development of high quality ECEC through peer learning, monitoring and evaluation.
2.3.1 Progress towards the EU-level target
During the last decade, considerable steps have been taken to improve the participation of children in early childhood education and care all over Europe132. To keep the momentum, Member States have agreed on a new, ambitious EU-level target for this, ensuring that the early years in a child’s education are kept in the spotlight.
The EU-level target states that, by 2030, at least 96% of children between 3 years old and the starting age for compulsory primary education should participate in ECEC133. Setting the target high should also help vulnerable children to benefit from the policy measures taken.
The latest (2019) EU average for the new ECEC target stands at 92.8%134 (Figure 52). This is an increase of 2.1 pps over the preceding 5 years. In 2019, five Member States (Belgium, Denmark, Ireland, Spain and France) reached the target level and Sweden came very close to reaching 96% participation. Ireland135 and France have reached 100% participation rates.
The universal legal entitlement to ECEC is from the age of 2.5 years in Belgium, 6 months in Denmark, 3 years in Spain and Poland, and 1 year in Sweden. The Irish Early Childhood Care and Education Scheme provides 15 hours per week free of charge for 38 weeks of the year, from the age of 2 years and 8 months. In France, the starting age of compulsory education has been lowered to 3 since September 2019136.
To support further upward convergence among Member States of participation in early childhood education and care up to the age of 3, the Commission will propose in 2022 the revision of the Barcelona targets.137
Box 14: Increasing participation in early childhood education and care in Lithuania
The low participation rate in early childhood education and care and imbalances in its provision have prompted Lithuania to take action. The aim is to increase access and encourage participation addressing inequalities and improving student outcomes. Currently, primary education starts at the age of 7 and the last year of ECEC has been compulsory since 2016. From September 2023, the compulsory entry age to pre-primary education will be lowered from 6 to 5 years. An update of the pre-primary education curriculum is also being planned to better match the learning needs of younger children. As of September 2021, children from families at risk of poverty should be guaranteed access to pre-school education.
The legal entitlement to pre-school education will gradually be extended. Municipalities should ensure provision of ECEC for all children of 4-year-olds whose parents require a place in 2023, for all 3 year-olds in 2024 and for all 2-year-olds in 2025. Municipalities will be financially supported in this by central government, through announced increases in education spending. The Recovery and Resilience Facility will fund a feasibility study in 2021 on how to adapt existing ECEC infrastructure and develop transport services and whether a further expansion of capacities is needed to meet the increasing needs and tackle imbalances in ECEC provision.
In the last five years of available data, most countries have seen the ECEC participation of children between the age of 3 years and the mandatory school age increase, with Cyprus, Ireland, Croatia, Poland and Luxembourg recording the fastest improvements138. Seven countries saw participation in this age group fall between 2014 and 2019; in decreasing order of the size of the drop these are Bulgaria, Romania, Malta, Greece139, Germany, Italy and the Netherlands140. It is worth noting that out of these countries only Germany guarantees a place in ECEC for the youngest children141.
Figure 52: Participation in ECE of children between 3 and the age of starting compulsory primary education, 2019 [% of the population of the corresponding age, target 96%]
The age bracket of children from 4 years old to the mandatory primary school age142 shows a similar pattern to the 3+ group (Figure 53). The six top-performing countries mentioned above all have a participation rate above 96% for this age group and they are joined by eight further countries, meaning that more than half of the Member States have a participation rate above 96% for the 4+ age bracket, with an EU average of 95.1%. Greece, Luxembourg, Austria, Cyprus and the Netherlands have much higher participation rates for the 4+ age bracket than for the 3+ age bracket143.
Box 15: The “Gute-KiTa-Gesetz” (Act on Good Early Childhood Education and Care) – Germany
TThe German federal level supports efforts at regional and local level to improve access, provision and quality of ECEC. The most important instrument is the so called “Gute KiTa Gesetz” (Act on Good Early Childhood Education and Care), which provides financial support worth €5.5 bn to upgrade the quality of ECEC places and lower the fees. The Gute KiTa Report 2020144 observed the baseline and first progresses in different fields of quality by regions. Beginning in 2021, two additional programmes “Kita-Einstieg: Brücken bauen in frühe Bildung” (Stepping into Childcare: Building bridges into early childhood education) and “Sprach-Kitas: Weil Sprache der Schlüssel zur Welt ist” (Language day care centres) have been extended, making an additional €520 m available for quality improvement up to 2022.
The much broader age bracket from 0 to the start of mandatory primary education, for which the EU average is 57.7%, shows a comparable distribution, with Denmark, Sweden and Belgium having participation rates over 70%, and Spain close behind. The largest differences between the 3+ and the 0+ age ranges can be seen in Malta, the Netherlandssup>145, Francesup>146, and Hungary.
Figure 53: Participation in ECE by children between 0, 3 and 4-years-old, and the starting age of compulsory education, 2019 [% of the population of the corresponding age]
2.3.2 Policy takeaways
The first principle of the European Pillar of Social Rights states that “everyone has the right to quality and inclusive education, training and lifelong learning in order to maintain and acquire skills that enable them to participate fully in society and manage successfully transitions in the labour market.” Moreover, the 11th principle explicitly acknowledges the importance of high-quality ECEC, stating that “children have the right to affordable early childhood education and care of good quality.”
Box 16: Child Group Act in Czechia
In Czechia, an amendment to the Child Group Act entered into force in July 2021. It is expected to provide stable public funding for child groups which, to date, are often EU-funded. These groups, turned into nurseries, will welcome children up to the age of 3. New requirements in terms of infrastructure and staff profiles are designed to improve childcare quality. The transition from rather informal child groups to more institutional nurseries is underpinned by funding from the EU’s Recovery and Resilience Facility. The government plans to increase the number of childcare facilities by 40% until the end of December 2025. It will also run a study to investigate barriers to participation in early childcare. Due to a shortage of places as well as socio-economic factors, participation of under 3-year-olds in early childhood education and care is currently the lowest in the EU. This leads not only to gender imbalances on the labour market, but also to learning gaps and socio-economic inequality.
Evidence shows that participation in high-quality ECEC correlates with better social and emotional well-being, lowering risks of school dropout and even contributing to higher learning and employment outcomes later in life147. Its positive contribution proves particularly beneficial for children from disadvantaged socio-economic backgrounds. An equitable ECEC system with high coverage rates increases equal opportunities and social mobility. Providing every child with an equally strong starting position is an effective and efficient way to set children on a trajectory to achieve their maximum learning potential148.
Of course, the benefits of ECEC are dependent on the quality of its provision. ECEC quality has emerged over the last few years as an important policy focus in many Member States. However, the quality of ECEC services still often differs by children's age. More than half of the EU27 countries do not require a bachelor's degree for staff working with children under age 3 (Figure 82). Educational guidelines were available in all countries at least for children from the age of 3, and in many cases for the entire ECEC phase149.
At EU level, the EU-level target is accompanied by comprehensive policy guidance in the field of ECEC quality150. In 2021, a new Working Group on ECEC has been set up as part of the governance structure to achieve and further develop the EEA. The Working Group will help Member States implement the 2019 Council Recommendation for high-quality ECEC systems151 and the EU Quality framework for ECEC152. It will mainly support peer learning, monitoring and evaluation of quality.
2.4 Early leavers from education and training
In a nutshell
As part of the seven EU-level targets, Member States have agreed that the share of early leavers from education and training should be less than 9% by 2030153. In 2020, this share was 9.9% across the EU on average, with pronounced differences between and within countries. The average share of early leavers from education and training is 3.8 pps higher among young men (11.8%) than it is among young women (8%) and there are striking disadvantages for foreign-born young people. Regional discrepancies are wide in many Member States.
Reducing the proportion of young people who leave education and training before they have completed upper secondary attainment remains a priority of the EU in the field of education and training154. Member States have also acknowledged the overall aim to decouple academic attainment and achievement from social, economic and cultural status, or from other personal circumstances155.
The below 9% early leaver EU-level target is accompanied by an upper secondary completion indicator156. The European Pillar of Social Rights action plan also calls for early school leaving to be further reduced and participation in upper secondary education increased, and the share of early leavers from education and training is a headline indicator in its revised social scoreboard157.
2.4.1 Progress towards the EU-level target
Across the EU on average, the share of early leavers from education and training was 9.9% in 2020. The share has decreased by 3.9 pps since 2010. A decrease of 2.7 pps over the period 2010 to 2014 was followed by a smaller reduction of 1.1 percentage point since 2015, to reach the now superseded ET2020 benchmark of 10% in 2020.
Figure 54: Early leavers from education and training, 2010-20 [%]
Differences between countries remain pronounced, even if they have narrowed in recent years. In some countries, more than 15% of the young population are early leavers from education and training. This is the case in Spain (16.0%) and Romania (15.6%). The share of early leavers is also well above the 9% target in Italy (13.1%), Bulgaria (12.8%), Malta (12.6%), Hungary (12.1%) and Cyprus (11.5%). In 18 Member States, the share of early leavers from education and training is currently less than 9% and Denmark is close to reaching the 9% target. Croatia has the smallest proportion of early leavers (2.2%).
Box 17: A new data warehouse to tackle early school leaving in Malta
The Data Warehouse Project was launched by the Maltese Ministry for Education to be implemented by 2022, according to the Maltese National Recovery and Resilience Plan.
Its primary objective is to identify gaps in tackling early school leaving by collecting data on students from the beginning to the end of their schooling. Collecting data and information about school attendance, student assessment, socio-economic status, etc. will allow more targeted, evidence-based interventions and more effective monitoring and evaluation of the measures that are implemented.
The project will start by processing all the data from state schools, from grade 1 to 11, followed by state post-secondary schools and tertiary institutions. Independent and church schools should also be part of the monitoring in the coming years.
Several countries where the share of early leavers from education and training is well above 9%, such as Spain, Romania, Italy and Malta, have seen very marked reductions over time, though these have levelled off in more recent years. In other countries where the share of early leavers exceeds the 9% target, a reversal in the recent trend will be needed. This is the case especially in Cyprus and Hungary, where the share of early leavers has increased since 2015158.
Box 18: Action plan to tackle early school leaving– The French Community of Belgium
The French Community of Belgium is preparing a comprehensive action plan to tackle early school leaving and is funding personalised support to students to fight lower educational outcomes as a result of COVID-19.
The French Community, in its National Recovery and Resilience Plan (NRRP) has committed to adopt an action plan against school dropout by December 2022. It will review decrees in four key areas: the work of the CPMS (Centres for Psychological, Medical and Social Support) to prevent school dropout will be strengthened; the reasons for excluding students from schools will be limited and a single board of appeal will be established; the prevention and intervention mechanisms for students showing signs of alienation or dropout from schools will be strengthened; and compensation mechanisms will be promoted for students who dropped out by providing transitional support (from the système d’accrochage scolaire) or through internships and citizen projects. This plan comes under the Pact for excellence in education, a systemic reform aiming at improving the quality of education. In 2021-2022 the NRRP will also fund personalised support for 30 000 students in compulsory education through multi-disciplinary teams to address mental, educational and pedagogical difficulties, lower educational outcomes and potential school dropout as a result of COVID-19 (€26.9 m). This project is a follow-up to similar projects that were run in school year 2020/2021.
Portugal and Greece are among the countries that have made most progress, with the share of early leavers reduced to one third of the level in 2010, as well as Latvia, Spain, Croatia and Ireland, where it was halved, or nearly so.
The proportion of early leavers from education and training in the EU is 3.8 pps higher among young men (11.8%) than young women (8%). Young men are more likely to be early leavers from education and training in all countries, except Romania (where young women are at a 1.9 pps disadvantage) and Czechia (with women at a 0.1 percentage point disadvantage). The gender gaps are particularly large — 5.0 pps or above — in Spain, Portugal, Cyprus, Italy and Luxembourg.
The EU-level target is complemented by an indicator measuring the share of people aged between 20 and 24 years with at least an upper secondary qualification (ISCED 3 level)159. Across the EU on average, 84.3% of 20 to 24 year-olds had at least an upper secondary qualification in 2020. Young women (87.1%) have a clear advantage over young men (81.5%). The young population is increasingly likely to have completed upper secondary education, with only few countries seeing a decrease or limited change in the proportion.
Figure 55: Percentage of people aged 20-24 who have successfully completed at least upper secondary education [%]
| 2018 | 2019 | 2020 | |||||||
| Total | Men | Woman | Total | Men | Woman | Total | Men | Woman | |
| EU | 83.2 | 80.7 | 85.8 | 83.5 | 81.0 | 86.2 | 84.3 | 81.5 | 87.1 |
| BE | 84.8 | 81.7 | 87.9 | 85.6 | 82.4 | 88.8 | 85.7 | 82.3 | 89.1 |
| BG | 86.0 | 85.6 | 86.3 | 84.4 | 83.6 | 85.4 | 85.4 | 84.7 | 86.1 |
| CZ | 89.5 | 88.5 | 90.5 | 88.3 | 88.1 | 88.6 | 87.4 | 87.8 | 87.0 |
| DK | 75.0 | 69.9 | 80.4 | 75.8 | 70.9 | 80.9 | 76.1 | 71.2 | 81.1 |
| DE | 77.4 | 74.9 | 80.3 | 77.5 | 75.0 | 80.2 | 79.2 | 75.6 | 82.9 |
| EE | 82.6 | 77.3 | 87.9 | 84.8 | 80.1 | 89.5 | 87.7 | 86.2 | 89.2 |
| IE | 94.4 | 93.7 | 95.2 | 94.1 | 93.6 | 94.7 | 94.9 | 94.8 | 94.9 |
| EL | 93.9 | 92.2 | 95.5 | 94.5 | 93.4 | 95.7 | 94.9 | 94.3 | 95.6 |
| ES | 72.7 | 67.7 | 77.9 | 74.0 | 68.5 | 79.7 | 75.9 | 70.2 | 81.9 |
| FR | 88.3 | 85.7 | 90.8 | 88.5 | 86.4 | 90.7 | 89.7 | 87.4 | 92.0 |
| HR | 96.2 | 96.6 | 95.9 | 97.3 | 97.5 | 97.1 | 97.2 | 96.7 | 97.8 |
| IT | 81.1 | 78.5 | 84.1 | 82.0 | 79.7 | 84.5 | 83.3 | 80.6 | 86.3 |
| CY | 91.5 | 90.1 | 92.8 | 92.3 | 91.4 | 93.0 | 88.4 | 85.3 | 91.1 |
| LV | 88.3 | 83.8 | 93.1 | 87.1 | 85.5 | 88.9 | 88.0 | 85.1 | 91.0 |
| LT | 92.1 | 90.0 | 94.4 | 92.5 | 91.0 | 94.1 | 90.1 | 88.1 | 92.2 |
| LU | 76.8 | 73.0 | 80.4 | 77.5 | 78.4 | 76.7 | 75.4 | 70.8 | 80.0 |
| HU | 85.0 | 84.6 | 85.4 | 86.6 | 85.7 | 87.5 | 85.7 | 84.4 | 87.0 |
| MT | 77.4 | 76.5 | 78.5 | 78.1 | 76.2 | 80.3 | 81.1 | 77.8 | 85.0 |
| NL | 82.5 | 79.4 | 85.6 | 82.2 | 78.9 | 85.6 | 83.1 | 80.1 | 86.2 |
| AT | 88.0 | 85.7 | 90.3 | 87.3 | 84.4 | 90.3 | 86.1 | 82.6 | 89.7 |
| PL | 91.2 | 89.6 | 92.8 | 90.8 | 88.4 | 93.2 | 89.9 | 87.9 | 92.1 |
| PT | 80.8 | 76.6 | 85.2 | 82.9 | 78.6 | 87.2 | 85.3 | 80.1 | 90.6 |
| RO | 81.7 | 81.6 | 81.7 | 83.4 | 83.8 | 83.0 | 83.0 | 84.3 | 81.7 |
| SI | 91.5 | 89.5 | 93.7 | 92.4 | 91.5 | 93.5 | 92.8 | 91.7 | 94.0 |
| SK | 89.4 | 89.7 | 89.1 | 89.9 | 89.9 | 89.9 | 89.7 | 90.1 | 89.2 |
| FI | 87.4 | 86.5 | 88.2 | 88.2 | 87.9 | 88.6 | 89.1 | 88.0 | 90.2 |
| SE | 85.3 | 83.3 | 87.4 | 84.6 | 81.4 | 88.1 | 83.1 | 80.1 | 86.4 |
Source: Eurostat (edat_lfse_03)
Note: Educational attainment refers to ISCED (International Standard Classification of Education) 2011 level 3-8 for data from 2014 onwards and to ISCED 1997 level 3-6 for data up to 2013. DE: break in time series in 2020. The indicator is based on the EU Labour Force Survey.
2.4.2 Spotlight on vulnerable groups
Looking at specific groups of young people and their circumstances160 can help identify where additional policy attention may be needed, especially given the impact the COVID-19 pandemic can have on students who were already disadvantaged before the crisis.
Young people who were born in another country (foreign-born) are generally at greater risk of leaving education without having completed more than a lower secondary level of education, compared to young people born in the reporting country (Figure 56). This is the case whether they were born in another EU country or in a country outside the EU.
The evidence about the exact underlying reasons is still lacking. Analysis by the Commission’s Joint Research Centre161 shows that determinants are the same for immigrant students and natives: socio-economic background, epistemological beliefs162, pupils repeating a year and the average rate of early leavers from education and training163.
Box 19: Tutoring and career counselling in Italy
Tutoring and career counselling is an educational intervention that could support immigrant pupils, as they may lack relevant networks and access to information.
In Italy, a randomised evaluation of the educational choices of children without Italian citizenship estimated the impact of a tutoring and career counselling programme called “Equality of Opportunity for Immigrant Students”, which targeted immigrant and second generation seventh-grade students displaying high academic potential.
Results showed that the programme encouraged students to enrol in more demanding academic and technical schools and improved boys’ academic performance, as measured by test scores, students repeating a year, and dropout rates. The intervention had no impact on girls, possibly because many did already enrol in the more demanding school tracks. The programme also had positive spill over effects on immigrant classmates who did not participate.
More research is needed to shed light on migrants’ specific educational needs and the effectiveness of action that attempts to address them.
Source: Behaghel, L., Gurgand, M., Kuzmova, V. and Marshalian, M. (2018). European Social Inclusion Initiative, A Review Paper.
In 2020, among the 17 Member States for which data are available, the highest shares of foreign-born early leavers from education and training were in Italy (32.1%), Spain (29.0%), Malta (28.5%), Greece (27.0%), Cyprus (26.8%) and Germany (25.5%). The proportion of early leavers from education and training among the foreign-born young people was below 9% in two countries: Luxembourg (8.7%) and Slovenia (7.4%).
Young people who were born outside the EU are at the highest risk of being early leavers of education and training in all countries, with gaps exceeding 20 pps in Greece, Italy or Cyprus compared to native-born early leavers. The lowest gaps are in Czechia (0.6 pps) and Denmark (2.2 pps).
In all countries for which data for foreign-born young people disaggregated by sex is available, young men who are foreign-born are more likely to be early leavers than young women, and gender gaps are often wider than among the young population born in the reporting country.
Figure 56: Early leavers from education and training by sex, country of birth and degree of urbanisation, 2020 [%]
| Total | Sex | Country of birth | |||||
| Men | Woman | Native-born | Born in another EU country | Born outside the EU | Total foreign-born | ||
| EU | 9.9 | 11.8 | 8.0 | 8.8 | 19.9 | 23.3 | 22.4 |
| BE | 8.1 | 10.2 | 5.9 | 7.5 | 7.2 | 15.6 | 12.1 |
| BG | 12.8 | 13.4 | 12.1 | 12.8 | : | : | : |
| CZ | 7.6 | 7.5 | 7.5 | 7.4 | 19.0 | 8.0 | 13.2 |
| DK | 9.3 | 11.7 | 6.8 | 9.2 | : | 11.4 | 10.4 |
| DE | 10.1 | 11.8 | 8.3 | 7.8 | 24.0 | 26.0 | 25.5 |
| EE | 7.5 | 9.2 | 5.8 | 7.6 | : | : | : |
| IE | 5.0 | 5.4 | 4.7 | 5.2 | : | : | : |
| EL | 3.8 | 4.4 | 3.1 | 2.9 | : | 28.0 | 27.0 |
| ES | 16.0 | 20.2 | 11.6 | 13.2 | 31.2 | 28.5 | 29.0 |
| FR | 8.0 | 9.7 | 6.3 | 7.5 | 16.3 | 13.8 | 14.2 |
| HR | 2.2 | 2.4 | 2.0 | 2.2 | : | : | : |
| IT | 13.1 | 15.6 | 10.4 | 11.0 | 22.1 | 35.2 | 32.1 |
| CY | 11.5 | 15.0 | 8.4 | 4.9 | 25.7 | 27.3 | 26.8 |
| LV | 7.2 | 9.5 | 4.7 | 7.2 | : | : | : |
| LT | 5.6 | 7.7 | 3.4 | 5.6 | : | : | : |
| LU | 8.2 | 10.7 | 5.7 | 7.8 | 8.7 | : | 8.7 |
| HU | 12.1 | 12.9 | 11.3 | 12.1 | : | : | : |
| MT | 12.6 | 14.7 | 10.2 | : | : | : | 20.1 |
| NL | 7.0 | 8.7 | 5.3 | 6.6 | 9.8 | 11.5 | 11.1 |
| AT | 8.1 | 10 | 6.3 | 5.7 | 16.2 | 24.0 | 20.4 |
| PL | 5.4 | 7.0 | 3.7 | 5.4 | : | : | : |
| PT | 8.9 | 12.6 | 5.1 | 8.8 | : | : | 10.8 |
| RO | 15.6 | 14.7 | 16.6 | 15.6 | : | : | : |
| SI | 4.1 | 4.6 | 3.4 | 3.8 | : | 7.4 | 7.4 |
| SK | 7.6 | 7.7 | 7.4 | 7.6 | : | : | : |
| FI | 8.2 | 9.4 | 7 | 7.7 | : | 20.3 | 17.4 |
| SE | 7.7 | 9.0 | 6.3 | 5.3 | : | 16.2 | 15.6 |
Source: Eurostat, EU Labour Force Survey 2020. Online data code: [edat_lfse_02] and [edat_lfse_30].
Note: Early Leavers from Education and Training (ELET) data has low reliability for HR. ELET data by country of birth have low reliability for BE, CZ, DK, HR, MT, SI and FI. ELET data by degree of urbanisation have low reliability for HR, EE, CY, LV, LT, LU, MT and SI. Data are not available for the three degrees of urbanisation in LU, LV and SK.
Evidence on Roma children (outside the official European Statistical System – Eurostat) suggests that as many as 10% of those at compulsory schooling age were not attending education across the EU in 2016164. This share was as high as 31% in EL and 23% in RO. In the nine surveyed Member States, the share of Roma early leavers from education and training was extremely high, ranging between 57% and 92%. Box 20 offers some additional findings on Roma children and their further setbacks during the COVID-19 induced lockdowns.
Box 20: Roma students
Since the outbreak of the COVID-19 pandemic, many Roma children from remote and marginalised communities were lacking the internet access and IT equipment necessary to participate in distance learning. This has increased their risk of dropping out of school or falling behind in education.
Evidence for Bulgaria suggests that Roma children were less prepared for the transition to distance learning, with significantly lower levels of access to the internet and digital devices among students speaking Romani at home, compared to students speaking Bulgarian at home. Romani-speaking children also experienced difficulties using electronic devices (56%, compared to 24% of Bulgarian-speaking children). Similarly, evidence for Slovakia highlights that almost 50 000 children – mainly from poor localities, many of them inhabited by Roma – did not participate in distance learning at all during the first wave of the pandemic.
The Educative Promotion Programme in Extremadura (Spain) supported 1 053 young Roma children with special needs to benefit from individualised mentorship aimed at helping prevent and reduce early-school leaving. Mentors, usually from the Roma community, help create links between the Roma community and the education system.
Source: European Commission (2021). A European Commission Staff Working Document Accompanying the Proposal for a Council Recommendation establishing a European Child Guarantee; European Commission (2017). Commission Communication on the midterm review of the EU framework for national Roma integration strategies; European Union Agency for Fundamental Rights (2020) Coronavirus pandemic in the EU – impact on Roma and Travellers – Bulletin 5; European Union Agency for Fundamental Rights (2020). Coronavirus pandemic in the EU – Fundamental rights implications: focus on social rights.
The available data suggest that location where young people live is also decisive. The last three columns in Figure 56 show the proportion of early leavers from education and training according to the degree of urbanisation, with regions classified as cities, towns and suburbs, or rural areas. The lowest share of early leavers in the EU is reported in cities (8.7%). The proportion of early leavers is the highest in towns and suburbs (11.2%), while it is somewhat lower in rural areas (10.5%). The picture is, however, quite uneven across Member States165.
Importantly, where the young population is more concentrated in cities, the number of early leavers may be largest in absolute terms. Data from 2019 Eurobarometer poll suggest that the proportion of young people reporting that they live in rural area or village is 26%, while 74% report living in a town (40% in small or middle-sized towns and 34% in a large town)166.
The EU average share of early school leavers among young men is higher than among young women across all degrees of urbanisation167. In 2020, the EU average gender gap was widest in towns and suburbs (4.8 pps), followed by cities (3.7) and rural areas (2.5)168.
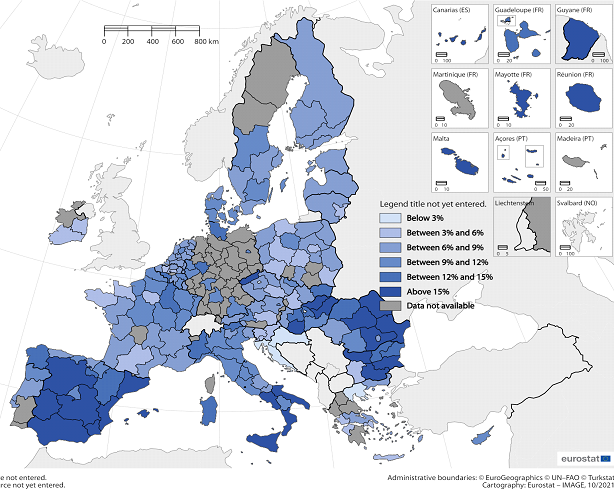
Figure 57 shows the wide disparities across regions at NUTS 2 level in 2020. Some of the lowest shares of early leavers from education and training are concentrated in Eastern Europe and in capital regions. The share of early leavers from education and training is also relatively high in most regions of southern Europe and across most regions of Bulgaria and Romania. Although the share of early leavers from education and training is comparatively low in western Member States such as Belgium or France, some regions also record relatively high shares.
Figure 57: Early leavers from education and training by NUTS 2 regions, 2020 [%]
2.4.3 Spotlight on the transition from school to work
Unemployment and inactivity are widespread among young people who have not completed upper secondary education and who are lacking the credentials deemed crucial for the labour market or pursuing further education. In 2020, only 42.4% of the early leavers in the EU were in employment, whereas 35.4% were not employed but wanting to work. The remaining early leavers (22.2%) were not employed and did not want to work (Figure 58).
The share of early leavers who are employed is highest in Malta, Romania, and Cyprus, suggesting that these labour markets offer opportunities for young people, especially young men, who have relatively low education attainment. By contrast, five Member States reported more early leavers not employed but wanting to work than early leavers who were employed (Croatia, Italy, Ireland, Spain, France and Slovakia). The biggest gap – 2.1 percentage point – is reported in Italy, where the share of early leavers who were employed stood at 4.3%, compared with a 6.4% share of early leavers who were not employed but wanted to work.
Figure 58: Early leavers from education and training by sex and employment status, 2020 [%]
The share of young men who are early leavers in employment (5.9%) or not employed but who would like to work (4.2%) is much higher than the respective shares among young women, as among women, 2.5% are employed early leavers and 2.8% are not employed early leavers who would like to work. Young women who are early leavers from education and training are also more likely to not want to work (2.7% of them report they do not want to work) when compared to young men (1.7% of male early leavers report that they do not want to work)170.
Early leavers from education and training are at greater risk of becoming NEETs (young people not in employment, employment education or training) and socially excluded, often detached from the labour market and further education and learning opportunities. Indeed, the policy focus on prevention and early intervention should not distract from the equally daunting challenge of helping young people who have nevertheless become early leavers find their way back to education or training. Without such compensatory measures, an 18 year-old early leaver may still be recorded as an early leaver six years from now. But the road back to education and training is not always an easy one.
Box 21: The impact of the COVID-19 pandemic
It will take time to assess the impact of the COVID-19 pandemic on the share of early leavers from education and training. A number of studies suggest that physical school closures, which were prolonged in some countries, tended to increase the likelihood for students who were at risk of disconnecting from school to actually drop out171.
As presented in sections 1.4 and 1.5, teachers help students in their learning of academic as well as social and emotional skills. Despite efforts to maintain learning continuity during the period of physical school closures through online education and various forms of support, students had to rely much more on their own resources to continue learning remotely. Insufficient financial resources, supervision and emotional support at home is a persistent source of structural disadvantage for children and adolescents, predating the pandemic.
There are wide inequalities in the availability of home environments conducive to learning, for example having access to a quiet space or study desk at home, as well as in access to the broadband and computers needed for online education172. Socio-economically disadvantaged students may lack the necessary engagement or ability to learn on their own, and the emotional support for developing educational aspirations and perseverance. In households where parents have lost their jobs, teenagers may try to enter the labour market to contribute to the family income.
The period of physical school closures has tended to exacerbate inequalities. Students may have found it more difficult to connect and participate in online lessons, and may have found it hard to go back to schools once it became possible, especially in groups that were already at higher risk of falling behind before the pandemic, who relied on the school to help them maintain a predictable day-to-day routine, those with less access to the broadband and equipment needed, socio-economically disadvantaged students, students with a migrant background, or pupils living in remote areas.
On the other hand, reduced employment prospects may erode the incentives to leave education and training before completing upper secondary attainment, as could be observed in earlier crises. Further evidence is needed to study all these different scenarios.
2.4.4 Policy takeaways
Higher levels of education attainment are associated with benefits at the individual, social and economic levels. The expected benefits from completing upper secondary education include better health and well-being, better social networks, improved labour market outcomes, increased participation in democratic institutions and other civil society initiatives, organisations and higher lifetime satisfaction173.
Young people who did not complete upper secondary education and who are not receiving any further education or training are less likely to fulfil their potential. They were at a higher risk of low achievement when they were in education and are less likely to have reached a baseline level of proficiency in basic skills. They can face difficulties in finding employment that matches their preferences and expectations, especially where labour markets are more high-skilled174.
Individuals with lower levels of education attainment have been more severely affected by the economic downturn following the pandemic than their more highly educated peers, as was also the case in previous downturns175. In this context, prevention and early intervention are especially important.
For those young people who did leave education and training prematurely, compensatory support is needed to help them in their difficult labour market integration, or on their way back to education or training. The Commission’s reinforced Youth Guarantee176 plays an important role here, reaching out to vulnerable groups and activating them with tailored support so that they can take up an offer of employment, continued education, an apprenticeship or a traineeship.
Mastering multiple languages is key to enhancing the life and work of all individuals. In addition to improving people’s general ability to move around the EU to work, study, etc., especially lifelong and innovative learning, and removing barriers to social inclusion, language learning was identified by the EU as a key enabler to achieving the EU’s vision for a European Education Area by 2025 in which “learning, studying and doing research would not be hampered by borders”177.
The Council’s 2019 Recommendation on a comprehensive approach to the teaching and learning of languages178 supports this vision and sets the ambitious goal of ensuring that, by the time young people leave upper secondary education, they can speak at least three languages. In addition to this, by introducing the concepts of “literacy” and “language awareness”, the Recommendation aims to change the attitudes among policymakers and teachers, inspiring them to adopt comprehensive language education policies, as well as innovative and inclusive language teaching methods.
Moreover, drawing on the lessons from implementing policies in the last decade179, the Commission announced two new initiatives to promote the inclusive dimension of school education: the Pathways to School Success initiative and the establishment of an expert group to develop proposals for creating supportive learning environments for groups of students at risk of low achievement and for supporting well-being at school180.
The “Pathways to School Success” initiative is expected to focus on (1) helping all learners reach a baseline level of proficiency in basic skills; (2) promoting educational success strategies at national level, including language sensitive teaching; and (3) stimulating a safe and supportive school environment. In the context of early leavers from education and training, this will create new momentum for the triple objective of prevention, intervention and compensation.
2.5 Tertiary level attainment
In a nutshell
Member States have agreed on an EU-level target stating that the share of 25-34 year-olds with tertiary educational attainment should be at least 45% by 2030181. This supersedes the ET2020 40% benchmark, which was achieved in 2019182. In 2020, this share stood at 40.5% in the EU, but with substantial differences between and within countries. Eleven countries have tertiary educational attainment rates above the EU-level target. The average share of 25-34 year-olds with tertiary educational attainment is 10.8 pps higher among women (46.0%) than it is among men (35.2%). Moreover, there are clear discrepancies between urban and rural areas; the average rate in cities (50.9%) being substantially higher than it is in rural areas (28.9%).
2.5.1 Progress towards the EU-level target
On average, the share of 25-34 year-olds with tertiary educational attainment was 40.5% in the EU in 2020 (Figure 59). The share has increased steadily across the EU since 2010, with an overall increase of 8.3 pps. The difference between countries is pronounced, spanning from 24.9% in Romania to 60.6% in Luxembourg. Eleven countries have tertiary educational attainment rates above the EU-level target and a further nine are within five pps of the target value. In contrast, only three countries had attainment rates higher than the present target in 2010, underlining the development over the past decade.
Box 22: Expanding the tertiary vocational system in Italy
The Italian government is taking steps to expand the existing network of Istituti Tecnici Superiori (ITS), tertiary-level vocational institutions that offer graduates excellent employment prospects, but have so far remained limited in scope. A reform is under way with the aim of strengthening the ITS organisational and educational model. It provides for a stronger role for business within the ITS foundations and simplifies the recruitment of trainers from the business world. The reform also provides for a better integration of the ITS in the system of vocational tertiary education, and stronger coordination with the recently introduced tertiary professional degrees. Coordination between vocational schools, ITS and businesses will be ensured by involving schools, universities and businesses. The objective is to double the number of ITS students (currently 18 750) and graduates (currently 5 250) by 2026. The reform is backed by funding of €48 m for 2021 and €68 m from 2022, in addition to €1.5 bn from the Recovery and Resilience Facility.
Figure 59: Tertiary educational attainment 25-34 year-olds by country, 2010 and 2020 [%]
Austria, Luxembourg, Portugal, Malta and Slovakia are amongst the countries having made most progress since 2010, seeing increases in the tertiary educational attainment rate in excess of 15 pps. Looking at the relative increase in the attainment rate, Austria made most progress by doubling the rate183. At the other end of the spectrum, we find Estonia, Belgium, Hungary, Finland and Romania, where the increase since 2010 has been less than five pps. This only presents part of the picture, however. Estonia, Belgium and Finland already had high attainment rates in 2010, and by 2020 had attainment rates of 43.1%, 48.5% and 43.8%, respectively. In contrast, Hungary (30.7%) and Romania (24.9%) are amongst the Member States with the lowest attainment rates, having made very little progress since 2010.
Figure 60 compares the attainment rates of men and women. The average share of 25-34 year-olds with tertiary educational attainment is 10.8 pps higher among women (46%) than it is among men (35.2%). In all countries, women are more likely to have completed tertiary education than men are. The most striking differences are present in Lithuania, Estonia, Latvia, Slovenia and Cyprus, where the difference in the attainment rate exceeds 20 pps. Germany has the lowest discrepancy between men and women, with 2.5 pps, and is the only country where the difference is less than five pps.
Interestingly, the size of the gap between men and women does not appear to be associated with high or low levels of educational attainment at the country level. The educational attainment rate in the five countries with the widest gaps were all in excess of 40%. Comparably, three out of five countries with the smallest gaps also had attainment rates above 40%, the exceptions being Germany and Romania.
Figure 60: Tertiary educational attainment 25-34 year-olds by sex, 2020 [%]
In all but seven countries, the 45% EEA target has been surpassed in the female population. Looking at the male population, this is only the case in six countries. Moreover, 19 countries have yet to reach a tertiary educational attainment rate above 40% for men. The average gap between men and women in the EU has increased by 1.7 percentage points between 2010 (9.1 percentage points) and 2020 (10.8). Only five countries (Bulgaria, Ireland, France, Latvia and Finland184) has seen a reduction in the gap in this period. Going forward, reducing the gender gap in tertiary educational attainment will have to be addressed if the 2030 target is to be reached.
2.5.2 Spotlight on vulnerable groups
In 2020, the average rate of tertiary educational attainment in the EU was highest in cities (50.9%), while the lowest was reported in rural areas (28.9%). This is consistent across all countries185.
The average gap in the EU between rural areas and cities is more than 20 pps. Moreover, the difference exceeds 30 pps in six countries (Luxembourg, Romania, Bulgaria, Hungary, Denmark and Poland). In only five countries is the gap smaller than 15 pps (Cyprus, Slovenia, Spain, Italy and Belgium).
Considering the urban-rural divide in more detail, there is a marked increase in the gender gap with reduced degrees of urbanisation. In cities, the average gap between the attainment rates of women (55.5%) and men (46.3%) stood at 9.2 pps in the EU in 2020. This gap widens when looking at towns and suburbs, where the average gap between women (40.0%) and men (29.2%) was 10.8 pps. The lowest attainment rates, and the largest gap, is found in rural areas, where the gap between women (35.6%) and men (22.6%) was 13.0 pps.
Figure 61: Tertiary educational attainment of 25-34 year-olds by degree of urbanisation and country of birth, 2020 [%]
| Total | Degree of ubranisation | Country of birth | ||||||
| Cities | Towns and suburns | Rural areas | Native-born | Born in another EU country | Born outside the EU | Total foreign-born | ||
| EU | 40.5 | 50.9 | 34.5 | 28.9 | 41.3 | 40.4 | 34.4 | 36 |
| BE | 48.5 | 51.8 | 46.4 | 46.5 | 51.1 | 48.2 | 34.0 | 39.6 |
| BG | 33 | 46.6 | 25.6 | 13 | 32.9 | : | : | : |
| CZ | 33.0 | 47.0 | 27.8 | 24.1 | 32.3 | 50.8 | 41.3 | 46.3 |
| DK | 47.1 | 61.1 | 39.2 | 30.1 | 47.1 | 61.9 | 40.7 | 47.3 |
| DE | 35.1 | 43.2 | 29.5 | 25.4 | 35.1 | 38.9 | 33.3 | 35.0 |
| EE | 43.1 | 53.1 | 32.2 | 31.9 | 41.7 | 84.2 | 60.5 | 65.6 |
| IE | 58.4 | 68.4 | 52.1 | 49.5 | 56.0 | 47.7 | 73.6 | 63.2 |
| EL | 43.7 | 50.0 | 46.1 | 29.1 | 46.2 | 25.1 | 14.8 | 16.2 |
| ES | 47.4 | 52.8 | 40.5 | 40.8 | 52.4 | 35.0 | 31.1 | 31.9 |
| FR | 49.4 | 58.2 | 45.1 | 36.0 | 49.5 | 55.2 | 48.0 | 49.1 |
| HR | 36.6 | 51.3 | 36.9 | 24.8 | 36.2 | 45.2 | 42.0 | 42.5 |
| IT | 28.9 | 34.6 | 26.6 | 23.3 | 32.2 | 12.3 | 14.0 | 13.6 |
| CY | 57.8 | 63.1 | 50.5 | 49.2 | 68.7 | 34.4 | 39.9 | 37.9 |
| LV | 44.2 | 54.7 | 40.9 | 31.6 | 44.0 | : | 49.9 | 51.6 |
| LT | 56.2 | 68.3 | 47.0 | 41.5 | 56.1 | : | 62.6 | 62.0 |
| LU | 60.6 | 87.3 | 51.3 | 48.8 | 48.6 | 70.5 | 65.9 | 69.0 |
| HU | 30.7 | 47.7 | 27.8 | 15.2 | 30.2 | 46.2 | 48.6 | 47.4 |
| MT | 40.1 | 37.7 | 42.9 | 37.8 | 37.7 | 51.3 | 46.3 | 48.1 |
| NL | 52.3 | 57.9 | 43.2 | 38.5 | 52.8 | 55.6 | 45.0 | 47.9 |
| AT | 41.4 | 50.8 | 35.8 | 34.9 | 42.1 | 49.2 | 31.6 | 39.7 |
| PL | 42.4 | 60.3 | 36.9 | 29.8 | 42.2 | 65.4 | 62.6 | 63.1 |
| PT | 41.9 | 49.9 | 39.0 | 29.6 | 42.5 | 47.9 | 34.0 | 36.7 |
| RO | 24.9 | 45.9 | 19.3 | 8.0 | 24.8 | : | : | : |
| SI | 45.4 | 54.9 | 43.8 | 41.9 | 48.2 | 25.2 | 22.9 | 23.0 |
| SK | 39.0 | 58.2 | 36.8 | 31.0 | 39.1 | : | : | : |
| FI | 43.8 | 51.9 | 38.3 | 29.1 | 45.2 | 31.7 | 32.2 | 32.1 |
| SE | 49.2 | 60.9 | 42.8 | 33.4 | 49.9 | 69.0 | 42.2 | 47.2 |
Source: Eurostat, EU Labour Force Survey. Online data codes: [edat_lfs_9913] and [edat_lfs_9912].
The educational attainment rate is generally lower for people born outside the EU compared to people born in the EU. In 2020, the EU average tertiary educational attainment rate for 25-34 year-olds stood at 41.3% for native-born people and 40.4% for people born in another EU country than the reporting country. The EU average tertiary educational attainment rate for people born outside the EU, in contrast, was 34.4%.
While there is some variability at the country level, the general trend is that the rate of tertiary educational attainment for people born outside the EU is lower than it is for native-born people and people born in another EU country186. The widest gaps between native-born people and people born outside the EU are present in Greece (31.4 pps), Cyprus (28.8 pps), Slovenia (25.3 pps), Spain (21.3 pps), Italy (18.2 pps) and Belgium (17.1 pps), where more than 15 pps separate the two groups. Italy (14.0%), Greece (14.8%) and Slovenia (22.9%) have the lowest overall tertiary attainment rates for people born outside the EU, the only countries where the rate for this group is below 30%.
Notable exceptions to the general trend of people born outside the EU having lower attainment rates include Poland, Estonia, Hungary, Ireland and Luxembourg, where the gap is in the opposite direction. In these countries, the tertiary attainment rate is in excess of 15 pps higher for people born outside the EU compared to native-born people.
2.5.3 Spotlight on learning mobility
The opportunity for learners to move abroad to study (‘mobility’) is a key element of EU cooperation and a tool to enhance quality and inclusion in education and training. It is associated with a greater likelihood to work abroad in the future, higher earnings and lower unemployment. Efforts to remove existing obstacles and barriers to all types of learning mobility will be central in moving towards the establishment of a European Education Area by 2025. Moreover, generating more opportunities for student mobility and young researchers by encouraging closer and deeper cooperation between higher education institutions will be a priority over the next decade under the strategic framework for European cooperation in education and training towards the European Education Area and under the European Research Area.
While the COVID-19 pandemic is likely to have significantly affected the process of internationalising higher education, it will take time before the full effect of the pandemic is reflected in data on learning mobility – especially for graduates187. In 2019, the academic year before COVID-19, 14.4% of higher education graduates in the EU were mobile, had completed part or all of their studies abroad (Figure 62)188. The highest shares of such graduates were present in Luxembourg (88.1%), Cyprus (35.9%), the Netherlands (26.4%) and Slovakia (21.1%), with more than 20% of the graduates having spent time abroad.
In a further 17 EU Member States, between 10 and 20% of the graduates participated in cross-border mobility. Only five countries had a total mobility rate below 10% (Poland, Slovenia, Romania, Croatia and Hungary), a common denominator being a low share of graduates with temporary experience abroad at the bachelor’s level189.
Figure 62: Outward degree and credit mobility of graduates by ISCED level, 2019 [%]
| Total mobility (credit+degree) | Credit mobility | Degree mobility | |||||||||||||
| 5-8 | 5 | 6 | 7 | 8 | 5-8 | 5 | 6 | 7 | 8 | 5-8 | 5 | 6 | 7 | 8 | |
| EU | 14.4 | 5.1 | 11.8 | 18.6 | 33.9 | 9.8 | 2.6 | 8.3 | 12.7 | 18.9 | 4.6 | 2.5 | 3.5 | 5.9 | 15.0 |
| BE | 10.8 | : | 10.4 | 11.8 | : | 6.6 | : | 7.7 | 5.8 | : | 4.2 | 6.6 | 2.7 | 6.0 | 11.5 |
| BG | 10.7 | : | 11.6 | 8.0 | 16.5 | 1.5 | : | 1.5 | 1.3 | 3.8 | 9.2 | : | 10.0 | 6.7 | 12.7 |
| CZ | 12.6 | 55.6 | 9.5 | 14.5 | 20.6 | 7.4 | 0.0 | 5.0 | 10.1 | 13.3 | 5.1 | 55.6 | 4.5 | 4.4 | 7.3 |
| DK | 11.3 | 3.4 | 11.3 | 14.1 | 27.2 | 9.5 | 2.8 | 10.0 | 10.9 | 20.5 | 1.8 | 0.7 | 1.3 | 3.3 | 6.7 |
| DE | 16.3 | : | 13.6 | 22.5 | : | 11.6 | : | 10.6 | 15.2 | : | 4.7 | 10.6 | 2.9 | 7.3 | 9.6 |
| EE | 16.3 | : | 14.5 | 15.3 | : | 5.4 | : | 5.6 | 5.6 | : | 10.9 | : | 8.8 | 9.7 | 23.7 |
| IE | : | : | : | : | : | : | : | : | : | : | 6.0 | 3.8 | 3.6 | 11.0 | 21.4 |
| EL | 12.7 | : | 5.7 | 22.9 | : | 0.0 | : | 0.0 | 0.0 | : | 12.7 | : | 5.7 | 22.9 | 32.9 |
| ES | 10.9 | 1.7 | 17.3 | 9.4 | 40.0 | 8.6 | 1.3 | 15.4 | 5.2 | 30.0 | 2.2 | 0.4 | 1.9 | 4.1 | 10.1 |
| FR | 18.3 | 5.7 | 14.5 | 31.6 | 20.9 | 14.8 | 4.4 | 10.0 | 27.8 | 8.5 | 3.4 | 1.2 | 4.5 | 3.8 | 12.4 |
| HR | 7.7 | 72.8 | 5.1 | 9.2 | 26.3 | 3.6 | 0.0 | 2.1 | 5.2 | 7.6 | 4.0 | 72.8 | 3.0 | 4.0 | 18.8 |
| IT | 16.6 | : | 9.7 | 18.6 | 145.2 | 11.7 | : | 6.9 | 12.6 | 118.0 | 4.9 | 28.0 | 2.8 | 5.9 | 27.2 |
| CY | 35.9 | 17.0 | 56.3 | 20.8 | 63.1 | 2.1 | 0.5 | 4.5 | 0.3 | 2.9 | 33.8 | 16.4 | 51.9 | 20.4 | 60.2 |
| LV | 13.6 | 6.0 | 15.8 | 15.3 | 40.7 | 5.5 | 2.2 | 7.0 | 5.3 | 10.7 | 8.2 | 3.8 | 8.8 | 10.0 | 29.9 |
| LT | 16.9 | : | 15.3 | 15.8 | 35.6 | 6.6 | : | 7.3 | 5.0 | 10.4 | 10.3 | : | 8.1 | 10.9 | 25.2 |
| LU | 88.1 | : | 96.5 | 88.1 | 84.3 | 12.1 | : | 21.5 | 0.3 | 3.4 | 75.9 | 14.3 | 75.0 | 87.8 | 80.9 |
| HU | 8.7 | 7.9 | 6.8 | 12.0 | 14.9 | 4.0 | 0.3 | 3.1 | 6.3 | 1.5 | 4.7 | 7.5 | 3.7 | 5.7 | 13.4 |
| MT | 14.7 | 3.7 | 12.2 | 19.7 | 62.1 | 5.3 | 0.0 | 9.6 | 0.1 | 0.0 | 9.3 | 3.7 | 2.7 | 19.6 | 62.1 |
| NL | 26.4 | 11.7 | 26.4 | 26.3 | : | 23.0 | 4.7 | 25.0 | 19.8 | : | 3.3 | 7.0 | 1.4 | 6.5 | : |
| AT | 15.0 | : | 20.5 | 23.7 | 35.9 | 8.9 | : | 13.3 | 13.5 | 12.6 | 6.2 | 0.3 | 7.2 | 10.2 | 23.3 |
| PL | 2.9 | 89.1 | 1.9 | 4.2 | 13.7 | 1.5 | 0.0 | 1.0 | 2.5 | 1.9 | 1.4 | 89.1 | 0.9 | 1.6 | 11.8 |
| PT | 12.5 | 12.9 | 11.7 | 13.7 | 20.0 | 6.6 | 0.1 | 7.2 | 7.0 | 0.4 | 6.0 | 12.8 | 4.5 | 6.7 | 19.6 |
| RO | 7.3 | : | 6.6 | 6.7 | 19.2 | 1.6 | : | 1.8 | 1.4 | 1.3 | 5.6 | : | 4.9 | 5.3 | 17.9 |
| SI | 5.6 | 2.2 | 3.6 | 8.1 | 23.0 | 0.0 | 0.0 | 0.0 | 0.0 | 0.0 | 5.6 | 2.2 | 3.6 | 8.1 | 23.0 |
| SK | 21.1 | : | 21.5 | 20.1 | 20.2 | 4.0 | : | 3.3 | 4.9 | 4.2 | 17.0 | 34.4 | 18.2 | 15.2 | 16.0 |
| FI | 19.1 | : | 16.6 | 24.4 | 8.7 | 14.7 | : | 13.2 | 18.7 | 2.4 | 4.4 | : | 3.3 | 5.7 | 6.2 |
| SE | 15.6 | 3.6 | 15.4 | 20.9 | 15.7 | 10.8 | 0.3 | 11.3 | 14.8 | 5.6 | 4.9 | 3.3 | 4.1 | 6.1 | 10.2 |
Source: Eurostat, UOE, and OECD. Online data codes: [educ_uoe_grad01], [educ_uoe_mobc01] and [educ_uoe_mobg02]. Special extraction from the OECD of international graduate data for degree-mobile graduates of EU origin who graduated in non-European countries (Australia, Canada, Chile, Colombia, Israel, Japan, Korea, New Zealand, Brazil and Russia).
At EU-level, 9.8% of the higher education graduates were credit mobile, having a temporary experience abroad (Figure 62)190. In contrast, only 4.6% of graduates were degree mobile, graduating in a country that was not the one where they received their upper secondary qualification. The share of credit mobile graduates tended to be higher than the share of degree mobile graduates in most countries. Notable exceptions include Luxembourg and Cyprus, where the share of degree mobile graduates were respectively 63.7 pps and 31.7 pps higher than the share of credit mobile graduates.
Box 23: COVID-19 and online international student experiences
Due to the COVID-19 pandemic, an increasing number of universities around the world have chosen to deliver online education to international students to avoid travel, visa and health issues. But it remains unclear if this alternative is effective.
On the one hand, studying like this has several advantages. The most relevant is the opportunity to reach more students. Many students willing to study abroad cannot afford travel and other costs associated with living in a foreign country. And some would typically not consider such an option due to personal or employment reasons. In the recent past, international education has counted on a growing demand driven by more and more students entering higher education, increasingly interested in gaining a greater understanding of the world. Additionally, although online learning cannot replace the campus experience, a virtual learning environment still enables students to engage in cross-border collaborations, thus developing and improving intercultural understanding and global mindedness.
On the other hand, however, this mode of study abroad may not confer the same benefits doing so physically. First, there is evidence showing that students often feel less motivated when learning online rather than learning in person191. Second, some types of learning (e.g. doing experiments in laboratories for natural science students or visiting patients in hospitals for medical students) cannot take place virtually. Third, international students following online education miss out important social and cultural elements of a study abroad experience including living in a foreign country, enjoying the social life on campus and becoming familiar with other cultures. The results of a study192 based on survey among EU students studying in the United Kingdom would seem to support this argument. Respondents report that one of the main reasons behind their decision to study abroad was to broaden their horizons or experience other cultures. Fourth, studying abroad online does not enable international students to gain access to foreign job markets.
Credit mobility through EU-funded programmes, such as Erasmus+, was the dominant form of outbound credit mobility amongst credit mobile graduates in the majority of Member States in 2019 (Figure 63)193. These programmes accounted for more than half of the graduate credit mobility in 21 countries. In 17 of these, mobility through EU programmes exceeded 75% of the total graduate credit mobility. The highest shares were present in Cyprus (100%), Malta (99.2%), Latvia (99.1%), Slovenia (94.7%), Romania (97.6%) and Bulgaria (96.6%), where more than 95% of the credit mobile graduates participated in EU-funded programmes.
Figure 63: Credit mobility by type of programme, 2019 [%]
Only five EU Member States recorded a higher percentage of graduates with periods of foreign study supported by non-EU programmes than through EU programmes (France, Denmark, Sweden, the Netherlands and Germany). Combined, graduates from these five countries constituted 63% of the credit mobile graduates in the EU in 2019. The main contributors to the outward credit mobility through non-EU programmes were France (45.7% of the total credit mobility through non-EU programmes), Germany (17.8%) and the Netherlands (11.7%).
The rate of inward degree-mobile graduates ranged from 1.7% in Greece to 24.1% in Luxembourg in 2019 (Figure 64)194. At EU level, the rate stood at 8.3%. In 16 Member States, the inward degree mobility rates were below 10%. Luxembourg (24.1%), the Netherlands (19.6%) and Austria (16.5%) recorded the highest rates, and were the only countries with inward graduate degree mobility rates above 15%. France was the most popular destination country in terms of absolute numbers (89 492 inwardly degree-mobile graduates), followed by Germany (53 835), the Netherlands (26 338) and Spain (22 205).
Figure 64: Inward degree mobility by ISCED level, 2019 [%]
| Inward degree mobility rate | Inward mobile graduates | ||||||
| ISCED 5-8 % |
ISCED 5 % |
ISCED 6 % |
ISCED 7 % |
ISCED 8 % |
ISCED 5-8 N |
From EU % |
|
| EU | 8.3 | 2.1 | 4.9 | 13.5 | 24.3 | 312 273 | 29.7 |
| BE | 10.7 | : | 6.6 | 16.6 | 46.3 | 11 472 | 52.2 |
| BG | 3.8 | : | 2.5 | 5.2 | 8.4 | 2 044 | 38.8 |
| CZ | 13.5 | 2.3 | 12.0 | 15.2 | 19.3 | 9 046 | 63.6 |
| DK | 14.7 | 16.1 | 7.7 | 25.5 | 58.0 | 10 766 | 65.5 |
| DE | 8.6 | 0.0 | 4.2 | 15.5 | 22.7 | 53 835 | 24.5 |
| EE | 13.1 | : | 7.3 | 23.4 | 19.6 | 1 153 | 40.4 |
| IE | 12.1 | 3.2 | 7.5 | 25.7 | 30.8 | 9 778 | 16.0 |
| EL | 1.7 | : | 2.3 | 0.7 | 1.7 | 1 364 | 71.8 |
| ES | 5.0 | 1.2 | 1.5 | 13.1 | 16.8 | 22 205 | 26.5 |
| FR | 11.2 | 2.5 | 8.8 | 18.8 | 52.8 | 83 492 | 13.2 |
| HR | 2.5 | 0.0 | 2.1 | 2.6 | 9.2 | 881 | 13.5 |
| IT | 4.2 | : | 3.3 | 5.2 | 12.1 | 17 704 | 17.1 |
| CY | 8.5 | 18.9 | 8.8 | 7.0 | 6.1 | 1 185 | 61.1 |
| LV | 6.6 | 0.5 | 4.8 | 15.6 | 5.6 | 990 | 32.1 |
| LT | 4.5 | : | 2.8 | 9.5 | 3.9 | 1 207 | 20.1 |
| LU | 24.1 | 30.5 | 7.0 | 44.4 | 102.2 | 864 | 68.2 |
| HU | 8.9 | 1.1 | 5.4 | 16.9 | 10.9 | 5 354 | 30.9 |
| MT | 13.2 | 6.8 | 5.7 | 28.4 | 8.0 | 622 | 18.2 |
| NL | 19.6 | 0.0 | 12.7 | 38.5 | : | 26 338 | 55.9 |
| AT | 16.5 | 0.3 | 19.9 | 28.9 | 46.1 | 12 663 | 74.3 |
| PL | 2.5 | : | 2.0 | 3.6 | 2.2 | 11 279 | 10.8 |
| PT | 7.1 | 1.9 | 3.2 | 14.0 | 35.4 | 5 673 | 22.6 |
| RO | 4.5 | : | 2.7 | 7.3 | 6.5 | 5 687 | 21.8 |
| SI | 3.8 | 1.5 | 2.9 | 5.8 | 6.9 | 616 | 49.0 |
| SK | 5.5 | 0.5 | 5.6 | 5.5 | 8.0 | 2 522 | 58.1 |
| FI | 9.3 | : | 6.1 | 13.6 | 40.1 | 5 236 | 17.5 |
| SE | 11.4 | 0.2 | 2.3 | 25.0 | 58.1 | 8 297 | 31.3 |
Source: Eurostat, UOE, and OECD. Online data codes: educ_uoe_grad01, educ_uoe_mobg02 and educ_uoe_mobc01 for graduates, degree-mobile graduates and credit-mobile graduates in the EU, EFTA, EEA and candidate countries. Special extraction from the OECD of international graduate data for degree-mobile graduates of EU origin who graduated in non-European countries (Australia, Canada, Chile, Colombia, Israel, Japan, Korea, New Zealand, Brazil and Russia).
Note: The inward degree mobility rate in country X is calculated as (inward degree-mobile graduates in country X / graduates originating in country X). Graduates originating in country X is calculated as (total graduates in country X – inward mobile graduates from any other country to country X + outward mobile graduates from country X to any other country). The inward mobility rate for the EU is calculated as (inward degree-mobile graduates in the EU / graduates originating in the EU). The number of graduates originating in the EU is calculated as (number of graduates in the EU – inward degree-mobile graduates from non-EU countries to the EU + outward degree-mobile graduates from the EU to non-EU countries). Country of origin is defined as country of prior education or upper secondary diploma. Data on ISCED 8 are not available for NL. Inward-degree mobility data are not available for SI disaggregated by country of origin.
Close to one in three inward degree mobile graduates across the EU originated in the EU in 2019 (29.7%), followed by graduates originating in Asia (22.7%), Africa (16.6%) and European countries outside the EU (13.3%)195. There were substantial variations among Member States when it comes to the share of intra-EU inward graduate degree mobility, ranging from 10.8% to Poland to 74.3% to Austria. These differences can be explained by factors such as geographical proximity, common language and historical ties.
2.5.4 Policy takeaways
Higher education has a unique role to play in building successful, inclusive societies. Moreover, higher levels of education attainment are associated with benefits at the individual, social and economic levels. Demand for highly skilled, socially engaged people is both increasing and changing, as labour markets are transforming rapidly, due to technological development, digital and green transitions. The higher education sector must respond to these needs to adequately skill the talents of tomorrow. The COVID-19 pandemic is another factor that has highlighted existing challenges, and presented new ones, while at the same time created opportunities for further synergies between higher education, research and innovation to provide solutions within the planned higher education transformation agenda196. One avenue for approaching these challenges is the European Universities Initiative197, which encourages deeper cooperation between higher education institutions across borders.
The attainment rates in higher education have been increasing steadily over the past decade, but there is still considerable variation between countries and sub-groups within countries (e.g. gender gap, urban-rural divide). Notably, there is a persisting under-representation of students with disadvantaged background in higher education. Moreover, evidence suggests that disadvantaged communities in both inner city and isolated rural regions were among the most severely affected during the pandemic198. Those with high-level qualifications face better labour market perspectives, and insights from the European skills forecast suggests that people employed in highly skilled occupations are less likely to be replaced by technology in the future199.
2.6 Work-based learning
In a nutshell
Work-based learning helps young people and adults make smoother transitions from school or from unemployment to the labour market. Member States agreed on an EU-level target to ensure that, by 2025, at least 60% of recent graduates from vocational education and training (VET) will have been exposed to work-based learning during their formal education. Data underpinning the EU-level target will be available as of 2022. In the field of VET, other important indicator domains concern the employability of recent graduates and number studying abroad during their formal education. 76.1% of recent VET graduates were employed in 2020, outperforming their peers from medium-level general education. Statistics on numbers studying abroad are also awaiting underlying data, to be sourced from a combination of administrative Erasmus+ and the UNESCO, OECD and Eurostat (UOE) data.
The 2020 Council Recommendation on VET for sustainable competitiveness, social fairness and resilience200 further developed the European policy framework for VET in light of the social, economic, technological and environmental developments, but also the COVID-19 crisis201.
The Recommendation set three targets to be achieved at European level by 2025: 1) 60% of recent graduates from VET have been exposed to work-based learning; 2) the share of employed recent graduates from VET should be at least 82%; 3) 8% of VET learners benefit from a learning mobility abroad. Although only the first was incorporated into the EEA strategic framework, this section briefly looks at all three VET target domains.
2.6.1 New data for the EU-level target
The target for work-based learning is the one VET target included among the seven adopted by Member States as part of the 2021 Council Resolution on a strategic framework for European cooperation in education and training towards the European Education Area and beyond (2021-2030). Unlike the five EU-level targets discussed in this chapter so far, the target on work-based learning is still awaiting its underlying data to monitor country performance and progress.
This is the very first year that new data on work-based learning is collected in the EU Labour Force Survey (LFS), with results available in the course of 2022. More specifically, a new variable will refer to work experiences at a workplace202 that were part of the curriculum leading to the highest level of education successfully completed. The EU-level target based on this new data will cover the age group 20 to 34 who graduated from a medium-level (ISCED 3-4) programme with a vocational orientation between 1 and 3 years before the year of the survey.
Box 24: The PRÕM-project in Estonia
The project brings vocational education and training (VET) and higher education closer to the needs of the labour market. One of its main aims is to improve the image of the vocational stream and develop a comprehensive work-based learning system. PRÕM has already helped improve the quality of work-based learning and expand apprenticeship programmes. During its implementation, which runs from 2015 to 2022, the share of graduates in work-based learning in VET has already increased from 2% to 15%. Employers are now more aware of work-based learning. By 2020, 6 700 students had participated in the project and apprenticeships were being offered by 1 300 companies. More than 6 000 apprenticeship supervisors had been trained in schools and companies. This approach was successfully extended to higher education as well: certain learning outcomes, as defined in the curricula, can be fulfilled by carrying out practical work. The universities remain responsible for the study part, but companies are involved in developing and evaluating the curriculum. PRÕM receives close to €27 m from the European Social Fund.
The new variable will allow for regular collection of information on work-based learning, enabling the annual monitoring of progress towards the 60% EU-level target. The new variable avoids terms such as apprenticeships or traineeships, distinguishing instead between five main categories of work-based learning, based on duration and payment criteria203. These categories will provide an insight into which type of work-based learning is most relevant for transition rates and for staying in employment.
2.6.2 Spotlight on VET employability and learning mobility
The other two targets from the 2020 VET Recommendation are not part of the 2021 Council Resolution, but nevertheless warrant analysis. The indicator on the employment rate of recent graduates from medium-level VET, measured as the share of employed graduates from VET at upper-secondary and post-secondary non-tertiary levels having left education and training no more than three years before the reference year, builds on a well-established indicator from the now superseded ET2020 strategic framework.
In 2020, the disruption of workplaces due to the pandemic led to a drop in employment rates for this group of three pps in all Member States, from 79.1% in 2019 to 76.1% in 2020, except for Latvia and Romania (Figure 65). Nine countries saw a drop of more than five pps, including three countries with over ten pps (Spain, Cyprus and Lithuania)204.
Figure 65: Employment rate of recent graduates (20-34) with medium-level vocational qualification 2019 and 2020 [%]
Finally, the VET learning mobility target also has its roots in the now superseded ET2020 strategic framework205. However, underlying data were always missing, and in its 2017 progress report on a learning mobility target206, the Commission proposed to shift the focus from household surveys to administrative data. As for the third target in the Council Resolution on VET, the methodological basis was a 2020 feasibility study207 that found 8% of VET learners in Europe should benefit from studying abroad by 2025.
One of the obstacles to learning abroad among VET learners is insufficient language skills. In some countries, students in vocational upper secondary education barely reach one additional foreign language (0.2 in Denmark, 0.4 in Germany and Spain). This discrepancy becomes even more alarming when we consider the percentages of learners in these types of upper secondary schools that are left behind linguistically. On average, in the EU, nearly one in five students in vocational upper secondary schools learns no modern foreign language, whatsoever. By contrast, the same is only true for some 2.1% of students enrolled in general upper secondary schools.
Figure 66: Average number of foreign languages studied per pupil in upper secondary education, by track (2019)
As Figure 66 shows, while this school level is supposed to prepare learners for the labour market, the linguistic necessities of an interconnected Europe are seemingly falling by the wayside. Therefore, when designing policy solutions to promote language learning and increased proficiency, particular attention should be paid to vocational upper secondary education. To be able to draw more concrete conclusions, more holistic strategies on testing language skills across the EU are needed.
The VET target for learning abroad will be measured as the share of all learners studying abroad in a calendar year, as a proportion of a cohort of VET graduates in the same year. The indicator will be based on the mobility data sourced from Erasmus+ data208 alongside VET graduate data sourced from the joint UNESCO, OECD and Eurostat (UOE) data collection209. Section 0 above sheds further light on learning abroad data and the disrupting effects of the pandemic.
2.6.3 Policy takeaways
Work-based learning helps young people and adults make smoother transitions from school or from unemployment to the labour market. It is a policy priority for the EU and an important part of the reinforced Youth Guarantee, where apprenticeships and traineeships make up two out of four possible offers to young people across the EU210.
Apprenticeships bring benefits both for the apprentices as well as their employers. Apprentices have the opportunity to gain valuable skills in a real working environment and further develop their talents and knowledge. Employers can benefit from fresh perspectives, as well have the opportunity to prepare specific profiles meeting the changing skills needs, enhancing the competitiveness and productivity of companies and workplaces, while also increasing employability and social participation. Most Member States have been pursuing significant apprenticeship reforms, and there is a strong push to boost apprenticeship supply. The EU has been supporting work-based learning, notably the provision of more and better apprenticeships, as well as the mobility of apprentices through the European Alliance for Apprenticeships and the Apprenticeship Support Services211, and through the European Apprentices Network212 and the Council Recommendation on a European Framework for Quality and Effective Apprenticeships213.
Apprenticeships also played a central role in the Commission’s 2020 Communication on Youth Employment Support214 which announced a renewed European Alliance for Apprenticeships. The vital role of apprenticeships was also highlighted in the tripartite Osnabrück Declaration (2020) on vocational education and training as an enabler of recovery and just transitions to digital and green economies. Through the renewed Alliance, a wider range of actors will be mobilised, which will help increase work-based learning offers in the medium term.
2.7 Adult learning
In a nutshell
The COVID-19 pandemic interrupted the already slow progress on adult learning across the EU. Increasing remote adult learning in 2020 may have prevented an even steeper decline in participation rates, but does not change the low average participation rates or the uneven picture across Member States. The pandemic did, however, add momentum to adult learning as a policy objective. Member States agreed on a target of at least 47% adult learning by 2025. A further target of 60% by 2030 was set at the 2021 Porto Summit when the action plan on the European Pillar of Social Rights was endorsed.
There have been adult learning targets in previous EU strategic frameworks for cooperation in education and training, but always focused on the narrow window of 4 weeks preceding the survey215. Both new targets are based on the participation in learning activities during 12 months preceding the survey that will first be applied in 2022.
The 12-month reference period makes it possible to cover all learning experiences, providing an overview of adult participation in learning closer to today’s reality. It has become increasingly common for adults to attend (very) short courses, seminars and other learning experiences, provided in-company, on the market or by authorities at several levels and a wide range of providers, from specialised centres to social partners and civil society organisations. Attendance of such courses may not be accounted for when applying the 4-week window, but the shift to a 12-month window allows for a comprehensive measurement and is likely to capture this type of learning.
As with the EU-level target for work-based learning, the preferred underlying data for the EU-level target on adult learning are not yet available. The EU Labour Force Survey (LFS) will collect adult learning data based on the 12-month window from 2022 onwards, with data available as of 2023216. Until then, the EU Adult Education Survey (AES), which uses the 12-month window, can be used – with some caveats217 – for provisional indications of country performance and trends.
AES results show a substantial increase in the EU adult learning figure from 2007 (32.8%) to 2011 (40.2%) and more modest progress in 2016 (43.7%). But they also show huge variations between Member States and some major changes over time. For instance, in 2016, nine countries were above 50% and two were below 20%. Among the countries without statistical breaks in the data series between 2007 and 2016, the greatest increases were observed in Portugal (from 26% to 46%), the Netherlands (from 45% to 64%) and Italy (from 22% to 42%), whereas participation rates decreased significantly in Bulgaria (from 36% to 25%) and Lithuania (from 34% to 28%).
Figure 67: Adults (aged 25-64) participation in learning, 12-month reference period, 2007, 2011, 2016.
Adjusting the definition of adult learning to that used in the LFS has only a minor effect on the uneven picture across Member States. For the EU average, the adjustment reduces 2016 adult-learning participation from 43.7% to 37.4%. Relatively low participation during the previous 12 months is also confirmed by findings from the OECD Survey of Adult Skills (PIAAC)218.
2.7.1 Spotlight on remote learning
Evidence shows that COVID-19 and the lockdown measures resulted in lower adult learning rates in 24 of 27 Member States. For EU27, participation during the previous 4 weeks dropped from 10.8% in 2019 to 9.2% in 2020. Many workers in the hardest hit sectors may have had to switch jobs and would benefit from upskilling and reskilling, but the widespread lockdowns have had a disruptive impact on the organisation of formal and non-formal learning.
As education and training largely moved online, it is worth exploring what this meant for adult learning. The limited evidence available does indeed point to a certain increase in online adult learning219.
The latest three rounds (2017, 2019 and 2020) of the Eurostat survey on ICT use in households and by individuals provide some insight into online adult learning, as respondents were asked about their participation in online courses (regardless of subject or purpose). For 22 Member States, the comparison between the 2020 data220 and the previous data highlights the effect of the pandemic (Figure 68). In most countries, the increase in 2020 compared with 2019 was much higher than the year-on-year changes of previous years221.
While this may have prevented a further drop in participation rates, it raises questions about the inclusiveness of adult learning since a sizeable share of adults – those with lower qualifications, lower paying jobs or unemployed – may have poor access to and acquaintance with digital technologies and services.
Figure 68: Percentage change in the proportion of adults engaged in online learning activities in selected EU countries
2.7.2 Policy takeaways
There is scope for further outreach and activation. Policy measures to increase participation need to confront the following status quo: almost all respondents (96%) to a recent Cedefop survey agreed that adult learning and continuing vocational training are important for personal development, and almost as many think such learning is beneficial for career progression and for reducing unemployment222. 32% of EU adults who wanted to participate in learning but did not mentioned cost as a reason and a further 40.7% mentioned scheduling conflicts, such as difficulties in receiving time off work. Yet, about 80% of respondents to the 2016 AES223 and the 2019 OECD PIAAC224 who did not avail themselves of in adult learning opportunities in the preceding 12 months declared they were not interested in doing so225. This points to the importance of integrating financial support to learners with measures that simultaneously tackle non-financial barriers to participation, including a lack of incentives or motivation by individuals to take up training opportunities. Financial support can for instance be provided in the form of training entitlements (including via individual learning accounts) and through paid training leave. To increase incentives, policy measures can increase adults’ awareness of own skills needs (e.g. through career guidance) increasing the transparency about available training offers and their quality and recognition on the labour market, and increasing the tailoring of training offers to the heterogeneous needs of adult learners226.
Upskilling and reskilling the EU’s adult population is key for fuelling the digital and green transitions and making sure everyone thrives in the new world of work. These developments, alongside the COVID-19 pandemic, have added momentum to adult learning as a policy objective and have led to new adult learning targets in recent years. The Council has first endorsed a target of 47% adults participating in learning every year by 2025227 and then a target of 60% by 2030. This was one of the three headline targets presented in the European Pillar of Social Rights Action Plan, adopted by the Commission in March 2021228, which were welcomed by EU Heads of State and Governments during the Porto Social Summit in May 2021229 and then by the European Council in its conclusions of 24-25 June 2021.
Box 25: The EU commitment to pursuing the United Nations 2030 Sustainable Development Agenda
The global community has been pursuing a sustainable development agenda in education established in the Incheon Declaration of May 2015230 as part of the broader UN 2030 agenda “Transforming our world: the 2030 agenda for sustainable development”231 that was agreed for all 17 policy areas later that year. The sustainable development goal in education, known as SDG-4, is to: ’Ensure inclusive and quality education for all and promote lifelong learning‘, and in the UN agenda it comprises seven ’targets‘ and three ’means of implementation’.
In their simplified form, these targets are:
- free primary and secondary education with effective learning outcomes for all
- quality early childhood education and care for all
- access to VET, technical and tertiary education
- increase in skills
- eliminate gender disparities in education,
- literacy and numeracy for adults,
- knowledge in sustainable development,
Means of implementation:
- upgrade education facilities,
- expand scholarships,
- increase supply of qualified teachers.
The language used by the UN has been different from that of EU policy making. The UN “targets” that required further definition correspond to EU “policy objectives”, while EU “targets” have: (i) a detailed indicator that defines them, and (ii) an agreed numerical value to be pursued by policy.
Over time, UNESCO, the UN agency charged with implementing the SDG-4, has been further developing the above 10 items (‘targets‘ and ’means of implementation‘) into global and regional indicators. The UN reports every year on progress towards SDG-4 through the Global Education Monitoring Report232. While UNESCO has been coordinating the monitoring of SDG-4 on the global level, countries are free to choose their own monitoring methods, which has resulted in many different indicator sets. The EU is using a monitoring system that is inspired by and closely related to the overarching cooperation framework of the European Education Area233.
Notes
108 Data stem from the OECD PISA, which targets 15 year-olds, takes place every three years and is the largest international competence test for school students. All EU Member States participated in PISA 2018, involving 7 854 schools and 207 851 students across the EU. The three PISA domains of reading, mathematics and science are all tested in each wave of the survey, with one domain being chosen as “core” each time. In PISA 2018, reading was the core domain. This section features a summary of the PISA 2018 data with regard to the EEA 2030 target. A new PISA study is scheduled only for 2022 with the data likely to become available at the end of 2023.
109 EU27 (without the UK).
110 For instance, in 1999, PL introduced an educational reform setting up lower secondary schools (gimnasia), which delayed channelling learners into different educational tracks until the age of 16. These changes were followed by a new competence-based core curriculum, new examination and assessment systems as well as increased school autonomy.
111 For instance, student performance has benefited from the “Strategy to Improve Literacy and Numeracy”, the “Delivering equality of opportunity in schools” programme and from extensive support for special educational needs.
112 In addition to data on pupil achievement, ICILS collects contextual data on pupils’ home and school environments.
113 Level 2 is one of four defined proficiency levels, and performance below this threshold can be defined as low achievement. The proficiency levels describe the nature and the complexity of the tasks pupils are able to solve. At level 1, pupils demonstrate a functional working knowledge of computers as tools and a basic understanding of the consequences of computers being accessed by multiple users. At level 2, pupils use computers to complete basic and explicit information gathering and management tasks. At level 3, pupils demonstrate the capacity to work independently when using computers as information gathering and management tools. At level 4, pupils select the most relevant information to use for communicative purposes. They evaluate usefulness of information based on criteria associated with need and evaluate the reliability of information based on its content and probable origin.
114 Further examples of tasks associated with each level of the computer and information literacy scale are presented in table 3.2 of the ICILS 2018 international report.
115 Low coverage of EU Member States in the two initial cycles limits our ability to generalise for the EU, and does not allow for the calculation of a meaningful weighted EU average at this point. Moreover, the field of digital education is undergoing a rapid development, accelerated by the COVID-19 pandemic. Results from 2013 and 2018 may thus no longer give a representative insight into the current skill level of grade eighth pupils in the participating countries. With these considerations in mind, the data should be interpreted with caution.
116 CZ, DK, DE, HR, LT, NL, PL, SI and SK.
117 DK, DE, FR, IT, LU, PT and FI. Italy participated in ICILS 2018, but the results are not comparable to those of other EU Member States due to the age of the pupils tested.
118 DK did not meet the sample participation rate in 2013.
119 An interesting observation from the ICILS results is that the difference between the shares of boys and girls performing at the higher end of the ICILS achievement scale is substantially lower than it is below the level 2 threshold (not shown in the figure). In nine countries (2018: DK, FR, DE, LU, PT; 2013: DE, HR, LT, SI), this difference between the share of boys and girls performing at level 4 was below 1 pp.
120 Socioeconomic background can be captured using a variety of proxies. In ICILS, responses from the student questionnaire on parental education, their occupational status and the number of books at home is sourced to derive three socioeconomic background variables.
121 Pupils in the from more affluent socioeconomic backgrounds performed statistically significantly higher than pupils from less advantaged backgrounds across the three proxies used to measure socioeconomic background in both ICILS 2013 and ICILS 2018.
122 Karpiński, Z., Biagi, F. and Di Pietro, G. (2021). Computational thinking, socioeconomic gaps, and policy implications. IEA Compass: Briefs in Education No. 12.
123 Ibid.
124 Computational thinking encompasses an individual’s ability to recognise aspects of real-world problem, which are appropriate for computational formulation and to evaluate and develop algorithmic solutions to those problems so that the solution could be operationalised by a computer.
125 Put forward in the European Pillar of Social Rights Action Plan.
126 The digital skills indicator based on the Community Survey on ICT usage in households and by individuals is proxy of the digital competences and skills of individuals. It is a composite indicator based on selected activities performed by individuals aged 16-74 on the internet in four specific areas (information, communication, problem solving and content creation). It is assumed that individuals having performed certain activities have the corresponding skills.
127 Data by income quartiles is available for 25 EU Member States.
128 Digital Education Action Plan 2021-2027.
129 2030 Digital Compass: the European way for the Digital Decade.
130 The European Pillar of Social Rights Action Plan COM (2021) 102. Adopted on 3 March 2021.
131 Digital Economy and Society Index (DESI) 2020.
132 The now superseded ET2020 benchmark aimed for at least 95% of children between age of four and the age for starting compulsory primary education to participate in ECEC. This was reached in 2019, with an EU average of 95.3%.
133 The source data come from the joint UOE data collection (online data code: [educ_uoe_enra21]). The EEA target should not be confused with the Barcelona target (online data code: [ilc_caindformal]), which focuses on formal childcare. The share of participation in early childhood education and care as used for the EEA target captures attendance of ECEC programmes that fall under the ISCED 0 category.
134 As can be expected at this young age, the sex distribution of children participating in ECEC is very balanced, with never more than a percentage point difference between boys and girls.
135 For Ireland, the ECE rate includes participation in ECEC centres, and also in primary schools, which are attended by many 4-5 year olds.
136 European Commission/EACEA/Eurydice (2020). Structural indicators; European Commission/EACEA/Eurydice (2019). Key indicators. Data on ECEC.
137 A Union of Equality: Gender Equality Strategy 2020-2025, EU strategy on the rights of the child.
138 In CY, the starting age of compulsory ECEC is 4 years and 8 months. Legal entitlement in PL and LU starts at the age of 3.
139 For EL there are breaks in the time series between 2014 and 2019.
140 For NL, the content of the data of 2018 and later is different than before due to a change in the childcare system in 2018, especially for children younger than 4 year of age.
141 In DE, a place is guaranteed from the age of 1 year.
142 Note that this age bracket was used for the now superseded ET2020 benchmark, with a target value of at least 95% by 2020.
143 In EL and NL, the organisation of pre-primary education is split between the age groups above and below 4. In LU, children are legally entitled from the age of 3 to pre-primary education, but the first year of éducation précoce is optional, while the following two years of éducation préscolaire are compulsory. In CY, ECEC is compulsory from the age of 4 years and 8 months.
145 European Commission/EACEA/Eurydice (2019). Key indicators. Cf. figure B7, which shows that in MT and NL the demand for ECEC was met for the earliest age of children.
146 Provisional data.
147 OECD (2020). Early Childhood Education: Equity, Quality and Transitions Report for the G20 Education Working Group;
OECD (2017). Starting Strong 2017: Key OECD Indicators on Early Childhood Education and Care, Starting Strong;
UNICEF (2019). A World Ready to Learn: Prioritizing Quality Early Childhood Education.
148 UNICEF (2019). A World Ready to Learn: Prioritizing Quality Early Childhood Education.
149 Cf. part 0 below (annex).
150 Under ET2020, an ECEC Working Group delivered a toolkit for inclusive ECEC as well as guidelines on how to recruit, train and motivate well-qualified ECEC staff. Its final report summarised the conclusions of the inclusion toolkit and the guidelines.
151 European Union (2019). Council Recommendation of 22 May 2019 on High-Quality Early Childhood Education and Care Systems.
152 European Commission/DG EAC (2014). Proposal for key principles of a Quality Framework for Early Childhood Education and Care. A report of the working group on ECEC.
153 The share of early leavers of education and training refers to the proportion of young people aged between 18 and 24 years-old with, at most, lower secondary educational attainment (ISCED level 0-2) and who were not enrolled in any (formal or non-formal) education or training activity in the 4 weeks preceding the EU labour force survey. This means that those with an ISCED 0-2 qualification who participate in short, non-formal trainings, are not considered early leavers. The indicator is based on the EU Labour Force Survey, Eurostat online data code: [edat_lfse_14].
154 The 2021 Council Resolution on a strategic framework for European cooperation in education and training towards the European Education Area and beyond (2021-2030) highlights that “efforts must continue to bring down the rate of early leaving from education and training and aiming for more young people to obtain an upper secondary education qualification”.
155 The 2021 Council Conclusions on equity and inclusion in education and training in order to promote educational success for all call for “promoting comprehensive educational success strategies at national and regional level (…), in order to foster the successful completion of upper secondary (or equivalent) education and training pathways and to reduce early leaving from education and training and low achievement”.
156 The upper secondary completion indicator measures the share of the young population aged between 20 and 24 years with, at least, an upper secondary qualification, thus successful completion of formal education (ISCED level 3-8). Participation in non-formal education or training is not taken into account in the calculation of the upper secondary qualification indicator. The indicator is based on the EU Labour Force Survey, Eurostat. Online data code: [edat_lfse_03].
157 Cf. The European Pillar of Social Rights and its Action Plan.
158 In recent years, it has also increased in LU, AT, CZ and LT, though here figures remain below 9%.
159 The aim of the complementary indicator is to measure the proportion of the young population that is likely to have the minimum necessary qualifications for their active participation in society.
160 Not all vulnerable groups are easily captured by cross-EU survey data. For instance, the EU academic literature on the relationship between early school leaving, (learning) disability and special education needs is scarce. Nonetheless, there is a consensus that students with such disadvantages are at much greater risk of dropping out of education than their peers. See: Early School Leaving and Learners with Disabilities and/or Special Educational Needs: A Review of the Research Evidence Focusing on Europe.
161 Hippe, R. and Jakubowski, M. (2018). Immigrant background and expected early school leaving in Europe: evidence from PISA, A JRC Technical Report. The report differentiates among first generation immigrants and second generation and, where possible, among EU and non-EU students.
162 The PISA index of epistemological beliefs reflects how students see science and scientific enquiry. Students who score higher in the PISA index argue that “scientific knowledge is tentative" (to the extent that students recognise that scientific theories are not absolute truths, but evolve over time) and adhere “to beliefs about the validity and limitations of empirical methods of enquiry as a source of knowing” (OECD, 2016c, pp. 99–100).
163 Focusing on the specific situation of newcomers, young people who arrive to a new country past the start of primary education face a higher risk of falling behind at school compared to their native-born peers and compared to those who arrive at a younger age. This is partly because they need to adapt immediately to a new language of schooling. They are more likely to need support to gain proficiency in the language of schooling, as well as information and orientation on the education system. Those who arrive at an age towards the end of the compulsory schooling age are at high risk of not completing upper secondary education in the limited time that is available to them, and even more so if their previous education was interrupted. For more information, Cf. OECD (2015) Immigrant Students at School: Easing the Journey towards Integration; and OECD (2021) Making Integration Work Young People with Migrant Parents.
164 Communication from the Commission to the European Parliament and the Council “Midterm review of the EU framework for national Roma integration strategies”, COM (2017) 458 final.
165 Rural areas report the highest proportion of early leavers in their young population in a majority of countries, namely BG, DK, EE, EL, HR HU, NL, RO, PL, LT, FI and CY. In CZ, ES, FR, PT SI and SE, towns and suburbs reported the highest proportion of early leavers. Cities reported the highest proportion of early leavers in their young population in BE, IT, MT and AT, and the second highest in DE, IE, CY, NL and SI.
166 See the Flash Youth Eurobarometer 478 of 2019 for further information. The sample refers to young people aged between 15 and 30 years. The urbanisation level is defined differently from Eurostat’s LFS breakdowns, with the categories being as follows: rural area or village, small or medium-sized town, large town.
167 Progress towards closing the gender gap has been faster in rural areas in the last 10 years, with reductions in the proportion of early leavers from education and training of 5.0 pps among young men versus 3.1 among young women. In cities, the reductions have been very similar among young women (3.2 pps) and young men (3.6). In towns and suburbs, the gender gap has widened with larger improvements among young women (a decrease of 2.9 percentage points) than young men (2.0).
168 The data by sex and degree of urbanisation is partly not available for EE, IE, HR, CY, LV, LT, LU, MT, RO, SI and SK. The share of early leavers among young men is larger in towns and suburbs (13.5%) than in rural areas (11.7%) and cities (10.5%). Similarly, the proportion of early leavers among young women living in rural areas (9.2%) is larger than in towns and suburbs (8.7%) and cities (6.8%).
169 Eurostat (2020) Early leavers from education and training across EU regions.
170 The gender gaps in the share of early leavers from education and training are also related to gender gaps in young peoples’ prospects, opportunities and aspirations on the labour market, and not only to education and training systems. Young men are more likely to be early leavers from education and training, and also more likely to be in employment, or wanting to work after leaving education and training prematurely. The relatively higher rates of early leaving among young men do not necessarily translate into worse employment outcomes. Young women are more likely to stay on in education and training. Among young women who are early leavers, it is more frequent to not want to work, or to want to work, but to be unemployed.
171 For more details, cf. reports by the DG JRC of the European Commission: Blaskó, Z. and Schnepf, S.V. (2020). Educational inequalities in Europe and physical school closures during COVID-19. Fairness Policy Brief 04/2020; Di Pietro, G., Biagi, F., Costa P., Karpiński Z., Mazza, J. (2020). The likely impact of COVID-19 on education: Reflections based on the existing literature and recent international datasets. A JRC Technical Report; Carretero Gomez, S., Napierala, J., Bessios, A., Mägi, E., Pugacewicz, A., Ranieri, M., Triquet, K., Lombaerts, K., Robledo Bottcher, N., Montanari, M. and Gonzalez Vazquez, I (2021). How families handled emergency remote schooling during the COVID-19 lockdown in spring 2020; what did we learn from schooling practices during the COVID 19 lockdown?. JRC Science for Policy Report. As a complementary indication, the European Statistical Recovery Dashboard shows that the proportion of young people neither in employment nor in education or training (NEET) increased from 12.5% in Q4 2019 to 14.7% in Q2 2020. During Q3-Q4 2020, the NEET rate decreased to 13.3%, a considerably higher level than one year earlier.
172 In some countries, 10% of 15-year-old students do not have a quiet place to study in their homes. In all countries, the percentage is higher among students from the most disadvantaged backgrounds, cf. Coronavirus policy-responses: learning remotely when schools close – how well are students and schools prepared?
173 There is abundant empirical evidence of the association of early school leaving with negative effects to individuals and society. Typically, a higher incidence and duration of unemployment, more precarious work conditions, and lower job satisfaction are found among early school leavers, while higher productivity an earnings are associated with higher educational attainment. See e.g.: Psacharopoulos, G. (2019). Developments in the Rates of Early Leavers from Education and Training (ELET), An EENEE Ad hoc report 3/2019, and Cedefop (2016). Leaving education early: putting vocational education and training centre stage. Volume I: investigating causes and extent. A Cedefop research paper; No 57.
174 Van der Graaf, A., Vroonhof, P., Roullis, G., and Velli, F. (2019). Research for CULT Committee – How to tackle early school leaving in the EU, European Parliament, Policy Department for Structural and Cohesion Policies, Brussels. Forthcoming study from Ecorys looked at the gender gap in attainment and achievements and the potential impact, including “direct” and more “indirect implications” where a causal link with poor education outcomes is difficult to prove conclusively on the basis of existing research, but some evidence was found showing that men with incomplete studies are at higher risk of ill-health and suicide.
175 Christopher Jepsen (2021). The labour market returns to classroom-based vocational education. An EENEE network report for the European Commission.
176 Cf. European Commission’s Reinforced Youth Guarantee.
177 European Commission (2017). Strengthening European identity through education and culture, p. 11.
178 Council of the European Union (2019). Council Recommendation of 22 May 2019 on a comprehensive approach to the teaching and learning of languages (2019/C 189/03)
179 Since 2011, the Commission and Member States developed a policy framework to reduce early school leaving, with the adoption and implementation of a Council Recommendation on Policies to Reduce Early School Leaving. The policy framework is based on a combination of prevention measures to reduce the overall risk for young people to leave education and training before they have completed upper secondary education, intervention measures at the level of the educational institutions, and compensation measures to support young early leavers and offer them routes to re-enter education and training and gain qualifications.
180 Cf. European Commission Communication on achieving a European Education Area by 2025.
181 The share of 25-34 year olds with tertiary educational attainment refers to the share of this age bracket who have successfully completed tertiary education (ISCED levels 5-8).
182 The reference population for the ET2020 benchmark was the age cohort 30-34 years. In comparison, the tertiary educational attainment rate for the 25-34 years cohort stood at 39.5% in 2019.
183 The increase in AT is in part due to the reclassification of programmes spanning levels in the transition from ISCED 1997 to ISCED 2011 in 2014.
184 The largest reductions are present in IE (-4.9 pp), BG (-4.3) and FR (-2.0) where there has been a reduction of more than 2 percentage points between 2010 and 2020. Only a minor reduction took place in Finland (-0.4 percentage points) and Latvia (-0.2).
185 In BE, EE and ES there is a negligible difference between “towns and suburbs” and ”rural areas”. Data on rural areas in Malta have low reliability due to the sample size, and is thus not referenced in the text.
186 Data for 2020 on the tertiary education attainment rate for people born in another EU country is not available for all countries due to confidential data (BG, LT and RO) or low reliability (LV and SK). Low reliability of the data limits the analysis for a selection of countries (EE, EL, HR, PL and SI). Similarly, data is not available for some countries on people born outside the EU due to low reliability (BG, RO and SK) or limits the analysis (LT).
187 The explanation for this is twofold: firstly, data is published 1.5 years after the end of the reference period, meaning that data for the academic year 2019/20 is not available before 2022. Second, the nature of graduate mobility, in contrast to student mobility, results in data only being generated when a degree is completed. In other words, longer term effects will take time to manifest themselves in the graduate data.
188 Statistics on learning mobility have been calculated according to the procedure outlined in the methodological manual on learning mobility in tertiary education. We can distinguish between two types of mobile graduates. Credit-mobile graduates are those who have had a temporary study period and/or work placement abroad and return to their ‘home institution’ to complete their degree. Degree-mobile graduates are those whose country of origin (i.e. the country where their upper secondary qualification was obtained) is different from the country in which they graduate. While data on credit mobility is collected in the countries to which students returned after their credit mobility stay, data on degree-mobile graduates is collected at the level of the destination country. Consequently, the calculation of outwardly mobile EU graduates relies on figures provided by all EU and non-EU destination countries. For an estimation of the effect of missing data on the calculations, see Flisi, S. and Sanchez-Barrioluengo, M. (2018). Learning Mobility II: An estimation of the benchmark. A JRC Science for Policy Report.
189 Data on credit mobility is not available for IE, so total mobility cannot be reported.
190 Credit mobile graduates refers to graduates with a credit mobility stay abroad who were not degree mobile. For countries where this disaggregation is not available, credit mobile graduates are used in the calculations.
191 Cf., Summers, J.J., Waigandt, A. and Whittaker, T.A. (2005). A comparison of student achievement and satisfaction in an online versus a traditional face-to-face statistics class, Innovative Higher Education 29: 233-250. Additionally, a recent survey among undergraduates in the UK during the lockdown finds that an increasing proportion of students dissatisfied with online compared to in-person learning.
192 West, A, Dimitropoulos, A., Hind, A. and Wilkes, J. (2000). Reasons for Studying Abroad: A Survey of EU Students Studying in the UK, Education-line, Edinburgh.
193 Not excluding credit mobile graduates who were also degree mobile.
194 ISCED levels 5-8.
195 Calculations based on Eurostat, UOE data. Online data code: [educ_uoe_mobg02].
196 Commission Communication on achieving the European Education Area by 2025 COM/2020/625 final; Commission Communication on a new ERA for research and innovation COM/2020/628 final; Council Resolution on a strategic framework for European cooperation in education and training towards the European Education Area and beyond (2021-2030) 2021/C 66/01; Council conclusions on the New European Research Area.
197 Council conclusions on the European Universities initiative – Bridging higher education, research, innovation and society: Paving the way for a new dimension in European higher education. 2021/C 221/03
198 European Commission/EACEA/Eurydice (2020). The European Higher Education Area in 2020: Bologna Process Implementation Report.
199 Cedefop (2021). Digital, greener and more resilient. Insights from Cedefop’s European skills forecast.
200 Council Recommendation of 24 November 2020 on vocational education and training (VET) for sustainable competitiveness, social fairness and resilience 2020/C 417/01.
201 The Recommendation outlines reforms needed in VET systems so they can cater for the skills needs of both young and adult population, facilitate swift responses to changing labour market needs and equip people with the skills for the recovery, the green and digital transitions and active participation in society. It also places a strong focus on the need to integrate VET into economic, industrial and innovation strategies and embed social and environmental sustainability into VET programmes. A monitoring framework was also included to support the assessment of progress towards European level targets.
202 In a market or non-market unit (i.e. in a company, government institution or non-profit organisation).
203 As for duration, it will identify work experience(s) at a workplace from 1 to 6 months, 7 months or over and less than 1 month (or no experience). If a respondent had several work experiences, the cumulative duration of all work experiences will be considered. As far as the payment component is concerned, the new variable will distinguish between the above work experiences where at least one work experience was paid and those where all work experiences were unpaid.
204 Interestingly, VET graduates were more successful in entering the labour market when compared to general education graduates. They were also more resilient during the COVID-19 pandemic than their peers from medium level programmes with general orientation, whose employment level dropped more steeply from an already low level of 62.8% in 2019 to 58.3% in 2020.
205 In ET2020 is was stated that “by 2020, an EU average of at least 6% of 18-34-year-olds with an initial vocational education and training (IVET) qualification should have had an initial VET-related study or training period (including work placements) abroad lasting a minimum of 2 weeks (10 working days), or less if documented by Europass.”
206 European Commission (2017). Progress report on a Learning Mobility Benchmark. A Report from the Commission to the Council. COM/2017/ 148 final.
207 Hefler G., Steinheimer, E. (2020). Measuring Learning Mobility in Vocational Education and Training – A review of data sources and approaches to measurement across European Union Member States. A report for DG Employment, Social Affairs and Inclusion.
208 Since 1987, Erasmus has supported more than 1.3 million VET learners. Around 170 000 VET learners and staff go abroad every year. The new Erasmus+ 2021-2027 provides a strengthened support to mobility of learners and teachers, trainers and staff, and provides for several novelties in the area of VET mobility: (1) a new accreditation process to provide an easy access to mobility activities; (2) a financial incentive to VET providers willing to implement long-term mobility (i.e. 3-12 months duration) as well as an additional specific linguistic support for learners; (3) the extension of the Digital Opportunity Traineeship initiative (DOT) to traineeships for learners and apprentices from the VET sector; (4) the support to the participation of VET learners in skills competitions abroad; and (5) the support to international mobility activities outside Erasmus+ Programme countries for VET staff and learners.
209 Where available and only if the data provided is comparable to Erasmus+ data, including the duration of mobility, data from national authorities mobility programmes could also be used to complement the data from Erasmus+. In case data from national authorities are included, this should be displayed in a transparent manner. Due to the fact that close to one third of the mobility activities was disrupted as a result of the COVID-19 pandemic, data cannot be published for the school year 2019-2020.
210 Cf. European Commission’s Reinforced Youth Guarantee.
211 The European Alliance for Apprenticeships (EAfA) aims to strengthen the supply, quality, image and mobility of apprenticeships. Since its launch in 2013, 36 countries have made national commitments under the alliance, and more than 350 companies, employers and intermediaries have pledged to provide over one million apprenticeship and other training opportunities to young people. EAfA members can benefit from the Apprenticeship Support Services. The Services contribute to strengthening the European apprenticeship community and support EU Member States in improving their apprenticeship schemes by providing support through three pillars: Knowledge-sharing, Networking and Benchlearning. In order to give a renewed boost to apprenticeships across the EU, the Commission’s Youth Employment Support package of 1 July 2020 announced a renewed EAfA. The renewed EAfA will in particular (i) promote national coalitions, (ii) support SMEs, (iii) reinforce the involvement of social partners including at sectoral level, (iv) mobilise local and regional authorities and (v) support the representation of apprentices in the Member States.
212 The European Apprentices Network (EAN) established in 2017 is a network of apprentices, youth organisations and other bodies related to apprenticeships at the European level. Its objective is to ensure that young apprentices both in secondary and third-level education are shaping the discussion and policymaking related to VET, in particular for apprenticeships. EAN calls for apprenticeships to be considered more than a quick fix to youth unemployment, but rather learning opportunities to be tailored to the needs and rights of apprentices themselves. In 2020 EAN sat up a new structure expanding its membership as to be a representative voice at all levels on issues concerning apprenticeships.
213 On 15 March 2018, EU Member States agreed on a Council Recommendation on a European Framework for Quality and Effective Apprenticeships (EFQEA) with the aim to ensure that apprenticeships respond to the needs of both apprentices and employers throughout the European Union. It recommends that a substantial part of an apprenticeship, meaning at least half of it, should be carried out in the workplace. As the Commission monitoring report of August 2021 (tbc) shows, the seven criteria for learning and working conditions are in place in the majority of Member States. However, as for the seven criteria on framework conditions, further progress in implementation is needed.
214 European Commission’s youth employment strategy.
215 The EU average in 2019, at 10.8%, remained far below the now superseded 2020 target of 15%. Only seven countries had reached the 15% target in 2019 (SE, FI, DK, NL, EE, LU and FR), with AT coming very close at 14.7%. The overall picture is one of big differences between the 27 national situations, in participation rates in any given year and in trends.
216 This also means that the LFS methodology, or the EEA target itself, is still up for discussion on the basis of first results in 2023.
217 The AES uses a wider definition of adult learning (including guided on-the-job training) than the LFS. Moreover, trend analysis is complicated by numerous statistical breaks in the data series.
218 These results suggest that on average 2 in 5 adults participate in adult learning, with huge disparities between the countries surveyed, from below 25% in EL and IT to above 55% in DK, FI and SE. See OECD (2019), Survey of Adult Skills (PIAAC).
219 Public employment services have made specific online training programmes available to jobseekers, for instance the French platform Emploi Store. In the Flemish Region of Belgium, the number of participants in online training provided by the public employment service (VDAB) after the start of lockdown measures in 2020 was four times as high as in the same period in the previous year. Many countries have focused on helping teaching staff develop online teaching skills, but not all learning translated easily to an online environment. Work-based learning often had to be postponed, although innovative solutions such as virtual internships emerged.
220 The participation rate in 2020 varies across countries as much as participation in adult learning in general, ranging from 28% in FI to 2% in RO.
221 The survey on ICT usage suggests faster uptake growth for women, older working–age adults (55 to 65) and low–qualified adults.
222 Cedefop (2020). Perceptions on adult learning and continuing vocational education and training in Europe, p. 13, Section 3.1.
223 Eurostat, Adult Education Survey, Eurostat online data code: [TRNG_AES_195].
224 OECD (2021). Skills Outlook 2021: Learning for life, in particular pp. 134-135.
225 Educational attainment plays a major role in shaping adult-learning choices: the 2016 AES found that 1 in 5 low-qualified people and 2 in 3 people with a tertiary qualification had participated in learning. Three times as many people in the highly qualified group looked for information on learning opportunities than people in the low-qualified group. Low-qualified adults are also less likely to be aware of and find information on skills development opportunities and may have a negative attitude towards organised learning owing to negative experiences of initial schooling. The OECD PIAAC suggests that adults more familiar with digital technologies are more likely to remain interested in learning throughout their career. The cost of learning is another important factor limiting participation – it was the reason specified by one third (32.2%) of the 2016 AES respondents that did not participate in learning. About as many (31.6%) mentioned family commitments and other personal reasons. For employees, the type and size of employers is a crucial factor, as around 90% of job-related training in the EU is promoted and paid for by employers. Data from EU surveys on continuing vocational training show that the provision of continuing vocational training to workers increases with the size of the organisation: over 90% of large companies (with over 250 employees) provide training opportunities for their employees, compared with 76% of medium-sized firms (with between 51 and 250 employees) and only 57% of small firms (with 11 to 50 employees). More and more workers have atypical employment where this traditional cost-sharing arrangement does not apply.
226 Cedefop (2020). Perceptions on adult learning and continuing vocational education and training in Europe, Section 4.3.
227 The 2020 European Skills Agenda proposed several objectives to be achieved by 2025, including that 50% of adults participate in learning every year. This target was calculated using the 2016 AES, removing the share of guided-on-the-job-training, which is included in the definition of adult learning adopted by the AES but not in the LFS. Subsequent methodological considerations meant that the target was revised to 47% by the time the Council adopted the Resolution on a strategic framework for European cooperation in education and training towards the European Education Area and beyond (2021-2030) in 2021.
228 COM(2021) 102 final.
229 Portuguese presidency of the EU (2021). The Porto Social Commitment.
230 World Education Forum (2015). Education 2030: Incheon declaration and framework for action towards inclusive and equitable quality education and lifelong learning for all.
231 United Nations General Assembly (2015). Transforming our world: the 2030 Agenda for Sustainable Development. Resolution A/70/L.1 of 25 September 2015.
232 See the complete series of Global Education Monitoring Reports.
233 For details about EU SDG-4 reporting, consult Eurostat’s SDG Monitoring Reports.