
Annex: Structural drivers of labour shortages
Table A.1
Complete list of persistent labour shortages in various types
of occupations
Go to Table A.1
Table A.2
Future labour shortages are strongest in high-skilled
non-manual and elementary occupations
Go to Table A.2
Table A.3
Shortage occupations characterised by lower skill
demand
Go to Table A.3
Table A.4
Moderate future labour shortages in energy-intensive
industries
Go to Table A.4
Table A.5
Future labour shortages are strongest in business
services
Go to Table A.5
Chart A.1
Work in information and communication activities is the most
digitally intensive
Digital intensity of work by sector of economic activity (percentage), 2021, EU
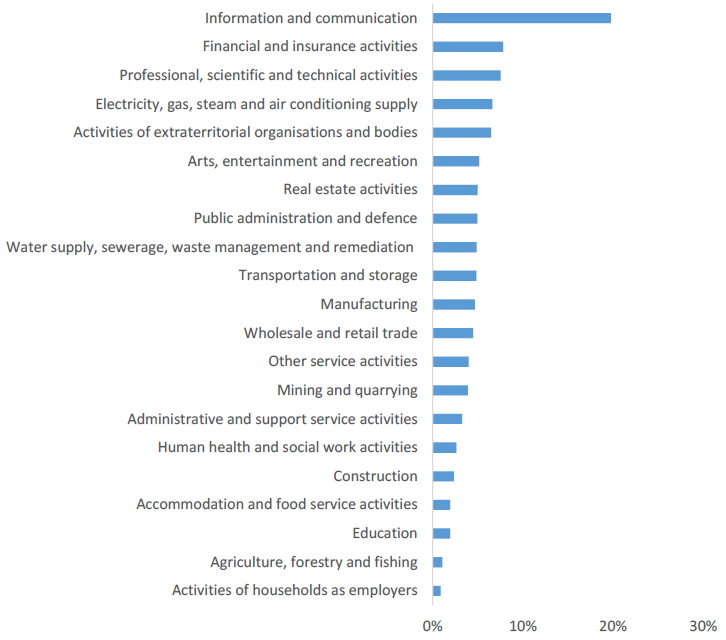
Note: Analysis based on all Member States where occupational statistics are available at ISCO-08 3-digit level, i.e. excluding Bulgaria, Malta and Slovenia
Source: EU-LFS 2021.
Chart A.2
Holding ICT qualifications sharply increases the probability
of working in ICT for men, but less so for women
Gender gaps in ICT occupations, by contributing factors (pp), workers aged 20-64, 2021, EU
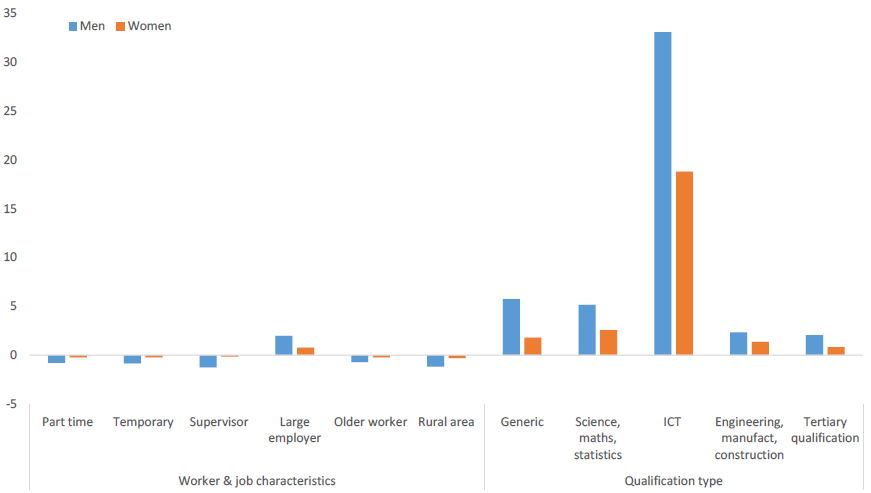
Note: Analysis based on all Member States where occupational statistics are available at ISCO-08 2-digit level, i.e. excluding Malta.
Source: EU-LFS 2021.
Chart A.3
Marginal effects of individual characteristics on
participation probability, by country
The effects of individual characteristics on participation probability among people aged 20-64, 2004-2020, EU-27 countries.


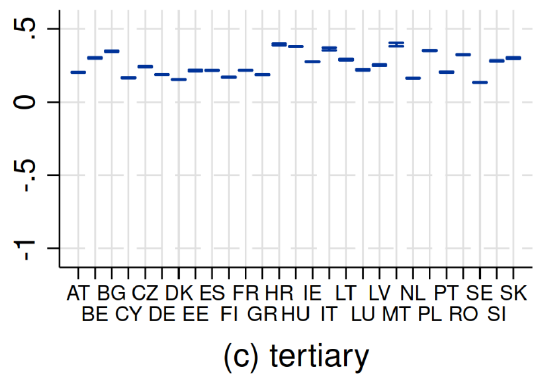
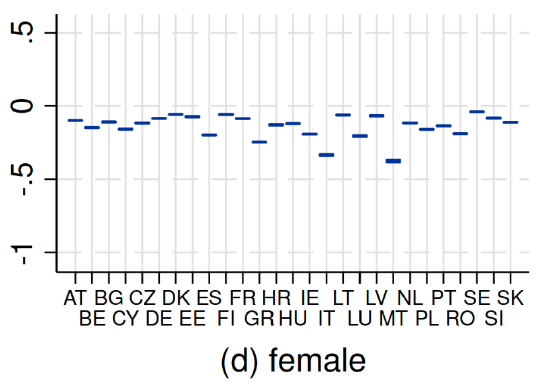
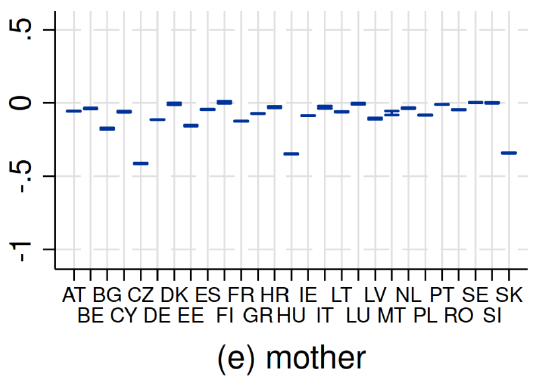
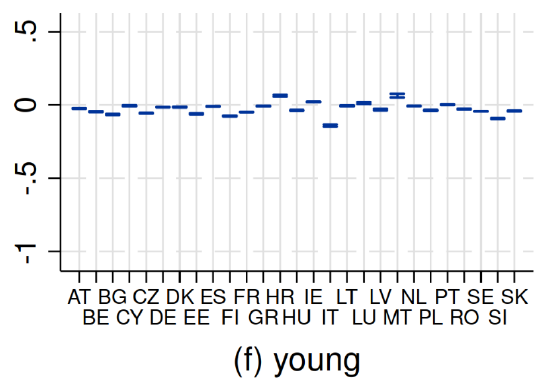

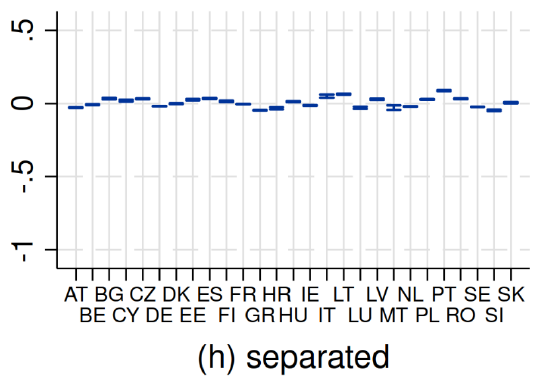

Note: Marginal effects (and 95% confidence intervals) calculated on sample mean based on estimated logit model for each Member State. I; model also includesd year dummies.
Source: DG EMPL calculations, based on EU-LFS 2004-2020.
Figure A.1
Migrants are more likely to be employed in occupations with
persistent labour shortages
Factors connected to the probability of being employed in labour shortage occupations vs non-labour shortage occupations, 2021, EU

Note: Regression on full sample (migrants, natives, EU-mobile workers, identified based on country of birth. Analysis limited to population aged 20-64. Excludes Bulgaria, Hungary, Malta, Poland and Slovenia, whose EU-LFS data do not provide country of birth for people born outside Europe. The deviation from zero shows the difference with respect to the reference group in parenthesis: migrant and EU mobile workers (people born in the country of residence), towns and suburbs, and rural areas (cities), primary and tertiary education (secondary education), foreign education which indicates highest level of education achieved abroad and no formal education (highest level of education achieved in country of residence), female (male), residing for less than nine years or residing for 10 years or more (born in the country of residence), proficient language skills comprising advanced and intermediate language skills or poor language skills comprising basic, hardly any, and no language skills (mother tongue), aged 35-49 and aged 50-64 (aged 20-34), temporary job (permanent job), part-time job (full-time job), firms with less than 10 employees and firms with 50 or more employees (firms with 10 to 49 employees). *** significant at 1%, ** significant at 5%, * significant at 10%, no * = not significant.
Source: EU-LFS 2021.
Figure A.2
Migrants are more likely to be employed in occupations with
persistent labour shortages, even when controlling for lower-skilled occupations
Factors connected to the probability of employment in labour shortage occupations vs non-labour shortage occupations, 2021, EU

Note: Regression on full sample (migrants, natives, EU mobile workers, identified based on country of birth). Analysis limited to population aged 20-64. Excludes Bulgaria, Hungary, Malta, Poland and Slovenia, whose EU-LFS data do not provide country of birth for people born outside Europe. The deviation from zero shows the difference with respect to the reference group in parenthesis: migrant and EU mobile workers (people born in the country of residence), towns and suburbs, and rural areas (cities), primary and tertiary education (secondary education), foreign education which indicates highest level of education achieved abroad and no formal education (highest level of education achieved in country of residence), low-skilled occupations with skill levels ‘1, 2 and 4’ and ‘2’ (high-skilled occupations with skill levels ‘3’, ‘3 and 4’ and ‘4’), female (male), residing for less than nine years or residing for 10 years or more (born in the country of residence), proficient language skills comprising advanced and intermediate language skills or poor language skills comprising basic, hardly any, and no language skills (mother tongue), aged 35-49 and aged 50-64 (aged 20-34), temporary job (permanent job), part-time job (full-time job), firms with less than 10 employees and firms with 50 or more employees (firms with 10 to 49 employees). *** - significant at 1%, ** significant at 5%, * significant at 10%, no * = not significant.
Source: EU-LFS 2021.
Figure A.3
Migrants are less likely to be employed
Factors connected to the probability of being employed vs being not employed, 2021, EU

Note: Regression on full sample (migrants, natives, EU mobile workers, identified based on country of birth). Analysis limited to population aged 20-64. Excludes Bulgaria, Hungary, Malta, Poland and Slovenia, whose EU-LFS data do not provide country of birth for people born outside Europe. The deviation from zero shows the difference with respect to the reference group in parenthesis: migrant and EU mobile workers (people born in the country of residence), towns and suburbs, and rural areas (cities), primary and tertiary education (secondary education), foreign education which indicates highest level of education achieved abroad and no formal education (highest level of education achieved in country of residence), female (male), residing for less than nine years or residing for 10 years or more (born in the country of residence), proficient language skills comprising advanced and intermediate language skills or poor language skills comprising basic, hardly any, and no language skills (mother tongue), aged 35-49 and aged 50-64 (aged 20-34). *** significant at 1%, ** significant at 5%, * significant at 10%, no * = not significant.
Source: EU-LFS 2021.
Figure A.4
Migrating for employment reasons increases the probability of
being employed
Factors connected to the probability of being employed vs being not employed for migrants, 2021, EU

Note: Regression on full sample (migrants, natives, EU mobile workers, identified based on country of birth). Analysis limited to population aged 20-64. Excludes, Hungary, Malta, Poland and Slovenia, whose EU-LFS data do not provide country of birth for people born outside Europe. The deviation from zero shows the difference with respect to the reference group in parenthesis: towns and suburbs, and rural areas (cities), primary and tertiary education (secondary education), foreign education which indicates highest level of education achieved abroad and no formal education (highest level of education achieved in country of residence), female (male), residing for less than nine years or residing for 10 years or more (born in the country of residence), proficient language skills comprising advanced and intermediate language skills or poor language skills comprising basic, hardly any, and no language skills (mother tongue), aged 35-49 and aged 50-64 (aged 20-34), employment as the main reason for migration (other reasons such as family reasons, education or training, retirement or international protection, as the main reason for migration). *** significant at 1%, ** significant at 5%, * significant at 10%, no * = not significant.
Source: EU-LFS 2021.
Figure A.5
Migrants are more likely to work in non-standard forms of
employment
Factors connected to the probability of non-standard forms of employment vs full-time permanent employment, 2021, EU

Note: Regression on the full sample (migrants, natives, EU mobile workers, identified based on country of birth). Analysis limited to population aged 20-64. Excludes Bulgaria, Hungary, Malta, Poland and Slovenia, whose EU-LFS data do not provide country of birth for people born outside Europe. The deviation from zero shows the difference with respect to the reference group in parenthesis: migrant and EU mobile workers (people born in the country of residence), labour shortage occupations (non-labour shortage occupations), low-skilled occupations with skill levels ‘1, 2 and 4’ and ‘2’ (high-skilled occupations with skill levels ‘3’, ‘3 and 4’ and ‘4’), towns and suburbs, and rural areas (cities), primary and tertiary education (secondary education), foreign education which indicates highest level of education achieved abroad and no formal education (highest level of education achieved in country of residence), female (male), residing for less than nine years or residing for 10 years or more (born in the country of residence), proficient language skills comprising advanced and intermediate language skills or poor language skills comprising basic, hardly any, and no language skills (mother tongue), aged 35-49 and aged 50-64 (aged 20-34), firms with less than 10 employees and firms with 50 or more employees (firms with 10 to 49 employees). *** significant at 1%, ** significant at 5%, * significant at 10%, no * = not significant.
Source: EU-LFS 2021.
Chart A.4
Sectors with persistent labour shortages had both above and
below EU average median hourly earnings
Median hourly gross earnings (PPS), by sector of economic activity, 2010-2018, NACE 1-digit level, EU-27

Note: Size classes in number of employees is for 10 employees or more. Includes a selection of economic sectors, together with shortage sectors.
Source: SES [EARN_SES_PUB2N]
Chart A.5
Share of low-wage earners was above the EU average in two
shortage sectors
Low-wage earners as a proportion of all employees (excluding apprentices), by economic activity, 2010-2018, NACE 1-digit level, EU-27
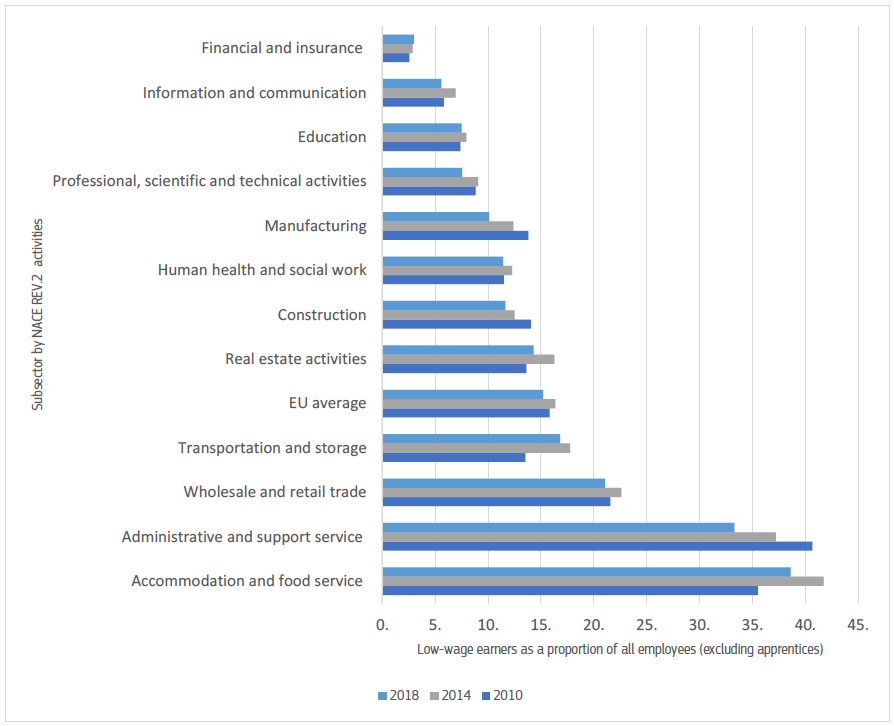
Note: Size classes in number of employees is for 10 employees or more. Includes a selection of economic activity sectors, together with shortage sectors.
Source: SES [EARN_SES_PUB1N]
Chart A.6
High shares of temporary employment in some shortage
sectors
Temporary employees as a share of total employment, by sector, 2021, NACE 1-digit level, EU-27

Note: Includes a selection of economic activity sectors, together with shortage sectors..
Source: EU-LFS 2021.
Chart A.7
Solo self-employment is more common in some shortage
sectors.
Own-account workers as a share of total employment and job vacancy rate (%), by sector, 2021, NACE 1-digit level, EU-27.
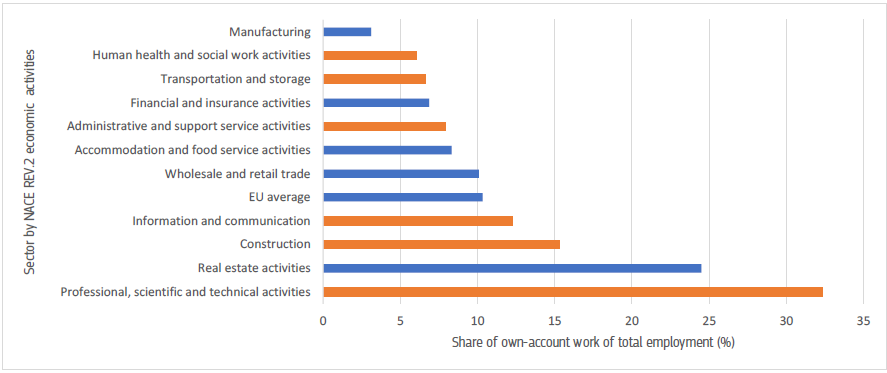
Source: EU- LFS 2021.