
3. Assessment of policies to address skill shortages and improve matching
3.2. Geographical inequalities in accessibility of PES (332)
PES play a crucial role in connecting jobseekers with employers. They help to match supply and demand in the labour market by providing information, job search assistance, and placement. They also maintain connections with local employers to provide information and help with hiring processes. While PES offer an increasing share of their services online, (333) the physical availability of PES support within easy reach remains essential for many workers. This applies particularly to jobseekers with low digital skills and other forms of disadvantage, including older jobseekers, those with health problems, or possibly a low level of education. Some aspects of PES services may also prove difficult to provide online. Accordingly, the geographical location of PES centres has a role in the quality of job search support and can influence local labour supply.
In most regions, (334) PES centres are within easy driving distance for a large share of the population (Chart 3.8). (335) In the countries covered, close to 70% of the population lives in regions with high accessibility of PES centres within a 30-minute drive. (336) However, a number of countries show some variation in the accessibility of PES centres, with accessibility lower in remote regions (e.g. Fuerteventura, one of Spain’s Canary Islands, or Sassari in Sardinia, Italy) or in regions with low population density (e.g. Avila, a Province northwest of Madrid in Spain, or Lozère, a département in the south of France). For those who cannot easily access PES by car, public transport may offer an important alternative. (337) Only a small share of people live in regions in which a majority of people are within a 15-minute walk of a PES centre.
Chart 3.8
PES centres are within a short drive in most regions
Share of population with access to a PES centre within a 30-minute drive, by TL3 region, 2022 or latest year available

Note: Preliminary results for EU countries with available data. Excludes island regions Åland (Finland), Gotland (Sweden), Mayotte (France), Eivissa y Formentera and the special autonomous regions Ceuta and Melilla (Spain). Driving time estimates do not consider traffic congestion and thus constitute the lower bound of people’s actual driving times.
Source: OECD calculations, based on PES location data obtained from various sources.
There are strong urban-rural differences in the geographical accessibility of PES offices (Chart 3.9). Across metropolitan regions, a very large majority (96%) of the population live in regions with high accessibility of PES centres within a 30-minute drive (top-left panel). In non-metropolitan regions, the share of people within driving distance of a PES centre is generally lower. These differences may reflect a combination of lower number of centres per capita, lower population density, and less developed transport infrastructure. More specifically, only 69% of people in non-metropolitan regions with access to a small FUA (bottom-left panel) and 46% of people in non-metropolitan remote regions (bottom-right panel) live in regions with high accessibility.
Chart 3.9
Accessibility of PES centres is high in metropolitan regions but can vary substantially between non-metropolitan regions
Share of population with access to a PES centre within a 30-minute drive, by TL3 region and level of access to cities, 2022 or latest year available

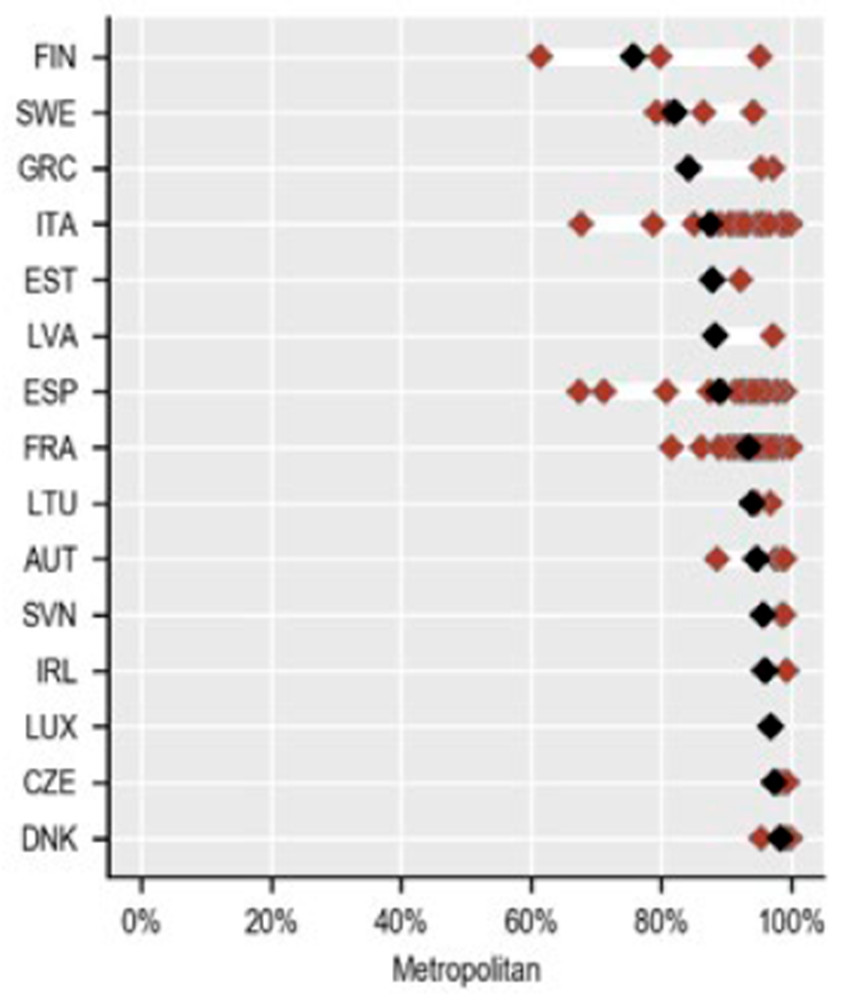
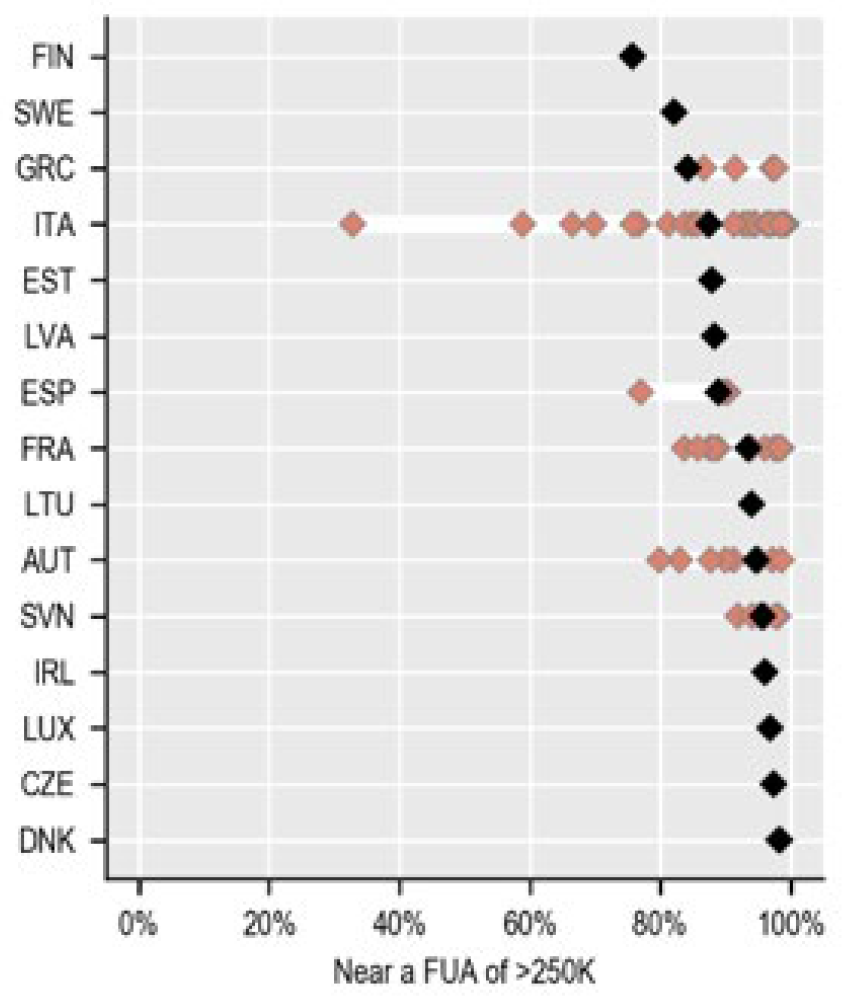

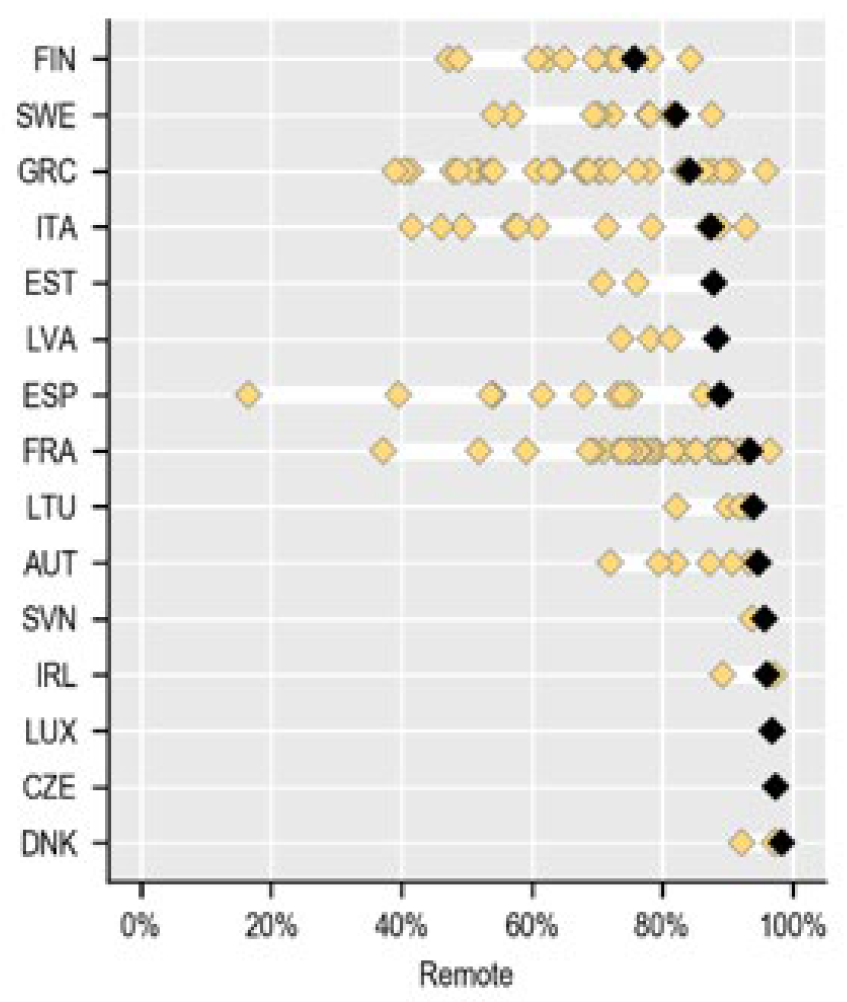
Note: Preliminary results for EU countries with available data. Countries sorted by national average in ascending order. Excludes island regions Åland (Finland), Gotland (Sweden), Mayotte (France), and Eivissa y Formentera and special autonomous regions Ceuta and Melilla (Spain). Driving time estimates do not consider traffic congestion and thus constitute the lower bound of people’s actual driving times.
Source: OECD calculations, based on PES location data obtained from several sources.
The accessibility of PES centres varies between non-metropolitan regions within countries. Variation is highest in large countries like France, Italy and Spain. In the Spanish province of Fuerteventura, for example, only 17% of people live within a 30-minute drive of a PES centre, compared to 86% in La Palma. In France, only 37% of people in Lozère are within a 30-minute drive of a PES centre, compared to 97% of the population in the Deux-Sèvres département in the west of the country. Variation in access between nonmetropolitan regions is also high in countries with low population density, such as Sweden and Finland.
Low accessibility of PES services within close distance can potentially reduce the efficiency of matching labour supply and demand at regional level. This warrants further analysis, however. A simple correlation analysis finds no clear relationship between accessibility of PES centres and regional unemployment, highlighting the role of other drivers. (338) The relationship between access to PES and unemployment rates is not straightforward. In practice, PES locations in most countries reflect institutional factors and constraints, alongside local labour market characteristics. Other contexts to consider include the diversity of PES models, their respective services, (339) users’ profiles, and the degree of digitalisation of PES services. Cooperation with local partners in the delivery of services is another essential factor, particularly in supporting vulnerable clients. Many PES compensate for the lack of a strong territorial network through partnerships with locally anchored organisations, providing outreach to inactive people, activation services, or upskilling and reskilling opportunities.
Notes
- 332. This section presents preliminary findings from the OECD analysis of geographical accessibility of essential services across EU regions.
- 333. Digitalisation of PES support increased during the COVID-19 crisis in many OECD countries (OECD, 2022b). Digital advancements are most evident in labour market services (job search support and counselling) and training, with initiatives towards greater digital or remote delivery in over 70% of OECD countries (OECD, 2022d) (OECD, 2020b).
- 334. PES location data cover regions in the following countries: Austria, Czechia, Denmark, Estonia, Finland, France, Greece, Ireland, Italy, Latvia, Lithuania, Luxembourg, Slovenia, Spain and Sweden.
- 335. See section 2.2.2. for underlying methodology and data.
- 336. For PES, a 30-minute drive seems an appropriate benchmark. In most OECD countries, jobseekers – or other users – will need to physically visit PES offices relatively rarely.
- 337. Note however that there are no reliable data on public transport infrastructure and services at granular geographical level.
- 338. These include features of the regional economy and labour market, other geographical factors, and possibly the scope and quality of PES services provided.
- 339. An overview of PES responsibilities is included in the European Network of Public Employment Services’ 2022 PES capacity report, available here.