
4. Impact of population ageing and labour force participation on labour shortages
4.2 Untapped labour potential to fill existing shortages
Insufficient labour market participation is one of the factors underlying labour shortages. The activity rate in the EU in 2021 was 78.5%, higher than in 2012. It showed considerable cross-country heterogeneity, being lowest in Italy (69.2%) and highest in Sweden (87.5%) (Chart 2.12). In 2021, on average, labour market participation in the EU was slightly lower than in other developed OECD member countries. (206).
Chart 2.12
Activity rates and employment rates in selected countries
Activity rates and employment rates, people aged 20-64, 2021, EU-27 and selected OECD member countries


Note: European Pillar of Social Rights action plan sets a target of at least 78% employment rate at EU level by 2030; KR=South Korea; IL=Israel; AU=Australia; CA=Canada; NO=Norway; NZ=New Zealand; JP=Japan; CH=Switzerland; IS=Iceland.
Source: OECD (YYYY).
In 2021, the EU employment rate was 73.1%. This was some 5 pp lower than the 2030 employment target of 78% at EU level set out in the European Pillar of Social Rights action plan. While eight EU Member States had already reached this level in 2021, Greece and Italy continue to have a substantially lower employment rate, at 62.6% and 62.7%, respectively. Assuming a constant population, reaching the targeted employment rate of 78% by 2030 requires an additional 12.7 million people to work in the EU in the coming years.
The EU employment rate has increased gradually over the past decade. In the past nine years, it grew by more than 5.5 pp. Hungary experienced the largest increase (17%), due in part to a large-scale public work programme introduced in 2011, radical changes in its tax-benefit system over the past decade, (207) and the 2021 reclassification of mothers on parental leave as being in employment (mechanically raising the employment rate). The employment rate increased by more than 10 pp in six other countries: Croatia, Bulgaria, Poland, Ireland, Portugal and Malta. With the exception of Croatia, they all reached or surpassed the EU average by 2021, and Malta even reached the employment target.
The employment target cannot be reached at EU level without increasing labour market participation. If the participation rate were to remain unchanged, at 78.5%, the employment rate target would be consistent with an unemployment rate of 0.6%, implying practically non-existent involuntary unemployment and a frictionless labour market. (208)
Cross-country differences in participation and employment rates are at least partly explained by differences in tax-benefit systems. For example, a recent study (209) shows that more than two-thirds of the (3.6 pp) difference in participation of the prime-age population (25-54-year-olds) in Czechia and Hungary in 2008 could be explained by differences in their tax-benefit systems. The largest difference explained by the differences in the tax-benefit systems is identified for low-educated individuals and for married women. These differences related to higher personal income taxes for low earners and more generous maternity allowances in Hungary than in Czechia. Other possible drivers explaining the cross-country differences in participation rates include differences in schooling, pension schemes, or access to social services such as childcare. Chapter 3 looks at a selection of possible policy measures to incentivise people to work.
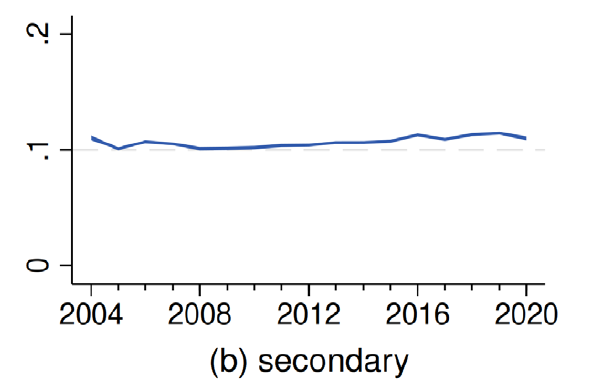
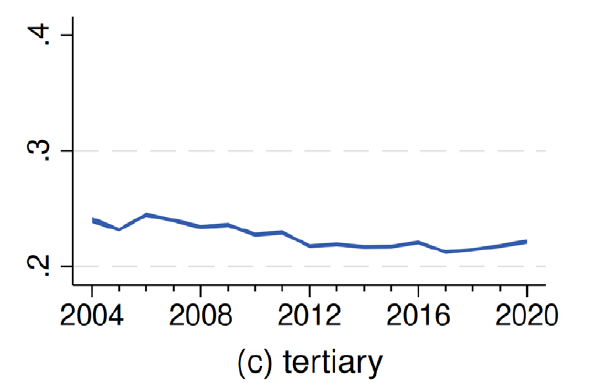
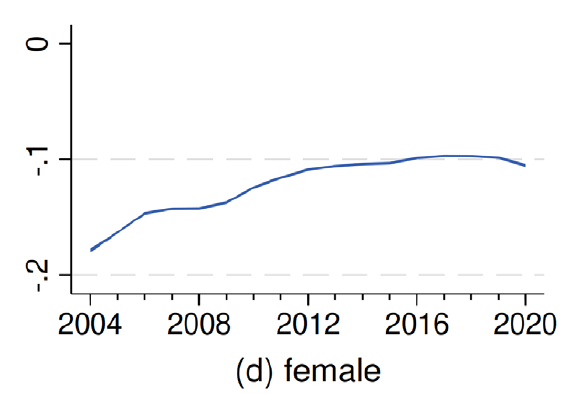
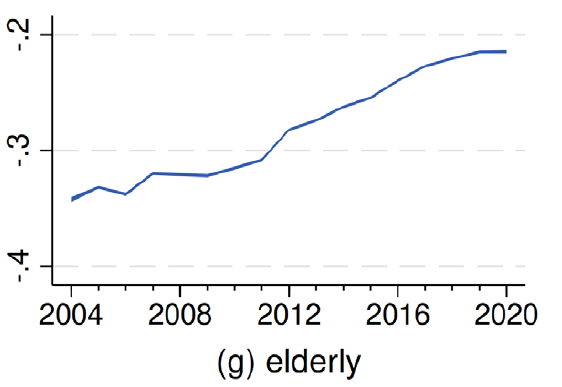
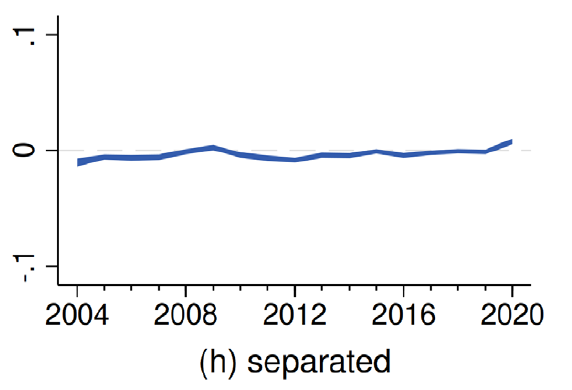
Individual characteristics are significant predictors of people’s participation probability. The effects of individual characteristics on the probability of being active (i.e. the marginal effects of individual characteristics) are estimated using EU-LFS microdata. (210) Students in regular education are less likely to work (-35 pp) (Chart 2.13). The highest level of education attained has a strong impact on the probability of being employed or actively seeking work: on average, secondary education increases participation probability by about 11 pp compared to lower levels of education, and a person who has completed tertiary education has a 23 pp higher probability of working or actively seeking employment. (211) Women are less likely to be active on the labour market (-12 pp), especially mothers of infants under three years (marginal effect of -10 pp). People aged 55+ participate in the labour market significantly less than younger generations (-28 pp compared to prime-age individuals), partly due to early retirement schemes. Marital status (being single, separated or married) has only a limited influence on people’s participation decisions.
Chart 2.13
Marginal effects of selected individual characteristics on participation probability
Effects of individual characteristics on participation probability among people aged 20-64, 2004-2020, EU-27

Note: Marginal effects calculated on sample mean based on an estimated logit model. Model also includes country and year dummies. Reference categories are: primary education, male, prime-age individuals, and single. Confidence intervals not presented, but extremely narrow.
Source: DG EMPL calculations, based on EU-LFS 2004-2020.
Individual characteristics as determinants of labour market participation show similar patterns across countries. A separate regression for each Member State shows that the impacts of these factors are very similar (Chart A.3). The largest variation is observed for the participation of students. In Luxembourg, Croatia, Romania, Hungary and Greece, the marginal negative impact of regular education (formal education, including schools, colleges and universities) exceeds -60 pp, while in the Netherlands it is about -10 pp. The participation of older people also shows important cross-country variation, albeit to a lesser extent. Interestingly, Czechia, Hungary and Slovakia stand out for their activity rates of mothers with infants. This may be explained by their comparatively generous maternity benefit systems (together with parental leave, these can cover the first three years of a child’s life) and the lack of sufficient early childcare provision (0-3 years of age). (212) In these countries, the marginal impact is between -34 pp and -44 pp, about twice as large as the next country in the ranking (Bulgaria).
Chart 2.14
Marginal effects of individual characteristics on participation probability in the EU, by year
Effects of individual characteristics on participation probability among people aged 20-64, 2004-2020, EU-27


Note: Marginal effects (and 95% confidence intervals) calculated on sample mean based on estimated logit models for each year. Model also includes year dummies.
Source: DG EMPL calculations, based on EU-LFS 2004-2020.
Most of the estimated effects of individual characteristics on labour market participation probability have remained quite stable over time (Chart 2.14). However, the past 20 years have seen students and older people participate more in the labour market. To a lesser extent, the gap between men and women also narrowed, until 2012, when the marginal effect for women stabilised at around -10 pp. Nevertheless, the labour market activity of mothers with infants has deteriorated over the past two decades (in 2020, the estimated marginal effect was close to -14 pp). The impact of other individual characteristics has remained fairly stable, including for those with tertiary education.
It is therefore important to understand which underrepresented population groups have the highest potential to contribute to increasing overall participation in the labour market. The following analysis assumes that the potential to contribute to the aggregate participation rate of a selected population group is determined by the weight of the particular subgroup in the total active population and the difference between the activity rate of this subgroup and the average activity rate of the same subgroup of the three best-performing countries (target activity). (213)
Chart 2.15
Working age population and activity in the EU, by gender, 2022-2050
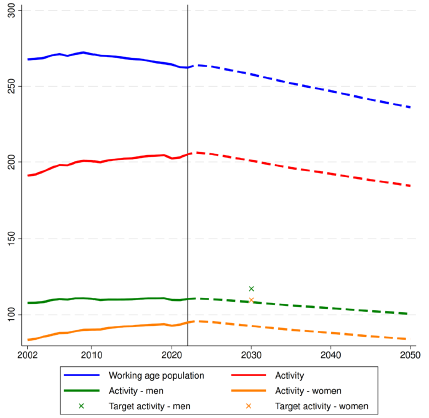
Note: Working-age population defined as the population from 20-64-year-olds in the EU. All other statistics also refer to the 20-64-year-old population.
Source: DG EMPL calculations, based on Eurostat and OECD data, and EUROPOP2023 population projections.
By 2030, female, older workers and secondary educated people represent the largest untapped potential workforce in the EU. Table 2.6 shows an indicator of the potential to influence the aggregate activity rate and the number of active people for nine selected labour market subgroups: young, prime-age individuals, older people, female, male, mothers, as well as primary, secondary and tertiary-educated people. (214) Women have the potential to increase the activity rate by 7.1 pp, adding around 17.3 million more active people by 2030 ((Chart 2.15), difference between orange dotted line and target activity rate), primarily because they represent more than half of the population. Men’s potential for contribution is considerably more limited (8.8 million). Secondary-educated people contribute 5.4 pp to the aggregate activity rate, representing about 13 million people. Similarly, this potential is mainly driven by the relatively high share of secondary-educated people (51.1%) in the total active population. Older people could also have a high impact on the activity rate in the EU, with a contribution of 4.7 pp, or about 11 million additional active people, due to the relatively large lag in the activity rate of older people in the EU compared to the best-performing countries.
Table 2.6
Female, secondary-educated and older people represent the largest untapped potential workforce in the EU
Potential contribution of various population groups to the aggregate activity rate by 2030
Subgroup |
Subgroupspecific activity rate in 2021 (%) |
Target subgroupspecific activity rate (%) |
Resulting EU activity rate in 2030 if the target is reached (%) |
Contribution of the subgroup to the EU activity rate (p.p.) |
Resulting number of active people in the EU in 2030 |
Contribution to the number of active people in the EU in 2030 |
|---|---|---|---|---|---|---|
Young |
69.8 |
84.5 |
81 |
3.2 |
208,751,872 |
7,431,456 |
Prime |
86.9 |
93.1 |
81.6 |
3.8 |
210,341,056 |
9,020,640 |
Elderly |
63 |
80.9 |
82.4 |
4.7 |
212,499,952 |
11,179,536 |
Female |
71.9 |
85.4 |
84.8 |
7.1 |
218,637,600 |
17,317,184 |
Male |
83.7 |
90.5 |
81.5 |
3.8 |
210,146,800 |
8,826,384 |
Mother |
68.2 |
86.9 |
78.7 |
1 |
202,904,512 |
1,584,096 |
Primary |
61.3 |
77.7 |
81.1 |
3.4 |
209,167,840 |
7,847,424 |
Secondary |
76.7 |
86.6 |
83.1 |
5.4 |
214,375,600 |
13,055,184 |
Tertiary |
89.3 |
93.2 |
79.2 |
1.5 |
204,302,400 |
2,981,984 |
Note: Calculation based on a purely hypothetical simulation of how much the overall activity rate would increase by 2030 if the activity rate of any of the listed labour market subgroups was equal to the average of the three highest group-specific activity rates currently observed among the EU-27. Activity rates of the other subgroups are assumed to remain constant. This calculation should not be confused with a realistic activity rate growth, nor is it intended to serve as a forecast or impact assessment.
Source: DG-EMPL calculations, based on Eurostat data and EUROPOP2023 projections.
Box 2.7: Estimating the potential contribution of selected population subgroups to the aggregate activity rate
The potential contribution of selected population subgroups to the EU activity rate is estimated in two steps. First, we forecast the future aggregate activity rate in 2030 by assuming that subgroup-specific activity rates remain constant between 2021 and 2030. Therefore, the change in overall activity rate is solely driven by the demographic changes, forecasted by EUROSTAT population projections in the EU (EUROPOP2023). Second, we assume that the overall activity rate is influenced by the increase of the activity rate of a specific subgroup, keeping constant the activity rate of the rest of the population. More specifically, we consider a scenario in which the labour market subgroup activity rate reaches the same level as the average of the three highest activity rates for this specific subgroup currently observed among EU27 countries, according to the Labour Force Survey data for 2021.
Results are presented in Table 2.6. The first two columns of the table present the current subgroup-specific activity rates and the target activity rates, the latter defined as the average activity rate of the three best performing EU countries for the specific subgroup. The third and the fifth columns show the estimated aggregate activity rate and the estimated number of active people in the EU by 2030, assuming that the population will change according to Eurostat’s EUROPOP2023 baseline forecast and group-specific activity rates remain constant. The fourth and sixth columns show how the aggregate activity would change in the EU by 2030 if the activity rate of the specific labour market subgroup reached the target.
Notes
- 206. Of the 11 non-EU countries considered, only three lagged behind the EU average: South Korea, US, and Israel.
- 207. See (Benczur, 2011) and (Mihály Szoboszlai, 2018) on the effects of past tax and benefits reforms in Hungary.
- 208. Unemployment rate: 1 – (employment rate / activity rate) = 1 – (0.78 / 0.785) = 0.006, i.e. about 0.6%.
- 209. (Galuscak, 2019).
- 210. Logit models are estimated on the panel of EU countries, with individual characteristics presented in Chart 2.13 as explanatory variables. The model also includes country and year dummies.
- 211. There are major differences, such as between graduates from general upper secondary education versus vocational education. A summary indicator of ‘secondary education’ simply shows the average impact of secondary education in relation to primary education.
- 212. In 2021, parental leave was redefined and counted as ’in employment’ for these countries in the EU-LFS, considerably increasing mothers’ employment rates.
- 213. In reality, increasing the participation rate of a subpopulation would likely influence the activity rate of other population groups as well, and cumulating the untapped potential of subgroups would be misleading. See Box 2.7 for the methodology.
- 214. The analysis does not include third-country nationals as a separate population group because the EUROPOP2023 projections do not include future gross migration (data are available only for net migration). Section 6. is dedicated to the labour market participation of migrants born outside the EU.