

3. The twin transition and changing skills needs
3.2. Labour and skills shortages in the digital age
Advances in digital technologies are changing the type of work people do, as well as the digital intensity of that work. (Box 2.5). Technological progress has led to automation of some occupations, transformation of others, and creation of some entirely new jobs. There is a broad consensus that the overall effect on the EU labour market has been an increase in demand for high-skilled work and a decline in demand for medium-skilled jobs. (170) The discussion on impacts of digital technologies on low-skilled jobs remains more ambiguous. (171) The transformation in the nature of work and skills needs has been accelerated by the recent advancements in AI. While this could have a positive impact on productivity, there are also concerns about job loss, stability, wages, and trust in employers to make the right decisions on AI. (172) Given the limited evidence, the impact of AI on labour shortages remains unclear.
Box 2.5: Digital intensity of work index
The digital intensity of work index (1) measures the proportion of digital skills among all required skills for each occupational group at ISCO 3-digit level. For example, if an occupation requires 10 skills and one of those skills is digital, the value of the index is 10%. This gives a useful approximation of the proportion of work requiring digital skills and competences, but has clear limitations in that it does not indicate the importance of digital skills in carrying out a given occupation, the level of those skills (e.g. basic or advanced), or how often they are used at work. (2) The digital intensity index is not the only measure used in the EU context. Other definitions developed in recent years (3) have identified similar occupations as highly digitally intensive, but with a number of differences in how occupations compare. Some of the findings presented here may depend on the specific measure of digital intensity of work adopted.
Apart from changing job structure, digitalisation has increased the digital intensity of work across occupations and sectors, a process accelerated by the COVID-19 pandemic. (173) This transformation of employment structure and content may contribute to increased digital skill needs in certain sectors or occupations, potentially leading to shortages of workers with these skills. At the same, digitalisation may help to fill certain vacancies, due to increases in job flexibility (place and time of work). The following analysis aims to identify shortages in digitally intensive work, the workers who could fill those gaps, and the challenges that must be addressed for this to happen. It expands on the analysis of digital intensity of work presented in ESDE 2022 by relating it to labour shortages and developing the analysis determinants of digital intensity of work. (174)
3.2.1 Labour and skills shortages in digitally intensive work
The relationship between digital intensity of work and persistent labour shortages is not straightforward. Rather, it reflects the ambiguous effects of digitalisation on employment. New digital technologies can automate routine tasks at the core of some (usually middle- or low-skilled) occupations. (175) This can reduce demand for digitally intensive work with a high proportion of routine content, (176) for example in certain administrative occupations. Where this happens, digitalisation may help to address existing labour shortages or prevent future gaps. However, adoption of new digital technologies can also generate new demand for jobs with diverse skill profiles. (177) For example, several highly skilled ICT occupations at the heart of the digital transformation have grown in recent years (Chart 2.5) and are projected to grow in the future (see section 2.2.). That growing demand, coupled with the need for advanced digital skills reflecting the newest technological developments, (178) opens these occupations to labour shortages. Increase in demand for less-skilled work can be seen in the context of the recent rise of work organised via digital platforms, for example.
Chart 2.5
Highest digital intensity of work observed in several ICT occupations
Digital intensity of work, by occupation (%), 2021, EU

Note: Analysis based on all Member States where occupational statistics are available at ISCO-08 3-digit level, i.e. excluding Bulgaria, Malta and Slovenia. High digital intensity covers occupations where at least 20% of all skills required are digital. Intermediate digital intensity covers occupations where 10-19% of all skills required are digital. Low digital intensity covers occupations where less than 10% of skills required are digital.
Source: EU-LFS 2021.
Few occupations in the EU labour market require a high digital intensity of work and all are found in the ICT professional and technician occupational groups (Chart 2.5). In these occupations, digital skills account for more than one in five of all required skills. Together, ICT professionals and technicians accounted for about 3% of employment in the EU in 2021. (179) There are also several occupations with intermediate digital intensity, where at least 1 in 10 of all required skills are digital. These mostly comprise different types of professionals and clerical support workers (listed in Chart 2.5), accounting for a further 7% of EU employment in 2021. The remaining 90% of EU employment usually requires at least some basic digital skills, but these account for less than 10% of all skills required in a given occupation. These figures are broadly in line with another measure of digital intensity developed by Cedefop, which shows that around 16% of the EU workforce engages with advanced digital technology at work (Box 2.6).
Box 2.6: Other measures of digitalisation - Cedefop’s digital skills intensity (DSI) index
The Cedefop DSI index (1) uses a composite indicator approach to characterise jobs in terms of their intensity of use of digital technologies in 29 European countries. It blends quantitative and qualitative technology intensity: the number of computer applications Europeans use in their jobs and their skill complexity.
Chart 1
Digital skills intensity of EU+ jobs in 2021

Source: Cedefop ESJS 2021.
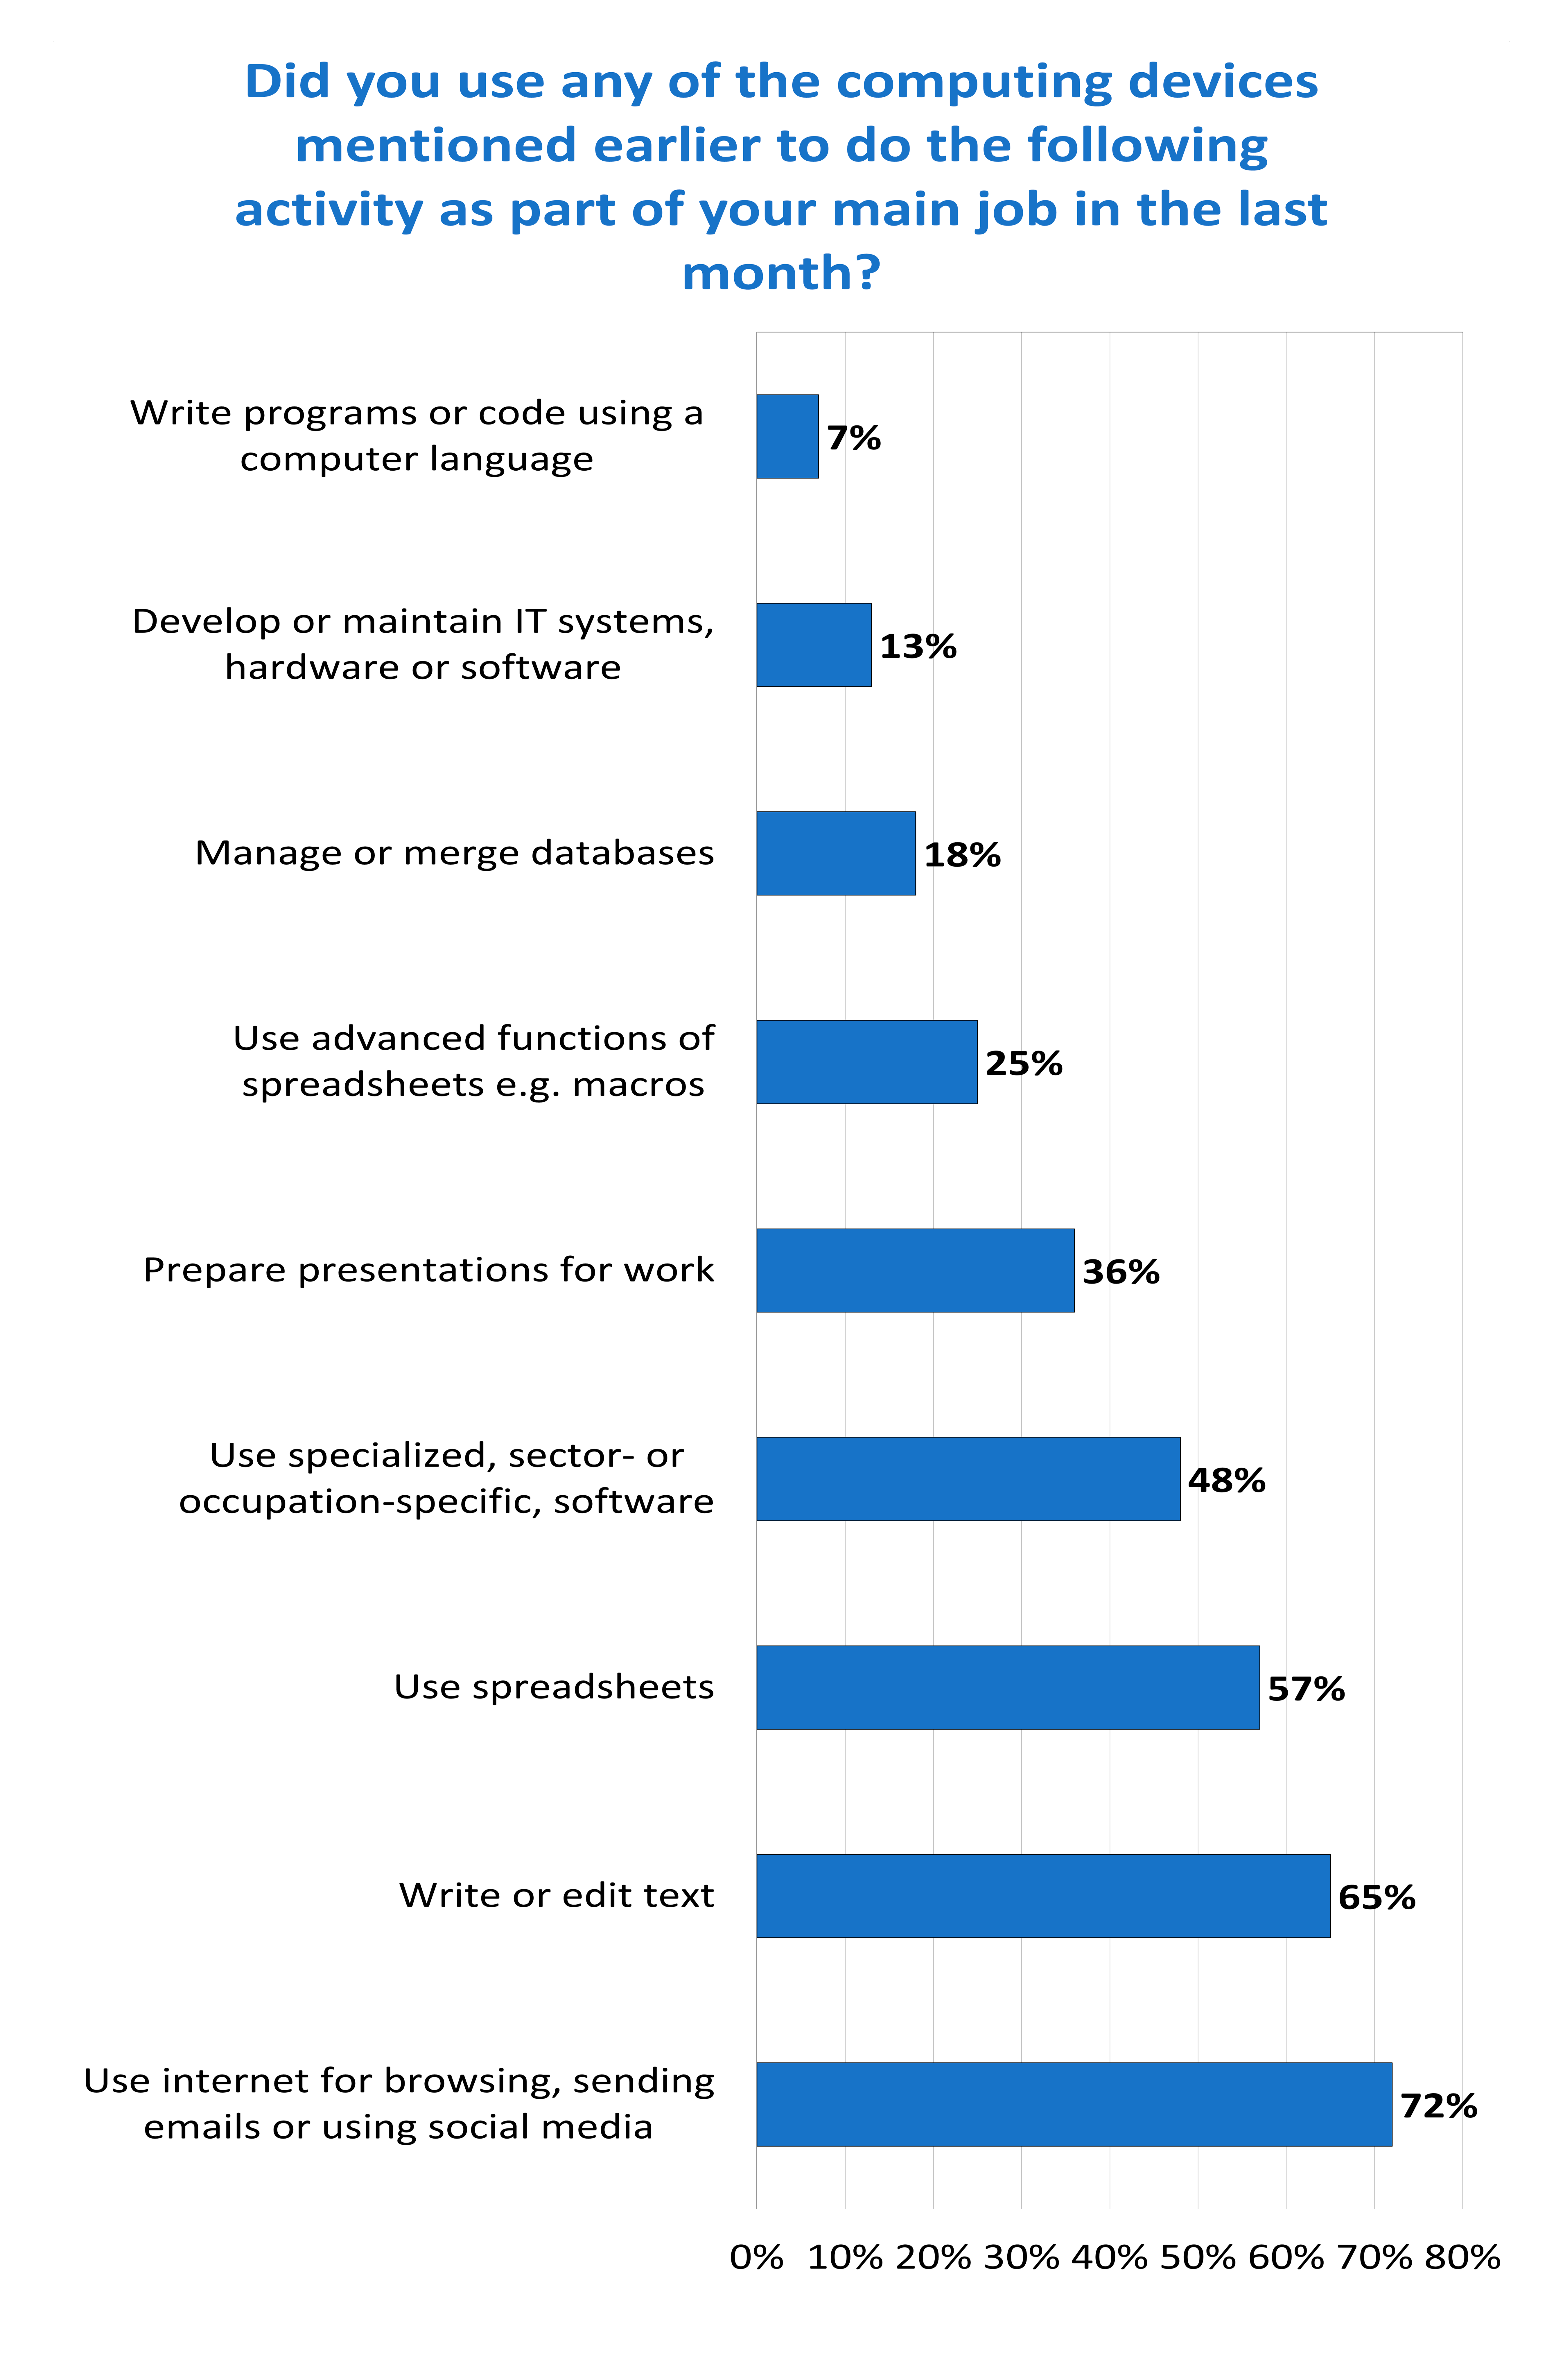

The Cedefop DSI index shows that around 16% of the EU+ workforce engages with advanced digital technology at work. This includes computer programming (e.g. use of AI algorithms) and ICT system maintenance and development. Of those, 43% are employed in posts with a medium-level DSI. Most carry out digital activities with an intermediate skill complexity (e.g. using sector-specific or occupation-specific software, using formulas and macros in spreadsheets, or merging and managing databases) that they do alongside more basic digital tasks. A further 10% of EU+ employees are in jobs with a very low DSI (e.g. exclusively browsing the web, sending emails, or using social media at work), while 18% are in jobs with a low DSI (e.g. using word processing and spreadsheets, or making presentations) and 13% do not use any computer devices to do their job.
- 1. Cedefop (2022e).
Across the Member States, persistent labour shortages are common among ICT professionals, (180) notably software and applications developers and analysts. These occupations often combine high digital intensity (around one-third of all skills required are digital) with highly skilled work (more than 7 in 10 workers hold a tertiary degree). They registered considerable growth in employment over the last decade (Chart 2.6) and this growth is expected to continue, according to Cedefop forecasts (see section 2.2.). Shortages are less common in ICT occupations with technician status. These include a substantially lower proportion of tertiary-educated workers (around 40%), with employment growth also less pronounced between 2011 and 2021.
Chart 2.6
Employment in ICT occupations grew since 2011
Number of workers employed in ICT occupations over time (thousands), EU

Note: Analysis based on all Member States where occupational statistics are available at ISCO-08 3-digit level for ICT occupations, i.e. excluding Bulgaria, Ireland, Malta and Slovenia.
Source: EU-LFS 2011-2021.
From a sectoral perspective, persistent labour shortages were widespread (reported by 17 Member States) in computer programming, consultancy and related activities (see section 2.1.). This subsector falls under the highly digitally intensive information and communication sector (Chart A.1), although data limitations prevent an assessment of digital intensity of work at subsector level. An alternative measure of digital intensity developed by Eurostat ranks around 90% of enterprises in this subsector as highly or very highly digitally intensive. (181)
Other occupations and sectors facing persistent labour shortages across EU Member States are typically not very digitally intensive. Only the work of electro-technology engineers is of at least intermediate digital intensity. For the remainder, digital skills account for fewer than 1 in 10 required skills. In fact, apart from ICT occupations, shortage occupations are, on average, somewhat less digitally intensive than non-shortage occupations. (182) Labour shortages in non-ICT occupations and sectors are therefore likely to be primarily driven by factors other than digitalisation (see section 2.2.).
3.2.2 Digital divides in the labour market
Addressing persistent labour shortages in digitally intensive work necessitates understanding who has the digital skills necessary to perform this kind of work. This section briefly explores the distribution of digital skills among the broader population, then analyses who performs work requiring digital skills. It concludes by analysing the key factors that affect the digital intensity of work.
There are several important digital divides in skills among the EU working-age population, including educational attainment, age, and employment status. (183) A recent report highlighted that in the EU in 2019, around 60% of individuals of working age (25-64) had at least basic digital skills, (184) (185) with the European Pillar of Social Rights action plan setting a target of at least 80% of the EU population aged 16-74 having basic digital skills by 2030. (186) The proportion of people with at least basic digital skills was much lower for low-educated individuals (24%), 55-64-year-olds (42%), and those who were either unemployed (45%) or inactive (33%). The evidence for a gender divide in digital skills is less conclusive, (187) but suggests that more men than women have certain advanced digital skills. (188) Overall, the research highlights the following priority groups for digital upskilling/reskilling actions: young people with low levels of education and NEETs; 55-64-year-olds; people with lower levels of educational attainment; those who are inactive and unemployed; those employed in low-skilled and semi-skilled occupations; those living in rural areas; and non-EU nationals. (189)
The education divide in digital skills is mirrored in the digital intensity of work (Chart 2.7). For example, the work of highly educated men is far more digitally intensive than that of less-educated men, at around 10% and 2%, respectively. Gender differences in the use of digital skills at work are more pronounced than gender differences in digital skills among the overall population, especially among workers with tertiary education. Tertiary-educated men work in occupations where around 8% of all skill requirements are digital, whereas for tertiary-educated women this proportion is only about 5%. (190) Differences in the digital intensity of work of young and older workers are quite small compared to the age divide in digital skills among all people of working age.
Chart 2.7
Work of young, highly educated men is the most digitally intensive
Digital intensity of work, by age, gender, educational attainment (%), 2021, EU

Note: Analysis based on all Member States where occupational statistics are available at ISCO-08 3-digit level, i.e. excluding Bulgaria, Malta and Slovenia.
Source: EU-LFS 2021.
Most divides in the digital intensity of work stem from underrepresentation of certain groups of workers in specialist ICT work with high digital intensity. This can be demonstrated by a joint analysis of factors affecting the digital intensity of work through several ordinary least squares (OLS) regression models (Chart 2.8). (191) The results of this analysis should be interpreted with caution, as the data cover only some of the likely drivers of digital intensity of work.
Accounting solely for differences in basic worker and job characteristics explains less than half of the overall variation in digital intensity of work. Age, gender, country of birth, place of residence and level of educational attainment do not explain much of the variation. The same is true for several job characteristics, including the part-time or temporary nature of the work, supervisory responsibilities, employer size, and participation in training (Chart 2.8, Model 1). Together, these personal and job characteristics account for only about 6% of the overall variation in digital intensity of work at EU level. Differences in workers’ fields of educational achievement and economic activity play a more prominent role. For example, the digital intensity of work increases by about 12.3 pp for workers with either secondary or tertiary qualifications in ICT, compared to those who have not achieved any secondary or tertiary qualification. Yet, accounting for these differences in addition to personal and job characteristics explains less than 40% of the variation in digital intensity of work (Chart 2.8, Model 2).
Most differences in digital intensity of work (around 80%) can be traced to who does and does not work in ICT occupations. (192) Working in an ICT occupation increases the digital intensity of work by 27.7 pp compared to working in a non-ICT occupation, a far larger effect than for any other factor (Chart 2.8, Model 3). Taking this effect into account considerably reduces the importance of other factors, highlighting that their impact matters only insofar as they increase the chances of working in an ICT occupation. For example, tertiary-educated men have, on average, higher digital intensity of work than similarly educated women (Chart 2.7), largely as a result of higher male participation in ICT occupations. (193) Thus, attracting more women into ICT occupations has the potential to both alleviate certain labour shortages in this area (see section 3.2.3.) and reduce existing gender disparities in use of digital skills at work.
Chart 2.8
Broader divides in digital intensity of work often result from differences in participation in ICT work
Predicted changes in digital intensity of work, by selected worker and job characteristics, workers aged 20-64, 2021, EU

Note: Analysis based on all Member States where occupational statistics are available at ISCO-08 3-digit level, i.e. excluding Bulgaria, Malta and Slovenia. Specification of model 1 controls for: age, country of birth, education level, degree of urbanisation, country, part-time work, temporary contracts, supervisory responsibilities, training attendance and employer size. Specification of model 2 additionally controls for: field of education, sector of economic activity. Model 3 additionally controls for working in the following ICT occupations: Software and applications developers and analysts; database and network professionals; ICT operations and user support technicians; telecommunications and broadcasting technicians.
Source: EU-LFS 2021 data.
3.2.3 Persistent gender segregation in shortage ICT occupations
Addressing underrepresentation of certain groups of workers among ICT professionals can help to address persistent labour shortages in digitally intensive work. This follows a similar logic to the broader group of STEM occupations (see section 5.) to which ICT professionals belong. ICT work is primarily carried out by (young or middle-aged) tertiary-educated men with advanced digital skills. Their employment rates are already very high, limiting the potential to attract additional workers from this group. Increasing the labour supply of groups underrepresented in digitally intensive work is more promising, as activity rates of some of these groups (women and older workers, in particular) are still comparatively low (see section 4.). At the same time, new workers from these groups are unlikely to move into hard-to-fill vacancies in ICT unless measures are taken to address the factors underpinning their current underrepresentation and to address their upskilling and reskilling needs.
The following analysis considers key factors driving women’s low participation in ICT occupations. (194) Gender segregation is known to contribute to labour shortages across all STEM occupations, including in ICT (see section 5.). However, the factors underlying the underrepresentation of women in ICT occupations differ somewhat from those for STEM as whole, reflecting the specific skill requirements, content, organisation and working conditions of ICT work.
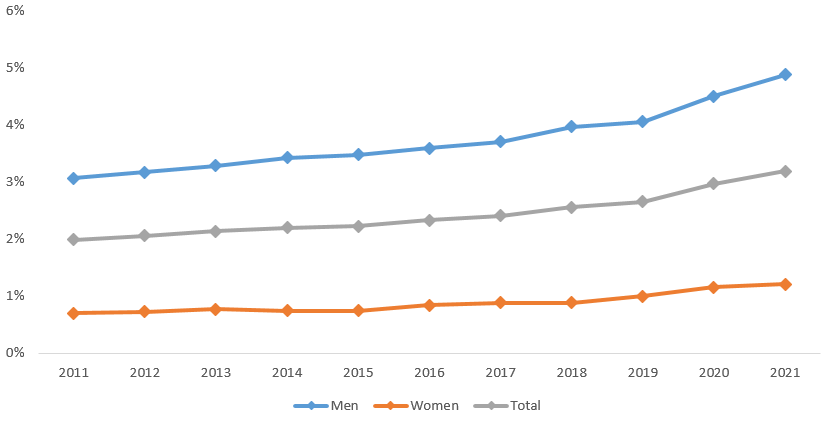
In 2021, there was a significant gender gap in ICT occupations (Chart 2.9). More specifically, 4.9% of all working men were employed in ICT occupations, compared to only about 1.2% of all working women, a gender gap of almost 4 pp. That gap increased considerably during the past decade (up from 2.4 pp in 2011) and may have accelerated since the start of the COVID-19 pandemic. Overall, women accounted for only about 17% of all EU employment in ICT occupations in 2021. (195)
Chart 2.9
Gender gap in ICT occupations has increased since 2011
Proportion of workers in ICT occupations, by gender (% of all workers), 2011-2021, EU
Note: Analysis based on all Member States where occupational statistics are available at ISCO-08 2-digit level, i.e. excluding Malta.
Source: EU-LFS 2011-2021.
Key factors in the underrepresentation of women in ICT broadly correspond to those for STEM occupations, but reflect the particular nature of ICT work. Children are exposed to stereotypical images of ICT work and ICT workers from an early age, which contributes to gender divides in confidence in digital skills and aspirations to work in ICT. In the EU, by 15 years of age, around 1 in 10 boys expect to work in ICT, compared to only 1 in 100 girls. (196) Predictably, heavy overrepresentation of men in ICT studies follows, with men accounting for about 8 in 10 students in this field at EU level in 2020. (197) Even where women hold relevant qualifications, they have a lower likelihood of progressing into and keeping ICT jobs. This may be linked to certain aspects of employment in ICT, such as: reliance on full-time work patterns that are difficult to reconcile with unpaid care responsibilities; biases in recruitment practices, remuneration (gender pay gap), and promotion ladders; or masculine working cultures that may be particularly difficult for women to work within. (198) There are also some indications that women’s employment in ICT may be concentrated in certain occupations and workplaces, with limited opportunities available elsewhere. (199)
Around half of the gender gap in ICT occupations results from differences in worker characteristics, most notably the overrepresentation of men among workers with ICT-related qualifications and in ICT-intensive sectors (Chart 2.10). Several other gender differences explain smaller – albeit significant – parts of this gender gap, but these largely cancel one another out.
Chart 2.10
Only one-quarter of the gender gap in ICT work is explained by men holding most ICT qualifications
Gender gaps in ICT occupations, by contributing factors (pp), workers aged 20-64, 2021, EU

Note: Analysis based on all Member States where occupational statistics are available at ISCO-08 2-digit level, i.e. excluding Malta.
Source: EU-LFS 2021.
It is striking that around half of the gender gap in ICT remains unexplained by differences in worker characteristics. This is a much higher proportion than for STEM occupations more broadly (see section 5.). It may partly reflect the fact that certain worker characteristics significantly increase the probability of working in an ICT occupation for men, but less so for women. It may also reflect a lack of data on several important factors for participating in ICT jobs. For example, EU-LFS data do not capture information on gender discrimination and stereotypes at the workplace (including the gender pay gap), various aspects of organisational working culture, or the amount of unpaid care that workers undertake in addition to their paid work. Studies on women’s participation in ICT have highlighted all of these important factors (200) and their omission may lead to biases and imprecise analysis.
Even when women hold relevant ICT qualifications, their chances of working in ICT occupations increase less than for men (Chart A.2). For male workers, holding at least a secondary qualification in an ICT field raises their chances of working in ICT occupations by more than 33 pp, almost twice as much as it does for women (less than 19 pp). Holding a qualification in science, mathematics and statistics increases men’s chances of working in ICT occupations by about 5 pp on average, as does any generic qualification at secondary level or above. While these qualification types also improve the corresponding chances of women, their increases are less than half those of men. These findings support previous evidence suggesting that even where women achieve ICT-related qualifications, it is often harder for them to find and sustain employment in ICT jobs. (201)
Notes
- 170. (Goenaga et al., 2019), (OECD, 2019a).
- 171. (European Commission, 2019c), (OECD, 2019a), (Autor, Levy and Murnane, 2003).
- 172. (OECD, 2023d).
- 173. (Cedefop, 2022e), (Cedefop, 2022b).
- 174. (European Commission, 2022e). For the original publication on digital intensity of work in the EU, see (Barslund, 2022).
- 175. (European Commission, 2019c), (OECD, 2019a), (Autor, Levy and Murnane, 2003).
- 176. See (Cirillo et al., 2021) for a national example of this effect.
- 177. (Goenaga et al., 2019), (OECD, 2019a), (Grundke et al., 2018), (Acemoglu, 2002).
- 178. (Centeno, Karpinski and Urzi Brancati, 2021).
- 179. According to a broader definition of ICT specialists adopted in DESI (available here), ICT specialists accounted for 4.5% of employment in the EU in 2021.
- 180. This covers occupations under ISCO 2-digit code 25 (ICT professionals).
- 181. See Eurostat dataset isoc_e_diin2.
- 182. (Cedefop, 2022e).
- 183. (Elena-Bucea et al., 2021), (Centeno, Karpinski and Urzi Brancati, 2021), (EIGE, 2020b).
- 184. Overall digital skills refer to five areas: information and data literacy skills, communication and collaboration skills, digital content creation skills, safety skills and problem-solving skills. To have at least basic overall digital skills, people must know how to do at least one activity related to each area. More information on the types of activities related to each skill available here.
- 185. (Centeno, Karpinski and Urzi Brancati, 2021).
- 186. According to the relevant Digital Economy and Society Index (DESI) indicator, including a broader age range (available here), 54% of individuals aged 16-74 in the EU possessed at least basic digital skills in 2021.
- 187. There are some gender gaps in online access and digital skills among young men and women, but older and less-educated women tend to be disadvantaged compared to their male peers (EIGE, 2020b).
- 188. Notably, above basic software skills (EIGE, 2020b).
- 189. (Centeno, Karpinski and Urzi Brancati, 2021).
- 190. This gender gap is larger among young (aged 20-34) tertiary-educated workers (3.6 pp) than among those aged 50+ (2.3 pp).
- 191. Starting from a model that covers basic worker and job characteristics, then adding information about types of qualifications workers hold and the sectors in which they work, and finally adding information about who does/does not work in ICT occupations.
- 192. This includes the following occupations according to ISCO-08 3-digit classification: software and applications developers and analysts; database and network professionals; ICT operations and user support technicians; telecommunications and broadcasting technicians.
- 193. How digital intensity of work is measured does not capture intra-occupation variation. This analysis therefore cannot capture situations where individuals work in an occupation that has low digital intensity on average, but their jobs are much more digitally intense than the average.
- 194. Analysis follows the same methodology used in (European Commission, 2023i).
- 195. When following the broader definition of ICT occupations outlined in DESI, this proportion was 19% in 2021. The definition of the ICT specialists' occupations in DESI is based on the ISCO-08 classification. It includes ICT service managers (code 133), ICT professionals (25), ICT technicians (35) and some other groups, from electronic and telecommunications engineers (215*) up to ICT installers and servicers (7422). More information available here.
- 196. (OECD, 2019b).
- 197. Eurostat dataset educ_uoe_grad02.
- 198. (Verges Bosch et al., 2021), (EIGE, 2020a), (Graham et al., 2016), (Valenduc, 2011).
- 199. Ibid.
- 200. (EIGE, 2020b).
- 201. (EIGE, 2020a), (Graham et al., 2016), (Valenduc, 2011).