

2. Supporting labour market participation
2.2. Access and affordability of childcare services to support labour market activation
2.2.1. Net childcare costs (NCC)
The provision of childcare is one of the key elements in removing entry barriers to the labour force and tackling labour shortages. There is evidence that quality childcare provision has a positive impact on women’s participation in the labour market and on child development across age and socioeconomic groups. (301) Adequate childcare supply boosts women’s employment, reduces child poverty, and provides positive fiscal returns in the longer term. (302) Comprehensive ECEC services affect employment from both the demand and supply sides, as they lessen parents’ (particularly mothers’) need to reduce their labour market participation (303) and mitigate employers’ concerns about possible reduced employee productivity on return to work after welcoming a child.
A household’s decision to use formal childcare is driven by the accessibility, affordability, and availability of ECEC services, as well as parental leave rights and cultural expectations. Women’s involvement in the labour market increases as the number of available daycare slots rises. (304) In addition, the uptake of ECEC grows as the quality of services increases and information barriers linked to access (e.g. financial and cultural barriers, regional inequalities, language) are lowered. (305) Key EU-level actions for childcare are outlined in the European Care Strategy and the Council Recommendation on early childhood education and care. New 2030 ECEC participation targets are set at 45% (306) of children aged 0-2 (307) and 96% of children from the age of three to compulsory school age, mirroring the targets set in the European Education Area initiative. In addition, the European Child Guarantee aims to guarantee free ECEC to all children at risk of poverty or social exclusion.
On average, NCC decreased between 2012 and 2019, as a proportion of women’s median full-time earnings. The highest decrease was recorded for single-parent households with median earnings and for couples with low earnings (-4.4 pp). Significant NCC declines were estimated in Czechia and Poland for the four household types considered. (308) In Latvia, the declines were significant for low-earning and median-earning single parents (Chart 3.1). The exceptions were Romania, Slovakia, Spain and Hungary, where the NCC rate increased across family types. Between 2019 and 2022, EU-level NCC indictors decreased by 1.3 pp on average across the selected household types
NCC vary considerably across the Member States. Based on 2019 data, NCC in Malta, Italy and Germany are very low or close to zero due to heavily subsidised childcare fees. Childcare costs are also comparatively low in Denmark and Sweden. Despite improvements in Czechia, NCC remain more than one-third of women’s median earnings. Even higher levels are recorded in Cyprus, where childcare is primarily provided through private facilities. The cost for median-earning couples in Ireland remains significantly high (Chart 3.1).
Lower NCC may foster higher ECEC participation and labour market participation of women. Looking at NCC rates, ECEC participation, and employment of mothers with two children over time (2012-2019), a negative relationship can be posited between NCC and ECEC participation and between NCC and employment. (309) All EU countries that reduced their NCC over the period saw a rise in ECEC participation and employment. The nature of the data analysed, varying granularity of the indicators, and the existence of other cofounding variables limit the extent to which country-level findings may be generalised.
Chart 3.1
Affordability of childcare varies across household types and countries, ranging from zero to more than one-third of women’s median earnings
Member States’ NCC as a share of women’s median full-time earnings (%), by household type, 2012-2019, EU

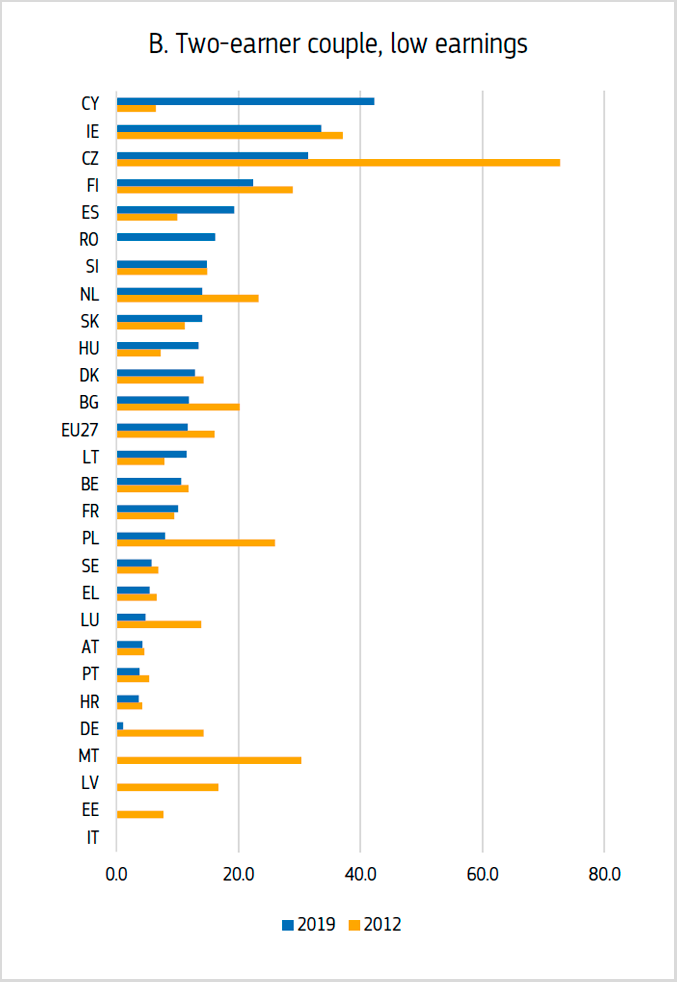
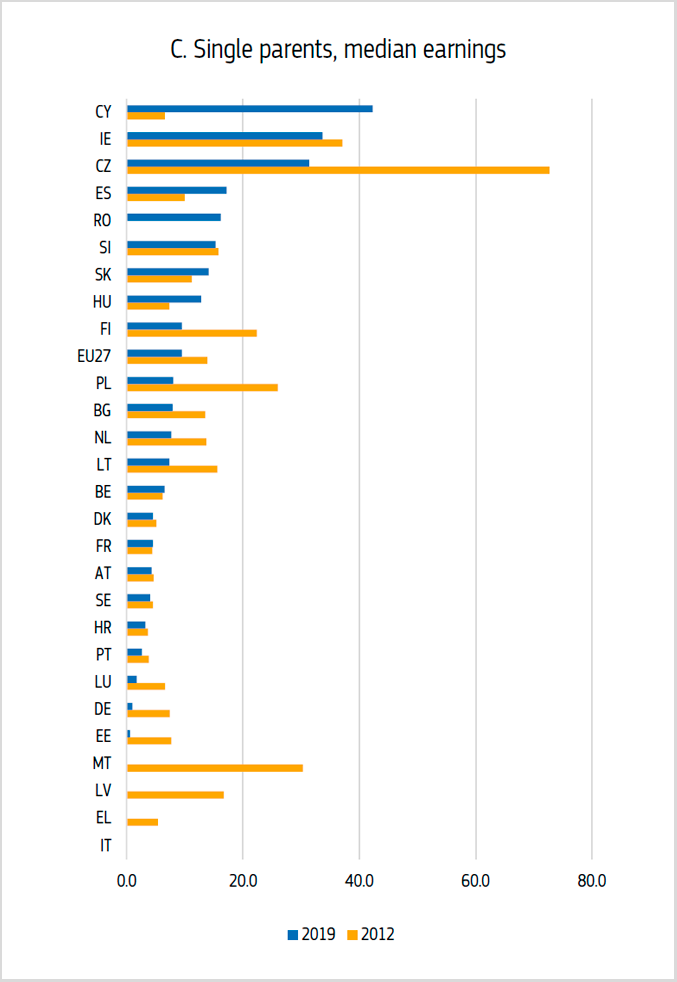

Note: Data for Croatia, Cyprus missing in 2012. Earliest data in 2015 (Croatia) and 2018 (Cyprus) selected.
Source: OECD TaxBEN model 2021.
2.2.2. Geographical inequalities in accessibility of ECEC and primary education (310)
Geographical accessibility of ECEC providers and primary schools influence parents’ decisions to work. Other important factors are availability (e.g. opening hours or capacity), cost, and quality issues. For parents of young children and for single parents in particular, the ease and flexibility of access to childcare determines decisions on taking up employment, as well as the amount of hours worked. Parents often need to bring young children to ECEC facilities and primary schools in the morning and pick them up in the afternoon, with long commutes likely to reduce the time available for paid work. In case of non-compulsory ECEC, long commutes may even induce parents not to use ECEC at all, severely limiting their options to combine childcare with paid work. This section presents early results on the geographical accessibility of ECEC facilities (311) and primary schools across small regions (312) in a range of Member States (313) from ongoing research by the OECD. (314)
Chart 3.2
In most regions, primary schools are not easily accessible on foot but are within a 15-minute drive
Share of population with access to a primary school within a 15-minute walk or drive, by TL3 region, 2022 or latest year available
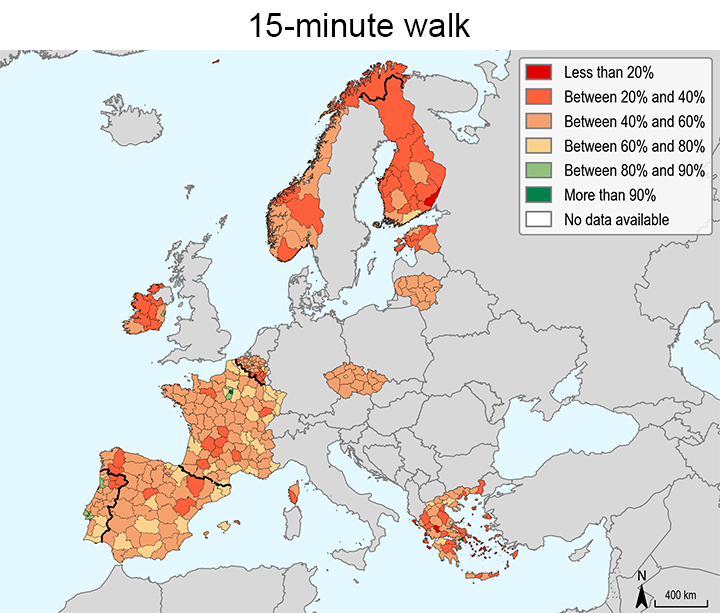

Note: Preliminary results for EU countries with available data. Island regions of Azores and Madeira (Portugal) and the special autonomous regions Ceuta and Melilla (Spain) not included. Estimates do not consider capacity or entry criteria – distance calculated to the closest school available either via walking or driving. Driving time estimates do not consider traffic congestion and thus constitute lower bounds of people’s actual driving times.
Source: OECD calculations, based on primary schools’ location data obtained from several sources.
In most regions, many children cannot reach a primary school within a 15-minute walk (Chart 3.2, left panel). In about one in two regions, less than half of the total population has access to a primary school within a 15-minute walk. Access tends to be lower in remote regions, particularly on islands (e.g. Euboea in Greece, Menorca in Spain) and in regions with low population density (e.g. Lapland in Finland, Evrytania in central Greece). Access by driving is far higher (Chart 3.2, right panel). Classifying regions into low (30-50% of population have access), medium (50-80% have access) and high (more than 80% have access) accessibility, around 98% of the population live in regions with high accessibility of primary schools within a 15-minute drive. Similar to walking, regions with lower access by driving are often remote or have low population density.
Similar conclusions can be drawn for ECEC services, (315) although access seems to be somewhat greater than for primary schools (Chart 3.3). Around 80% of people live in regions with medium accessibility of an ECEC facility within a 15-minute walk, while around 98% of the population live in regions with high accessibility within a 15-minute drive.
Chart 3.3
In most regions, ECEC facilities are not easily accessible on foot but are within a 15-minute drive
Share of population with access to an ECEC facility within a 15-minute walk or drive, by TL3 region, 2022 or latest year available, 2022 or latest year available

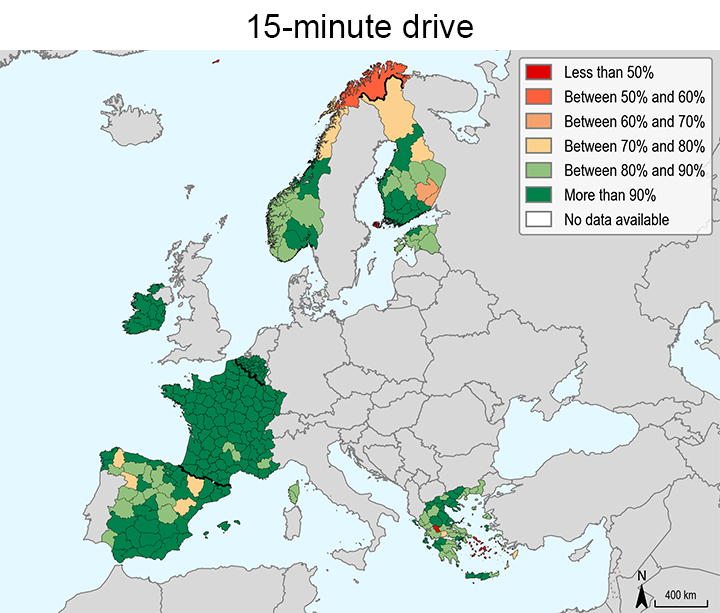
Note: Preliminary results for EU countries with available data. Primary schools: island regions Azores and Madeira (Portugal) not included. Primary schools and ECEC: special autonomous regions Ceuta and Melilla (Spain) not included. ECEC: data not available for German-speaking municipalities in Belgium (i.e. excludes Bezirk Verviers - Deutschsprachige Gemeinschaft). For Estonia, France, Greece and Spain only pre-primary education is covered in the ECEC services location data. Estimates do not consider capacity or entry criteria – distance is calculated to the closest ECEC provider available either via walking or driving. Driving time estimates do not consider traffic congestion and thus constitute lower bounds of people’s actual driving times.
Source: OECD calculations, based on ECEC facilities location data obtained from several sources.
The share of people living close to an ECEC facility or primary school is far higher in metropolitan than non-metropolitan regions. (316) The accessibility of ECEC and primary education tends to be highest in capital regions. For example, in Paris (France), 99% of people live within a 15-minute walk of an ECEC facility, while in Brussels (Belgium), 88% of people live within a 15-minute walk of a primary school. Regions with lower access tend to have lower population density, such as Haute-Vienne in France, where only 47% of people live within a 15-minute walk of an ECEC facility, or Pirkanmaa in Finland, where only 46% of people live within a 15-minute walk of the closest primary school.
Access can vary greatly between metropolitan regions for both primary schools and ECEC facilities, with some regions having low access and others almost perfect access (Chart 3.4, left panel and Chart 3.4, right panel, respectively). Even among metropolitan regions, comparisons across countries can be difficult because of differences in country size, share of population living in metropolitan regions, and types of institutions covered (i.e. kindergarten only, or including early childcare). This makes it useful to focus only on countries that are somewhat comparable, such as France and Spain (Box 3.3), two large countries for which the available ECEC data currently cover institutions at ISCED-02 (kindergarten) level only.
Chart 3.4
Accessibility of primary schools and ECEC services on foot varies substantially across metropolitan regions
Share of population with access to a primary school and ECEC facility within a 15-minute walk, for metropolitan TL3 regions, 2022 or latest year available

Note: Preliminary results for EU countries with available data. Countries sorted by national average in ascending order. Primary schools: island regions Azores and Madeira (Portugal) not included. Primary schools and ECEC: special autonomous regions Ceuta and Melilla (Spain) not included. For countries with * (Estonia, France, Greece and Spain), only pre-primary education is covered in ECEC services location data. Estimates do not consider capacity or entry criteria – distance calculated to the closest school/facility available either via walking or driving. Driving time estimates do not consider traffic congestion and thus constitute the lower bound of estimates of people’s actual driving times.
Source: OECD calculations, based on primary schools and ECEC facilities location data obtained from several sources.
In most countries considered, the share of the population able to access a primary school or an ECEC provider within a 15-minute walk is higher in regions where children (317) account for a larger population share Further analysis is needed to determine the extent to which this finding reflects the response to local demand, i.e. the deliberate placing of ECEC facilities or primary schools in regions with many young children. An alternative explanation could be that the population share of children is greater in regions with high population density, where the coverage by ECEC services and primary schools is also higher.
Box 3.3: Geographical accessibility of ECEC facilities in France and Spain
Chart 1
ECEC facilities are not easily accessible on foot in most regions of France and Spain
Share of population with access to an ECEC facility within a 15-minute walk, 2022 or latest year available

Note: Preliminary results for France and Spain. Special autonomous regions Ceuta and Melilla (Spain) not included. For both countries, only pre-primary education is covered. Estimates do not consider capacity or entry criteria – distance is calculated to the closest facility available either via walking or driving. Driving time estimates do not consider traffic congestion and thus constitute the lower bound of people’s actual driving times.
Source: OECD calculations, based on ECEC facilities location data obtained from several sources.
In both France and Spain, accessibility of ECEC facilities on foot is generally low (Chart 3.3). In Spain, 14% of the population has medium accessibility within a 15-minute walk of the nearest facility, as does 20% of the population in France (corresponding to 25% of all regions in Spain and 45% in France). However, there seem to be differences in accessibility among metropolitan regions between the two countries. In France, 4 out of 35 metropolitan regions have high walking accessibility of ECEC institutions. In Spain, no region reaches this level: the metropolitan region of Madrid has the highest accessibility, with 78% of the population living within a 15-minute walk of an ECEC facility. At the lower end, in a number of regions in both countries, only about one-third of the population live within a 15-minute walking distance of the nearest ECEC facility. The lowest values are found in Lozère in the south of France and Creuse in central France (31% and 33%, respectively) and the two Galician regions of Lugo and Orense in Spain (28% and 35%, respectively). All of these are non-metropolitan regions, but the two Spanish regions are close to a small city, whereas the two French regions are remote.
Chart 2
ECEC facilities are very accessible by car throughout France but less so in many Spanish regions
Share of population with access to an ECEC facility within a 15-minute drive, 2022 or latest year available

Note: Preliminary results for France and Spain. Special autonomous regions Ceuta and Melilla (Spain) not included. For both countries, only pre-primary education is covered. Estimates do not consider capacity or entry criteria – distance is calculated to the closest facility available either via walking or driving. Driving time estimates do not consider traffic congestion and thus constitute the lower bound of estimates people’s actual driving times.
Source: OECD calculations, based on ECEC facilities location data obtained from several sources.
Disparities in the accessibility of ECEC facilities by driving are more significant (Chart 3.3). In France, all people live in regions with high accessibility of an ECEC facility within a 15-minute drive. By contrast, in Spain, four regions (Huesca, Teruel, Lugo and Zamora) experience less than high accessibility.
2.2.3. Effects of improving accessibility of childcare services
The Council Recommendation establishing a European Child Guarantee points to high ECEC costs as a barrier to participation, especially for children from low-income families. The Council Recommendation on the revision of the Barcelona targets identifies low-income mothers as particularly receptive to financial incentives. As education is a major factor in intergenerational income mobility, improving access to ECEC for these children is essential. (318) The Recommendation sets a new ECEC participation target of 45% for children below three years of age. (319)
An increase in formal childcare provision to reach the targeted 45% ECEC participation rate would significantly increase the participation of mothers from low-income families in the labour market. The expected changes in labour participation rates of mothers living in households in the lower half of the income distribution is assessed using an extension of the combined EUROMOD-EUROLAB behavioural microsimulation model that accounts for childcare options. The model simulates the impact of additional (fully taken) childcare slots to achieve 45%, 50% and 55% ECEC participation targets, while keeping the childcare fees per child unchanged, in Austria, Hungary, and Italy (Table 3.3). In these simulations, the decision of work or stay out of the labour market is endogenous. The availability of additional child-care slots impacts the budget constraint of the relevant households, thereby influencing mothers’ labour supply. The methodology is described in Box 3.4. Reaching the target of 45% is expected to increase participation of mothers living in households in the lower half of the income distribution by between 5 pp (Italy) and 17 pp (Austria) (see the second row of Table 3.3). The impact on labour supply is smaller in Italy, where formal childcare take-up and labour participation of mothers are already relatively high. (320) Reaching a more ambitious target of 55% would have a stronger impact on labour participation rates, particularly in Austria (25 pp). (321)
Box 3.4: Method of estimating the impacts of increasing the availability/take-up of childcare slots
The analysis is based on the childcare extension of EUROLAB, a discrete choice labour supply model that accounts for childcare options. The EUROLAB childcare extension uses EUROMOD to construct the counterfactual choices of labour supply alternatives (zero working hours, part-time, and full-time) and childcare options (public, private, informal, mother) and derive the corresponding budget sets. EUROMOD is extended with information on childcare fees for subsidised and unsubsidised childcare services.
The empirical analysis (1) here follows four steps:
- Run EUROMOD and simulate the budget constraints for each counterfactual choice set;
- Estimate the parameters characterising women’s preferences for childcare and labour supply for each country;
- Draw on these parameters to simulate the effect on the labour supply of mothers of an increase in formal childcare availability, assuming that additional childcare slots are fully taken to achieve 45%, 50% and 55% participation targets, and keeping childcare fees per child unchanged;
- Use estimated coefficients assigned to childcare dummies to capture the availability of subsidised and unsubsidised childcare choices. These dummies are interpreted to reflect availability of childcare types not captured by the systematic part of the utility function. Based on this interpretation, the modified coefficient assigned to the public childcare dummy interacted with the dummy identifying children at the lower half of income distribution in order to increase the availability of formal childcare for these children according to the three participation targets – 45%, 50% and 55%.
- 1. See Narazani et al. (2022) for a detailed description of the empirical model and imputation method of childcare fees.
Table 3.3
Increasing ECEC participation significantly increases the labour market activity of mothers in low-income households
Effect of improving access to childcare services, Austria, Hungary, Italy
|
|
|
AT |
|
HU |
|
IT |
|||
|---|---|---|---|---|---|---|---|---|---|
|
Childcare slots participation target |
45% |
50% |
55% |
45% |
50% |
55% |
45% |
50% |
55% |
|
Change in participation rate (pp) |
17 |
21 |
25 |
10 |
12 |
13 |
5 |
9 |
12 |
|
Additional ECEC expenditure (% of GDP) |
-0.105 |
-0.127 |
-0.148 |
-0.135 |
-0.160 |
-0.186 |
-0.018 |
-0.033 |
-0.047 |
|
Net fiscal effect (% of GDP) |
-0.025 |
-0.030 |
-0.036 |
-0.015 |
-0.018 |
-0.021 |
-0.006 |
-0.010 |
-0.013 |
Note: Barcelona target of 45% participation in ECEC for children under three. The table also presents the impacts of higher targets of 50% and 55%. EUROLAB runs on the underlying simulation results from EUROMOD on the budget sets. This analysis relies on EU-SILC 2016, which contained an ad hoc module with information on the affordability of childcare services (needed to distinguish subsidised or free formal childcare from unsubsidised care).
Source: JRC simulations, based on EUROMOD version xxI5.0+ and EUROLAB model.
The budgetary costs of additional childcare placements required to reach the new target of formal childcare coverage are mitigated by the additional PIT and social security contributions from the increase in women’s participation in the labour market. The static budgetary costs of additional childcare placements range between 0.018% of GDP (Italy) and 0.135% (Hungary). Reaching a target of 55% of ECEC participation would require one-and-a-half or two times more investment (Table 3.3, second row). (322) However, these costs are mitigated by the government revenue generated by the increased employment of mothers. (323) The net budgetary effects – which also take into account the second-round budgetary impacts triggered by substantial increases in participation and working hours of mothers ‒ range from 0.006% of GDP (Italy) to 0.025% (Austria) and 0.015% (Hungary).
Notes
- 301. Other measures such as flexible working arrangements are outside the scope of this analysis but may have positive impacts on participation.
- 302. (Narazani et al., 2022); (International Labour Office , 2022); (Ferragina, 2020).
- 303. (Kleven, Landais and Søgaard, 2019).
- 304. (Hank and Kreyenfeld, 2003); (Del Boca, 2015).
- 305. (European Commission, 2022e); (Westhoff et al., 2022).
- 306. The Council Recommendation on early childhood education and care: the Barcelona targets for 2030 provide for exemptions for Member States that have not yet reached the 2002 target. Those Member States whose average participation in the period 2017-2021 was below 20% will have to increase by 90%, while Member States whose average participation was 20-33% will have to increase by 45%, with a limit of 45%.
- 307. The policies for very young children (<1 year old) are outside the scope of the OECD NCC indicator.
- 308. Four household types: low-income (20th percentile) and median-income single mothers (50th percentile), and low-income and median-income mothers in a couple, all employed and with two pre-school children aged two and three.
- 309. (European Commission, 2023d).
- 310. This section presents preliminary findings from an OECD analysis of geographical accessibility of essential services across EU regions.
- 311. Two types of ECEC institutions are considered: early childcare (typically attended by children between 0 and 3/4 years old) and pre-primary education or kindergarten (typically attended by children between 3/4 and 5/6 years old).
- 312. Analysis at the level of small (TL3) regions, which are consistent with the Nomenclature of Territorial Units for Statistics (NUTS) 3 classification adopted by Eurostat.
- 313. For ECEC services: Belgium, Estonia, Finland, France, Greece and Spain (for Estonia, France, Greece and Spain, the data only include pre-primary (i.e. kindergarten) education facilities). For primary schools: Belgium, Czechia, Estonia, Finland, France, Greece, Ireland, Lithuania, Portugal and Spain.
- 314. This research is an outcome of a significant data collection effort drawing on various sources, including direct correspondence with national authorities and web scraping of information provided on public authority websites. Road networks from OpenStreetMap are used to determine the area reachable within a 15-minute and a 30-minute walk or drive from each service location point. These data are intersected with population data for each TL3 region from the Global Human Settlement population grid to give the population share within a 15-minute and a 30-minute walk or drive of a given service, for each TL3 region.
- 315. Analysis includes private and public institutions.
- 316. The OECD metropolitan/non-metropolitan typology for TL3 regions controls for the presence or absence of metropolitan areas and the extent to which the latter are accessible by the population living in each region. According to such typology, small regions are classified as metropolitan if more than half of their population lives in a functional urban area (FUA) of at least 250 000 inhabitants, and as non-metropolitan otherwise. Non-metropolitan regions are further distinguished into three types based on the size of the FUA that is most accessible to the regional population: i) near a midsize/large FUA if more than half of the population lives within a 60-minute drive from a midsize/large FUA (more than 250 000 inhabitants) or if the TL3 region contains more than 80% of the area of a midsize/large FUA; ii) near a small FUA if that region does not have access to a midsize/large FUA and at least half of its population has access to a small FUA (50 000- 250 000 inhabitants) within a 60-minute drive, or contains 80% of the area of a small FUA; and iii) remote, otherwise.
- 317. 5-9 year olds for primary schools; 0-4 year olds for ECEC.
- 318. (European Commission, 2022e).
- 319. Exemptions for Member States that have not yet reached the 2002 target: those whose average participation in the period 2017-2021 was below 20% will have to increase by 90%, while those whose average participation was 20-33% will have to increase by 45%, with a limit of 45%.
- 320. The participation rate of the target population of mothers in low-income families is 43.5% in Italy, compared to 30.2% in Austria and 20.7% in Hungary. Given the exemptions (Member States whose average participation in the period 2017-2021 is below 20% will have to increase it by 90%; and those whose average participation in the same period is between 20 and 33% will have to increase by 45% with a limit to 45%; see footnote (255)), neither Austria nor Hungary will have to reach the 45% target by 2030. Based on the Recommendation, the two countries will have to increase ECEC participation by 45%, i.e. to the level of 43.8% for Austria and 30% for Hungary. The simulations in this section assess the effect of reaching the ultimate goal of 45% for all three countries.
- 321. These estimated labour supply effects represent changes in the desired number of working hours or activity/inactivity status and disregard the demand side of the labour market or the possibility of a mismatch between desired labour supply and available jobs. When the demand side and labour market frictions are considered, final employment and the corresponding tax revenue effects should be somewhat lower.
- 322. Calculations based on 2016 Eurostat statistics on public expenditure on early education per pupil/student: EUR 7 267 for Austria, EUR 2 832 for Hungary, and EUR 4 775 for Italy. The total budgetary cost of the reform is calculated as the expenditure per pupil/student times the number of children affected for each country. The estimates are presented in Table 3.3 as a percentage of GDP, for easier comparability with other reforms.
- 323. Additional budgetary revenues could be generated from employing additional childcare personnel to reach the simulated formal childcare targets, and additional indirect tax revenues stemming from the increased consumption. These are not taken into account here.