
4. Social Situation, Poverty, and Income Developments
4.3. Risk of poverty and social exclusion
The AROPE rate remained relatively stable in 2022. The AROPE rate in the EU was 21.6% in 2022, similar to the two previous years (21.7% in 2021, 21.6% in 2020) (Chart 1.18). (78) This stability also confirms the crucial role of social protection and social inclusion policies in ensuring socioeconomic resilience to shocks, including in the context of Russia’s war of aggression against Ukraine. The AROPE rate was particularly high for young adults aged 18-24 years (26.5%) and for children (24.7%). (79) The EU 2030 Porto target foresees lifting 15 million people out of poverty or social exclusion, including five million children (compared to the 2019 baseline of 92.2 million). With the AROPE rate remaining stable compared to 2021, an estimated 95.3 million EU citizens experienced poverty or social exclusion in 2022, 19.9 million of whom were children under 18 years old. This implies a slight decrease (279 000) on 2021, when 95.5 million people were considered at risk of poverty or social exclusion, 19.6 million of whom were children. (80) In line with the trend in previous years, the share of people at risk of poverty or social exclusion in 2022 was slightly higher for women (22.7%) than for men (20.4%). People with a disability are also at a higher risk of poverty or social exclusion (28.9%), compared to people with no such limitations (18.3%). (81)
Chart 1.18
Risk of poverty or social exclusion continued to decline until 2019 and has remained stable in 2022, as compared to the previous year.
At risk of poverty or social exclusion rate (AROPE), at risk of poverty rate (AROP), severe material and social deprivation rate (SMSD) (% of population), very low work intensity households (% of population aged 0-64), EU, 2015-2022.
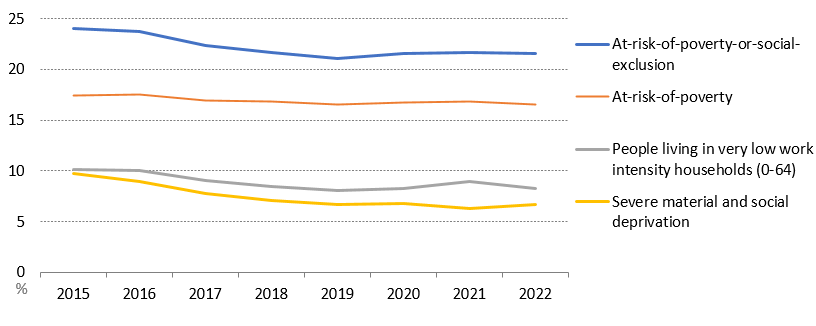
Note: The year refers to the EU-SILC survey year; income measured is from the previous year. AROPE, AROP: income from the previous year, SMSD: current year. VLWI: status in the past year. Values for AROP between 2015-2018 are estimated. For AROPE and AROP there is a break in time series in 2020.
Source: Eurostat, EU SILC [ILC_PEPS01] [ILC_LI02] [TEPSR_LM430] [TEPSR_LM420].
The AROP rate decreased slightly in 2022 (2021 incomes). When the AROPE rate is broken down into its three components (AROP, severe material and social deprivation (SMSD) rate, share of persons living in quasi-jobless households), (82) the AROP rate decreased slightly to 16.5% in 2022 (2021 incomes), compared to 16.8% in 2021, representing 73.8 million people in the EU. (83) Eurostat flash estimates indicate that the AROP rate remained stable for 2022 incomes, including for children, compared to the previous year. However, this income indicator does not directly capture declines in household purchasing power resulting from inflation pressures (Box 1.1). Given the current inflation crisis, it is important to continuously monitor the evolution of household incomes in real terms, with real GDHI negatively impacted in 2022 (see section 4.1.). Additional Eurostat flash estimates deflating the estimated changes on incomes (using HICP) in 2022 also show the negative impact of the rising cost of living. (84)
The proportion of the population living in severe material and social deprivation increased from 6.3% in 2021 to 6.7% in 2022. (85) This reflects declines in the purchasing power of households and contrasts with the downward trend of previous years. Over the longer term, the number of people living in severe material and social deprivation decreased to 28.7 million people in 2022, from 40.9 million people in 2015 at EU level. (86) Additionally, the share of people living in quasi-jobless households decreased slightly in 2022 (reference year 2021) to 8.3%, compared to 9% in 2021 (reference year 2020), following an earlier increase in the context of the onset of the COVID-19 pandemic. (87)
The AROPE rate shows considerable variability across educational attainment levels. (88) Education and training are important for accessing employment opportunities and for achieving higher earnings. For those with lower levels of education, the AROPE rate was 34.5% in 2022 at EU level, substantially higher than the rate among people with medium (19.8%) and higher (10.5%) levels of education. This trend persists across countries and over time, with those with lower education levels consistently at higher risk of poverty or social exclusion. The difference between those with lower levels of education and those with higher levels of education is particularly pronounced (more than 30 pp) in Bulgaria, Romania, and Latvia (Chart 1.19). However, the share of persons at risk of poverty or social exclusion has been decreasing across persons with different levels of education since 2015. (89)
Box 1.1: Data on indicators of income inequality and poverty: some caveats
The indicators on economic strain, income inequality and poverty (see sections 4.1., 4.2., and 4.3.) present new evidence on general trends in recent years compared to previous European Commission publications, based on EU-SILC 2022 data and Eurostat flash estimates.
Indicators should be interpreted with caution, in the context of rising consumer prices presenting new economic and social challenges across the EU. While measuring the inflation effects on living costs and purchasing power is comparatively straightforward, assessing the subsequent consequences on poverty and social exclusion is more complex
The AROP rate is based on a relative threshold of 60% of the national median (equivalised) income after social transfers, and thus does not capture purchasing power considerations. By focusing on low income in comparison with other residents (i.e. relative risk of poverty), it does not automatically capture the effect of risingprices on households, as it does not take into account living costs and consumption. On the other hand, one of the three components of the AROPE rate, SMSD, is responsive to losses in households’ purchasing power, as it distinguishes between individuals who cannot afford a certain good, service, or social activity.(1)
Several indicators of inequality and risk of poverty are the result of model simulations and should be interpreted with caution. Official statistics (i.e. not based on simulations) are necessarily published with a delay. In fact, for any given reference year t, data are released at t+1 (e.g. for EU SILC 2022, the release was in June 2023), while these indicators refer to the latest available completed year (t-1, i.e. 2021 for EU SILC 2022).
In the absence of recent official statistics on distributional indicators, due to the necessary time lag for their production after data collection, sources of a more experimental nature were used in the analysis. This includes the following simulations:
-
Eurostat flash estimates:
- Income quintile share ratio S80/S20 referring to 2022 income year for disposable income (income share of the top 20% compared to the bottom 20%).
- AROP rate referring to 2022 income year.
Flash estimates are produced by Eurostat to have early indicative results for use in the EU’s policy agenda. These simulations imply the use of models that allow the estimation of the entire distribution and capture the complex interaction between labour market developments, the effects of economic and monetary policies and the implementation of social reforms.
These simulations imply the use of models that allow the estimation of the entire distribution and capture the complex interaction between labour market developments, the effects of economic and monetary policies and the implementation of social reforms. compared to the previous year, with those deflated values measuring the change over time in the prices of consumer goods and services as an average across all households.
- 1. (Menyhert, 2022)
Social transfers play an important role in reducing poverty. The AROPE rate did not experience a more substantial increase, including during the COVID-19 pandemic, partly due to the mitigating impact of social protection systems and measures taken by the Member States, with EU support. In 2022 (2021 incomes), social transfers reduced poverty by 35.3% on average in the EU. Overall, the impact of social transfers on poverty reduction remained broadly stable since 2015, but rose to unprecedented levels in 2021 (2020 incomes) (37.1%) and remained elevated in 2022 (2021 incomes). (90)
Chart 1.19
Higher AROPE rate for people with lower levels of education, across all countries
AROPE rate, by level of education, 2022, EU

Note: Provisional data for France, Cyprus, and Luxembourg.
Source: Eurostat, EU-SILC [ilc_peps04n].
Continuing a general trend, people with lower education levels face higher risks of in-work poverty, highlighting the importance of education and skills development. While in-work poverty remained broadly stable in 2020 (8.8%) and 2021 (8.9%), following a decline between 2016 and 2020, it decreased further to 8.5% in 2022 (2021 incomes). (91) Yet, in-work poverty risks were persistently higher for those with lower levels of education, at 18.4% in 2022, compared to those with medium (8.7%) and higher (4.1%) levels of education. (92) While in-work AROP rates have remained broadly stable for those with higher levels of education, the risks for those with lower levels of education overall decreased slightly between 2016 and 2020 (Chart 1.20).
Chart 1.20
Higher in-work AROP rates for those with lower levels of education
Differences in in-work AROP rates across educational levels, 2013-2022, EU

Note: Values estimated from 2013-2019, with a break in time series in 2020.
Source: Eurostat, EU-SILC [ILC_IW04].
Those employed part-time and on temporary contracts face higher levels of in-work poverty. In 2022 (2021 incomes), those working part-time experienced higher levels of in-work poverty (13.5%) than those working full-time (7.1%). (93) Similarly, the AROP rate was higher for those in temporary employment than those on permanent contracts, at 12.2% and 5.2% respectively. (94) In-work poverty was also significantly higher among non-EU born (19.4%), than native (7.5%) workers. (95)
Notes
- 78. AROPE rate corresponds to the sum of persons who are either at risk of poverty (2021 incomes), or severely materially and socially deprived (2022) or living in a household with a very low work intensity (2021). People are included only once, even if they are in more than one of these situations. [ILC_PEPS01N].
- 79. Children are defined as less than 18 years old.
- 80. [ILC_PEPS01N]. To note, previously part of the difference in levels reflected the change in data collection methods in Germany between 2019 and 2020, which affected the EU average, but not the direction of change, from 2020 to 2021.
- 81. [ILC_PEES01N]. For a population aged 16+, for persons with some or severe level of activity limitation, compared to those with none.
- 82. AROPE’s three components are: at-risk-of poverty, total population (AROP 0+), severe material and social deprivation, total population (SMSD 0+) and share of people living in households with very low work intensity (quasi-jobless households), age 0-64 (VLWI 0-64).
- 83. [TESSI010] The share of persons with an equivalised disposable income below the risk-of-poverty threshold, which is set at 60% of the national median equivalised disposable income (after social transfers).
- 84. Eurostat flash estimates use the HICP to deflate the estimated changes in income deciles. Deflated values HICP measures the change over time in the prices of consumer goods and services as an average across all households.
- 85. Official SMSD data available for 2022 incomes.
- 86. [ILC_MDSD11] SMSD rate is the proportion of the population experiencing an enforced lack of at least seven of 13 deprivation items. Items at household level: i) Capacity to face unexpected expenses; ii) Capacity to afford paying for one week annual holiday away from home; iii) Capacity to be confronted with payment arrears (on mortgage or rental payments, utility bills, hire purchase instalments or other loan payments); iv) Capacity to afford a meal with meat, chicken, fish or vegetarian equivalent every second day; v) Ability to keep home adequately; vi) Having access to a car/van for personal use; vii) Replacing worn-out furniture. Items at individual level: viii) Having internet connection; ix) Replacing worn-out clothes with new ones; x) Having two pairs of properly fitting shoes (including a pair of all-weather shoes); xi) Spending a small amount of money each week on themselves; xii) Having regular leisure activities; xiii) Getting together with friends/family for a drink/meal at least once a month.
- 87. [ILC_LVHL11N]. Persons living in household with very low work intensity, by age and sex (0-64 years).
- 88. [ILC_PEPS04N] For those aged 18 and over. Lower levels of education are classified as less than primary, primary, and lower secondary education (ISCED levels 0-2). Medium levels of education are classified as upper secondary and post-secondary non-tertiary education (ISCED levels 3 and 4). Higher levels of education are classified as tertiary education (ISCED levels 5-8).
- 89. Data available from 2015 onwards, broken down by ISCED levels. The largest decrease in pp between 2015-2022 is observed for those households with upper secondary and post-secondary non-tertiary education (ISCED levels 3 and 4).
- 90. [TESPM050].
- 91. [ILC_IW01]. 18-64 years.
- 92. [ILC_IW04].
- 93. [ILC_IW07].
- 94. [ILC_IW05].
- 95. [ILC_IW15]. For those aged 18 years or over.