
3. Labour Market Developments
3.4. Labour shortages
The job vacancy rate (46) spiked in 2022, as companies found it increasingly difficult to fill their vacancies in the wake of the COVID-19 pandemic. This labour shortage indicator rose steadily after the financial crisis, from 1.2% in 2012 to 2.2% in 2019. It declined briefly during the COVID-19 pandemic, to 1.7% in 2020, then spiked to 2.3% in 2021 and 2.9% in 2022 – the highest value ever recorded. (47) This substantial rise subsided in the second half of 2022, with the job vacancy rate stabilising at 2.9% in Q4. The highest rates were observed in the Netherlands (4.9%), Belgium, Austria (4.8% for both) and Czechia (4.7%), with the lowest in Romania, Bulgaria, and Spain (0.9% for all three) (Chart 1.11). (48) At sectoral level, the highest job vacancy rates were observed in the EU in administrative and support service activities (4.7%), accommodation and food service activities (4.2%), information and communication (4.1%), and construction (4.0%), with relatively lower rates for electricity, gas, steam and air conditioning supply (1.7%), financial and insurance activities (2.0%) and manufacturing (2.3%). Some of these sectors (e.g. construction) are central to the green and digital transitions, and alleviating the high number of job vacancies will help to remove bottlenecks and smooth this process (see Chapter 2).
Chart 1.11
Job vacancies rose sharply in 2022
Job vacancy rates (% of vacancies and occupied posts)
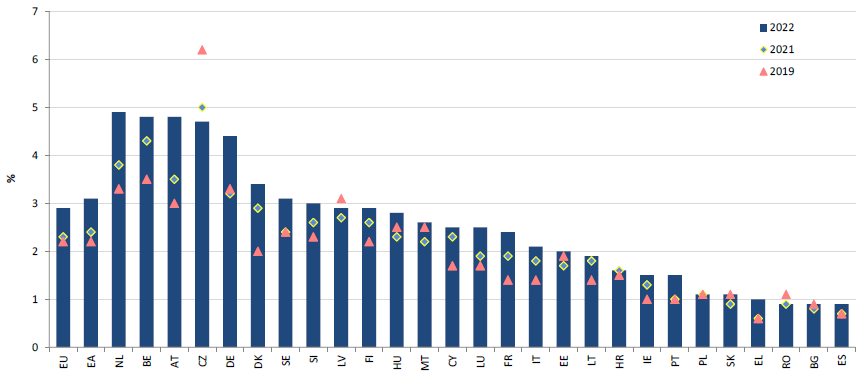
Source: Eurostat [jvs_a_rate_r2].
The Beveridge curves (49) show labour shortages increasing in all sectors of the economy, together with a decline in unemployment. Using data on labour shortages from the European Commission’s Business and Consumer Survey (BCS) (50) as a proxy for job vacancies, the Beveridge curves for the industry, services, and construction sectors display similar behaviour. From 2012 (after the financial crisis) to 2019, unemployment decreased consistently in a period of steady economic growth, while shortages increased steadily to very high levels. This rise stopped in 2020, as the economy was hit strongly by the COVID-19 pandemic, leaving companies facing major challenges and less able to hire new workers. At the same time, the increase in unemployment was limited by job retention measures, such as short-time work schemes. As the economy reopened in 2021, unemployment declined, labour shortages began to increase, and the curves returned to a similar position as in 2019. In 2022, labour shortages skyrocketed, while unemployment fell to historically low levels. The combination of a rise in vacancies and decline in unemployment suggests that the efficiency of labour market matching has not deteriorated in recent years. (51) The increase in labour shortages in 2022 was pronounced in the services sector (+12.7 pp, to 31.2%), with the highest rates observed in the construction sector (32.8%, +7.2 pp from 2021) and a similarly high rate in industry (28.3%, +9.9 pp from 2021) (Chart 1.12).
High and persistent levels of labour shortages show underlying structural drivers. These long-term elements interact with cyclical factors – with lower unemployment the labour market becomes increasingly tight, and companies have more difficulties in finding people to hire. (52) Labour shortages and the underlying structural factors are discussed in depth in Chapters 2 and 3.
Chart 1.12
Labour shortages skyrocketed across the whole economy in 2022
Beveridge curves (labour shortage indicators on Y axis and unemployment rates on X axis)
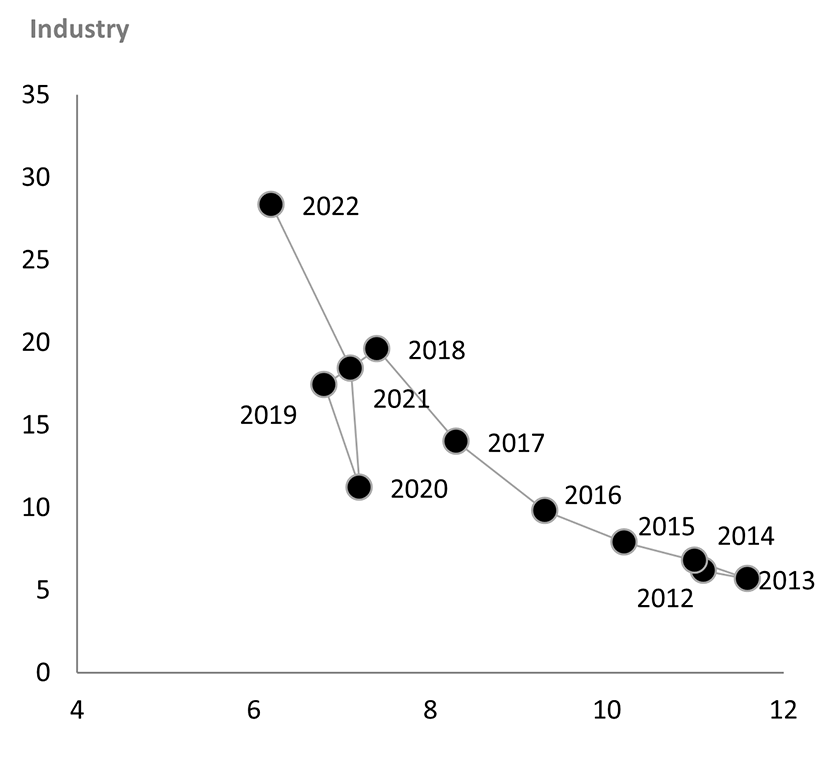
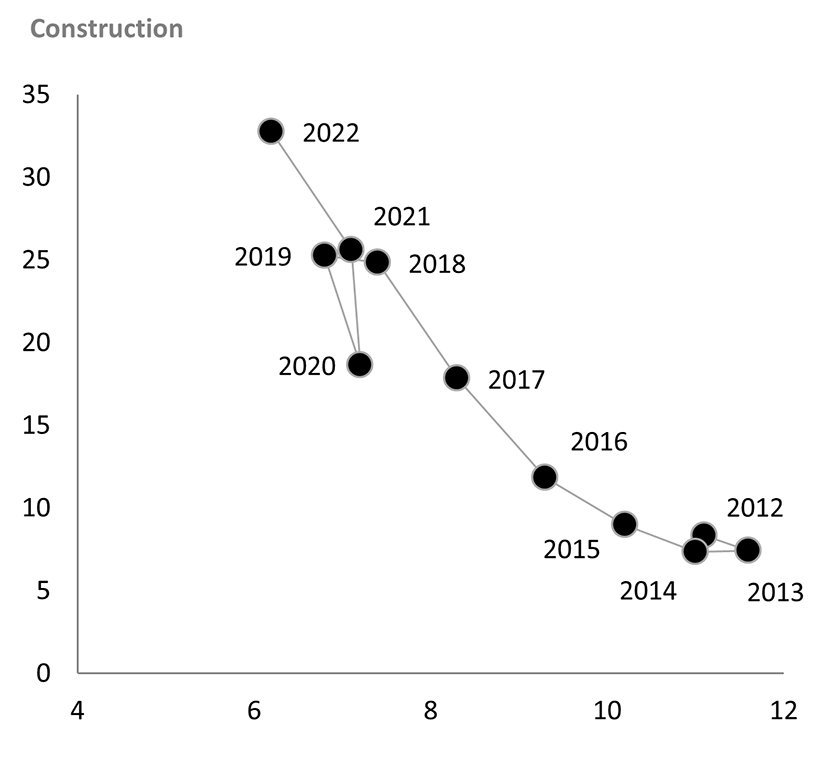
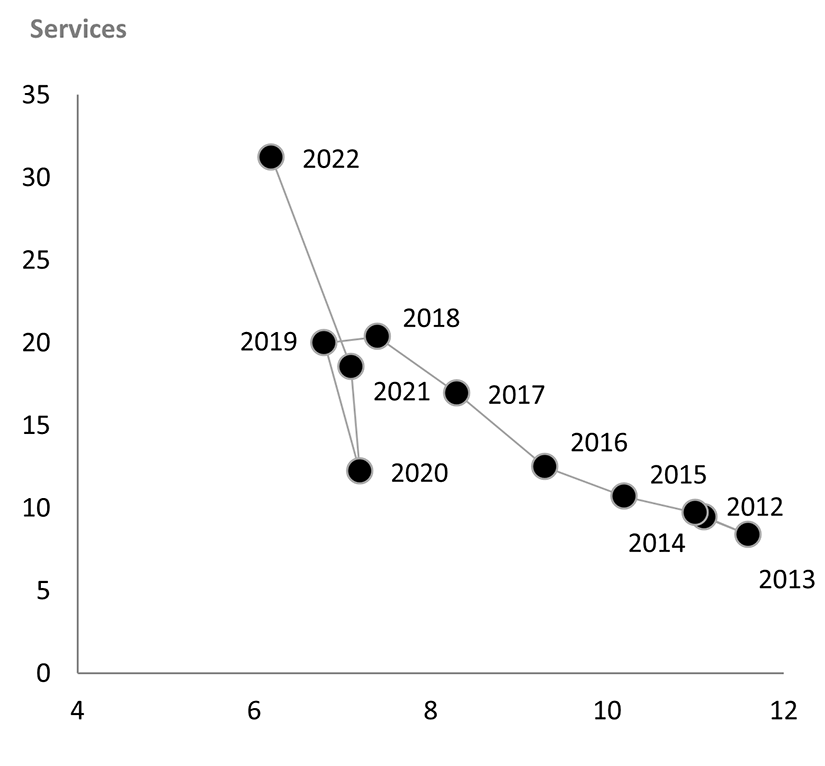
Note: Annual figures for the labour shortage indicators (Y axis) are calculated as annual averages of quarterly data (industry and services) or monthly data (construction).
Source: Eurostat [ei_bsin_q_r2 ; ei_bsbu_m_r2 ; ei_bsse_q_r2 ; une_rt_a].
Notes
- 46. The job vacancy rate measures the gap between the number of job vacancies and the sum of the vacancies and occupied posts.
- 47. Eurostat series for job vacancy statistics started in 2008.
- 48. Provisional data for the Netherlands, Spain, and Bulgaria.
- 49. Beveridge curves plot unemployment rates with job vacancy indicators to assess the efficiency of labour market matching (the process linking job vacancies to unemployed people).
- 50. Measures the share of firms reporting that the availability of labour is a factor limiting production.
- 51. (European Commission, 2022g), pp. 84-85.
- 52. (European Commission, 2022g).