
3. Selected types of social investment
This section examines how selected types of social investment can support individuals and contribute to social convergence and growth in the EU. This chapter considers as social investment those investments and reforms that, on top of pursuing social objectives and therefore fostering upward social convergence, have substantial positive returns on economic growth through their impact on human capital and productivity, including via stronger innovative capacity and absorption of new technologies, and/or labour supply in line with the considerations on the definition of social investment discussed in Section 1. (130)It provides in-depth analysis and new evidence of how investment in education, including ECEC, skills and ALMPs, can support individuals over their life course and contribute to upward social convergence and growth in the EU.
3.1 Investing in ECEC
Investment in high-quality ECEC leverages long-term upward convergence in a range of socioeconomic outcomes. Participating in ECEC helps children to develop key cognitive, language and physical skills early in life, boosting their employment prospects and reducing their likelihood of facing poverty risks. (131)It also enables parents of young children, particularly mothers, to work, contributing to higher employment rates among women and potentially reducing child poverty, as well as addressing labour shortages.
ECEC participation reduces socioeconomic inequalities from very early ages. Evidence shows that when children from disadvantaged backgrounds participate in high-quality ECEC it has particularly beneficial effects on cognitive skills and school readiness, improving their educational attainment. (132) This makes equal access to good quality ECEC central to securing equal opportunities for children in disadvantaged situations, reducing social exclusion and improving intergenerational social mobility. Recent estimates show that across most Member States, adults who faced socioeconomic disadvantage in their childhood are, on average, between 3 pp and 6 pp less likely to be in employment and have 20% lower earnings than those from more privileged backgrounds. A large part of this effect is linked to the fact that socioeconomic disadvantage in childhood tends to translate into lower levels of education, health, and lifetime work experience. The total economic cost of childhood disadvantage (133) is estimated at 3.4% of GDP in the EU, ranging from 1.4% of GDP in Finland to 6.1% of GDP in Lithuania. (134)
Women’s participation in the labour market can be enhanced through more comprehensive provision of ECEC. (135) Recent estimates in eight Member States show that increasing participation of under-3s in ECEC to 50% could improve mothers’ labour participation rates by between 5% and 30%. (136) Further analysis shows that the effect on labour market participation could be particularly positive for mothers from low-income families (9 pp to 21 pp increase, depending on the country), potentially helping to reduce poverty risks for the children in those households. (137)Such increases in women’s labour market participation could help to halve the gender gap in employment by 2030, in line with the commitment outlined in the European Pillar of Social Rights Action Plan as part of the efforts to reach the EU 2030 headline employment target. This would help to generate sizeable long-term improvements in economic performance at EU level (see Chapter 2, Section 4).
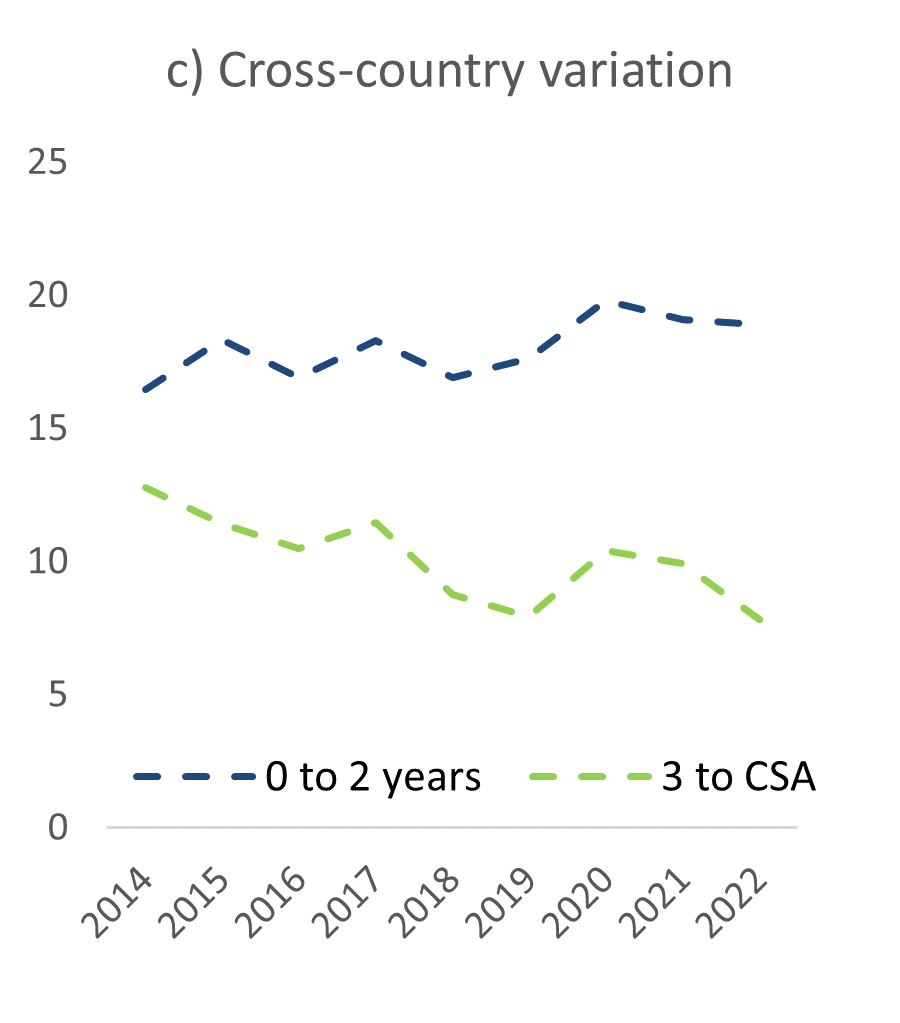
Public expenditure on ECEC has increased slightly in the EU since 2012, with variation between countries showing a slight decline.For the 15 Member States with data consistently available over time, (138)ECEC public expenditure per pupil (measured as share of national GDP per capita) increased from 18.9% in 2012 to 20.5% in 2019 (Chart 3.1). In 2019 (the last year for which data are available), the ECEC expenditure per pupil ranged from 12.2% of GDP per capita in Austria to 29.8% in Bulgaria. The variation in expenditure on ECEC between countries declined slightly over time, as evident in the downward sloping line of the standard deviation as a measure of cross-country variation (Chart 3.1). There may also be variations in ECEC quality across countries, but these are extremely difficult to assess with existing data. Box 3.2 presents the European Commission’s latest estimates of future investment needs in ECEC.
Chart 3.1
Mild growth in public expenditure on ECEC accompanied by signs of convergence across countries
Public expenditure on ECEC per pupil (% of national GDP per capita) and variation across countries (standard deviation), 15 Member States

Note: Reported average across countries is unweighted. Data not available consistently across the 2012-2019 period for: Belgium, Czechia, Denmark, Ireland, Greece, Croatia, Cyprus, Latvia, Hungary, Malta, Portugal, Romania.
Source: Eurostat dataset [educ_uoe_fine09].
Box 3.2: Future investment needs in Early Childhood Education and Care
Further investment is needed to increase children’s participation in ECEC to the Barcelona target levels at EU level, notably for the under-3s. Such investment would help to address several barriers to children’s access to ECEC, including the lack of available places and high access costs. For example, by creating new ECEC places, training, hiring and paying new staff, or refurbishing existing/building new facilities, while ensuring accessibility and affordability.
Additional yearly spending on ECEC needed to reach the EU Barcelona Targets by 2030 would amount to 0.085% of EU GDP (more than EUR 11 billion) according to recent estimates. (1) This amount varies by Member State, ranging from 0% (in Member States that have already reached the target) to nearly 0.3% in Greece and around 0.2% in Germany, Poland and Romania (Chart 1)
Chart 1
Additional investment needs in ECEC vary by Member State
Yearly additional investment in ECEC needed to meet the 2030 Barcelona targets (% of GDP), by Barcelona targets
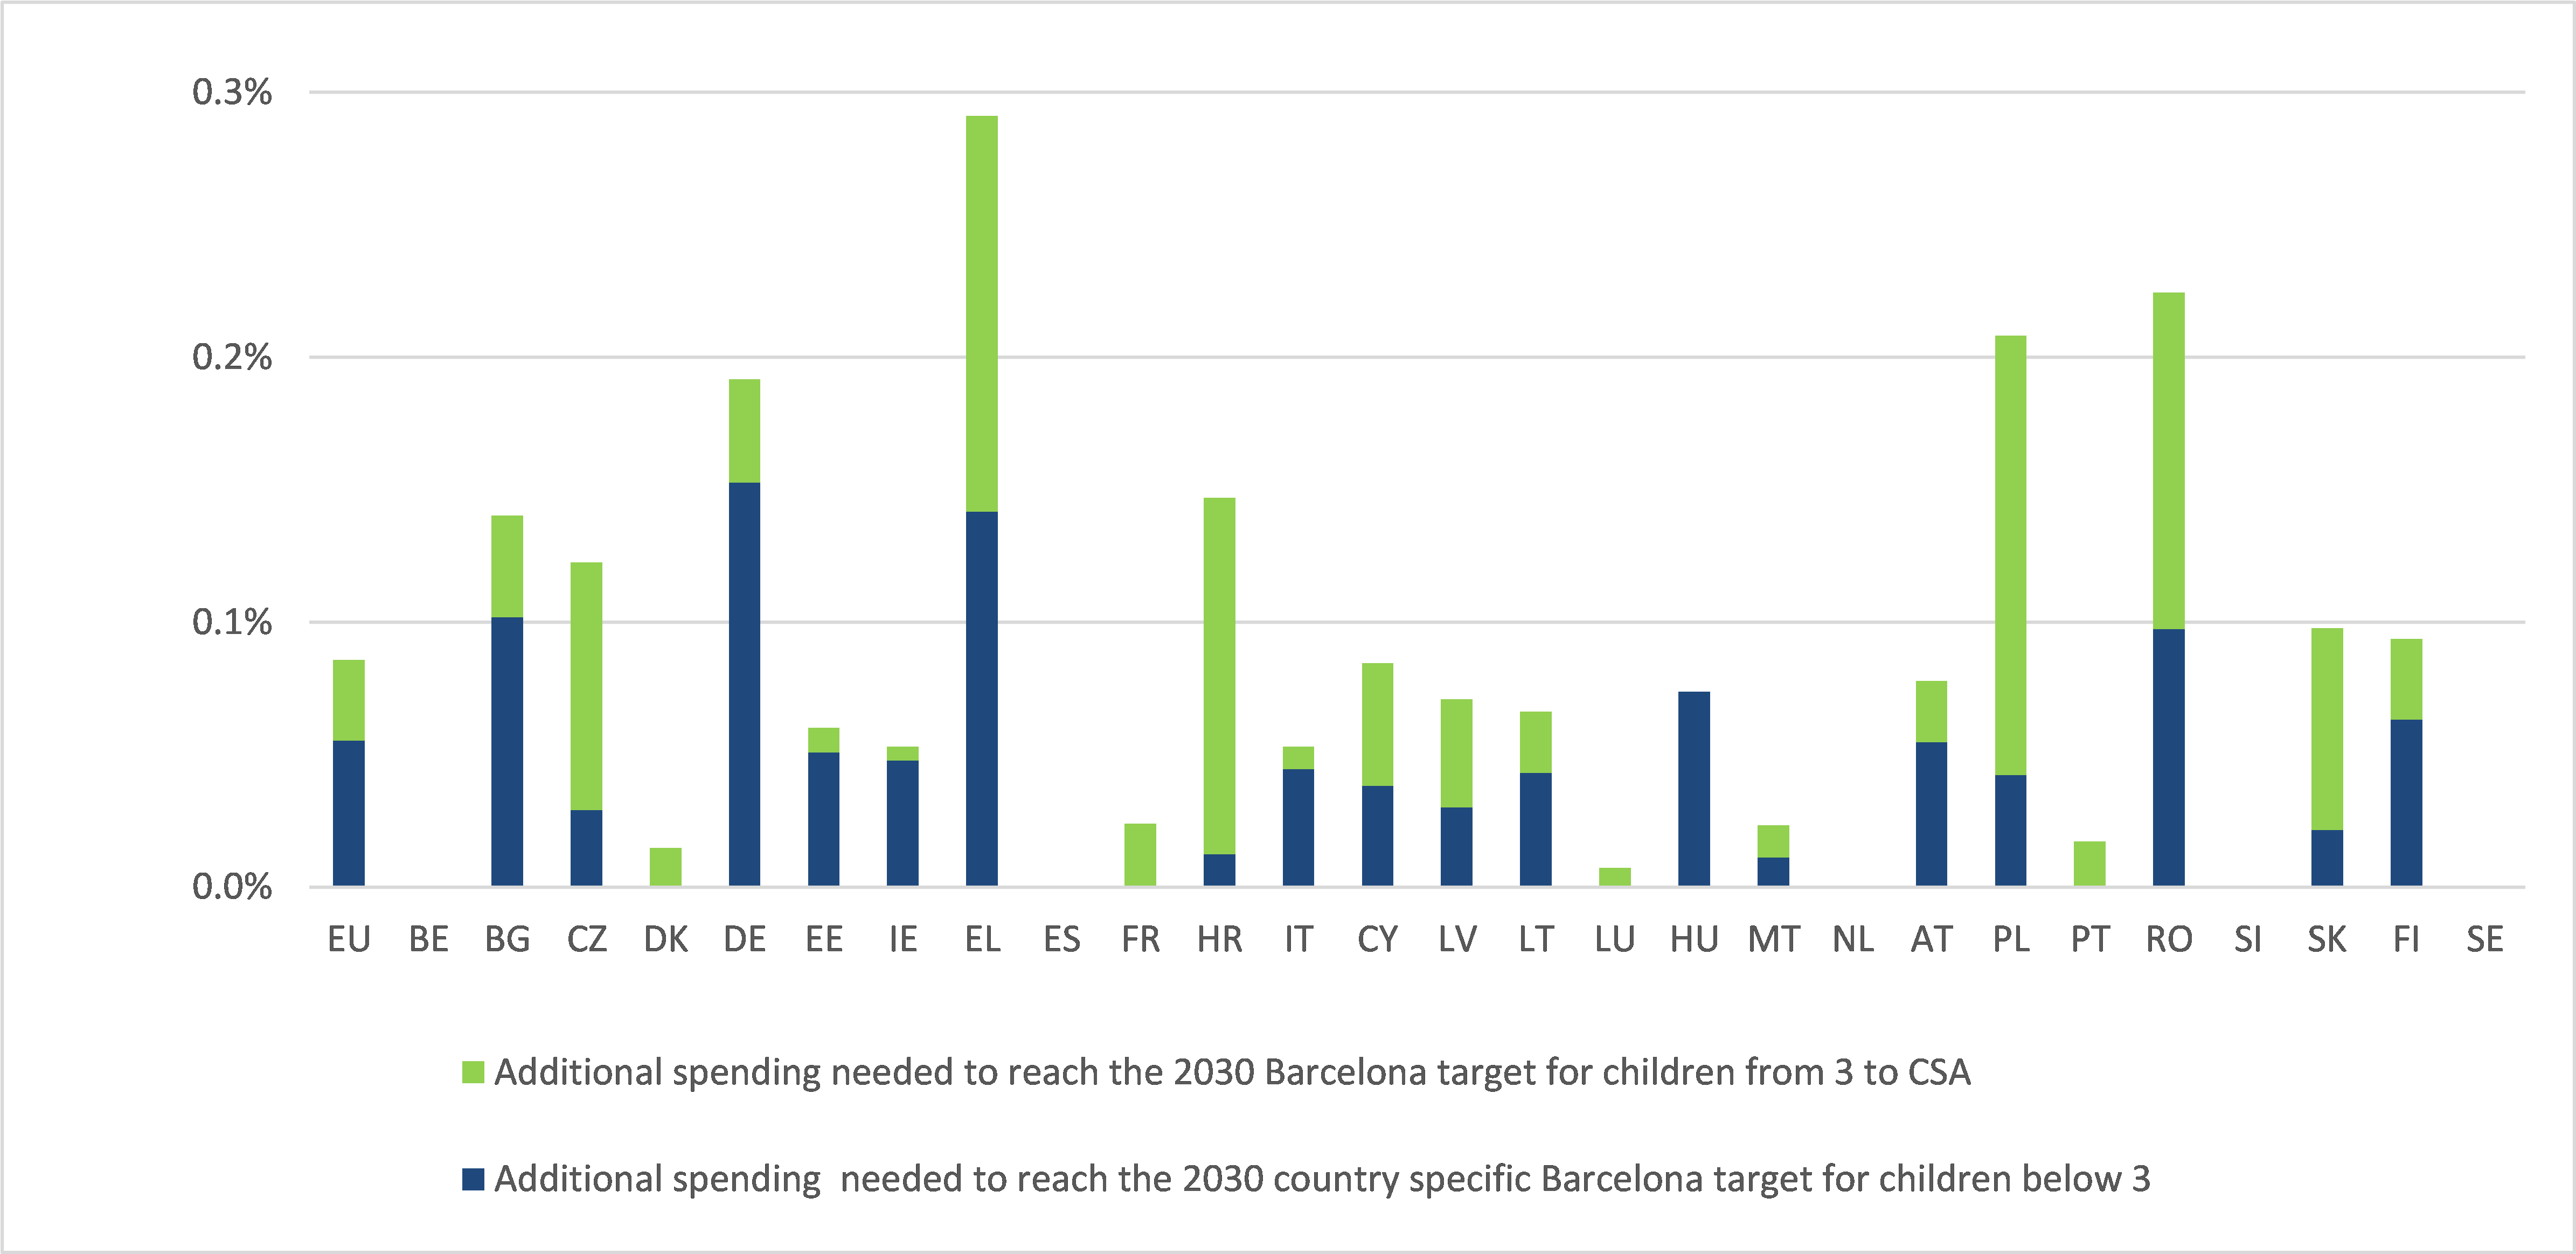
Source: DG EMPL calculations based on Eurostat data.
- 1. The additional investment need is estimated as follows. First, based on current participation rates (Eurostat ilc_caindformal dataset), the number of additional children who should be enrolled to meet the Barcelona targets is estimated. This number is then multiplied by the yearly average public expenditure on ECEC per participating child (Eurostat educ_uoe_fine09 dataset) to obtain the additional yearly spending needs to reach the Barcelona targets. It is assumed that the level of spending per participating child remains constant over the years.
A large majority of preschool age children participate in ECEC in the EU, with participation rates converging across Member States.(139) The share of children aged three to compulsory school age (CSA) participating in ECEC broadly stagnated, going from about 87% in 2014 to 89% in 2023 (Chart 3.2). The COVID-19 pandemic resulted in a temporary decline in participation and a spike in cross-country differences in 2020. In 2023, national participation rates still varied considerably. For example, participation was above the Barcelona target of 96% (140) in seven Member States (Belgium, Denmark, Spain, France, Hungary, the Netherlands, Sweden), but was less than 80% in three countries (Poland, Romania, Slovakia). Cross-country differences declined between 2014 and 2023, as countries with lower participation rates caught up with those with higher participation. (141)
While the average ECEC participation rate of the youngest children (0-2 years of age) rose over the last decade, disparities across Member States also increased. Over the last ten years, the share of children participating rose from about 28% in 2014 to 37% in 2023, with a short lapse during the 2020 closures due to the COVID-19 pandemic and an increase by 1.5 pp in 2023 compared to the previous year (Chart 3.2). To date, ten Member States (142) have reached the revised Barcelona participation target of 45% for this age group set at EU level, (143) while six countries recorded participation rates lower than 20% in 2022. (144) In the remaining Member States, between 20% and 45% of children participated in ECEC. The overall level of disparity between countries grew somewhat since 2014, despite evidence that some Member States with low participation rates caught up with others. (145)
Chart 3.2
Growing ECEC participation accompanied by convergence in attending preschool education
Proportion of children participating in ECEC, by age group and variation across countries, 2014-2022, EU-27
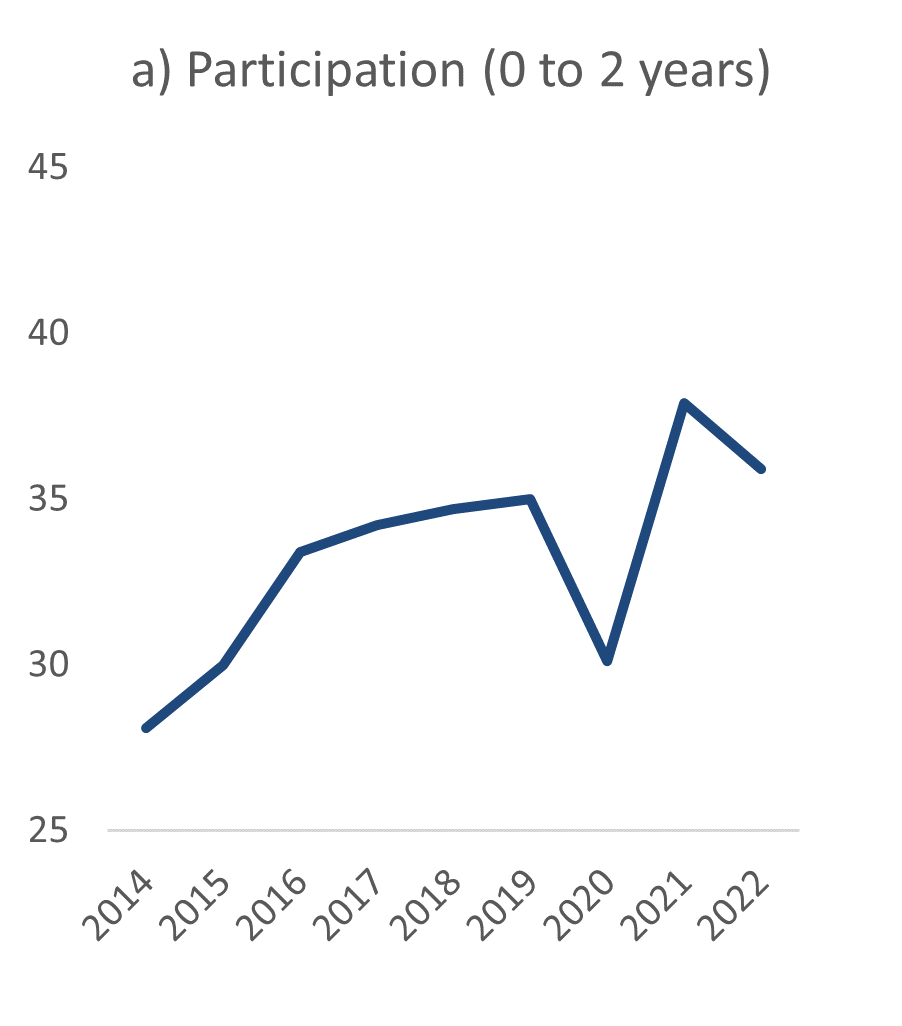

Note: Data missing for Italy in 2020.
Source: DG EMPL calculations based on EU-SILC data [datasets ilc_caindformal (for 2014) and ilc_caindform25 (from 2015 onwards)].
Young children from disadvantaged backgrounds are less likely to participate in ECEC, especially in some Member States.(146)In 2022, children facing different types of disadvantage (monetary poverty, material deprivation, low work intensity) had participation rates at least 10 pp lower than those from non-disadvantaged backgrounds, regardless of the type of disadvantage (Chart 3.3)(147) However, this gap varied between Member States, with children at risk of poverty or social exclusion participating considerably less often (by more than 20 pp) in some Member States, (148) and at a similar rate or more often than those not at risk in others. (149) On average across all Member States, children who can benefit most from attending ECEC tend to participate least. (150)
Chart 3.3
Children from disadvantaged backgrounds participate less in ECEC
Proportion of children aged 0 to 2 participating in ECEC, by population group (% of all children in the group), 2022, EU-27

Source: DG EMPL calculations based on EU-SILC microdata.
Notes
- 130.See technical note from the Belgian Presidency of the Council of the European Union, 2024, on social investment for resilient economies, available here
- 131.(OECD, 2021).
- 132.(European Commission, 2022d); (OECD, 2021).
- 133.These costs are composed of labour market penalties (costs of lost employment and individual earnings losses) and the health-related costs stemming from the individual’s loss of quality-adjusted life years.
- 134.(OECD, 2022).
- 135.(EIGE, 2020).
- 136.(Narazni et al., 2023).
- 137.(European Commission, 2023b).
- 138.Eurostat data are only available for the 2012-2019 period. Data are missing for several Member States for start/end year and those Member States are excluded from the analysis. Denmark and Malta are missing data for some intermediate years and are also excluded.
- 139.(Eurofound, 2024a).
- 140.Note that the Barcelona target for this age group (3+) is based on UOE data (educ_uoe_enra21) and not on data from EU-SILC survey.
- 141.Standard deviation dropped from 5.3 to 4.7. Beta coefficient is negative (-0.07) and statistically significant at 1% significance level.
- 142.Belgium, Denmark, Spain, France, Luxembourg, Malta, the Netherlands, Portugal, Slovenia, Sweden.
- 143.Specific targets apply to Member States that have not reached the 2002 Barcelona target of 33% participation for this age group.
- 144.Bulgaria, Czechia, Lithuania, Poland, Romania, Slovakia.
- 145.Beta coefficient is negative (-0.03) and statistically significant at 10% significance level.
- 146.(Employment Committee and Social Protection Committee, 2023).
- 147.Data for 2023 was not available at the time of writing. For analysis of earlier periods, see (European Commission, 2019b).
- 148.Belgium, France, Italy, the Netherlands, Spain.
- 149.Bulgaria, Denmark, Croatia, Hungary, Austria, Romania.
- 150.Convergence analysis cannot be carried out due to data limitations.