
3. Labour market developments
3.6. Public expenditure on labour market policies and social protection
In the years following the COVID-19 pandemic, total public expenditure remained sustained and then slowly returned to pre-pandemic levels. Overall, in both nominal terms and as a share of GDP, government expenditure increased in 2020 and remained at high, albeit declining, levels in 2021 in response to the economic and social challenges of the pandemic (Chart 1.13, left chart). In 2022, total public expenditure as a share of GDP returned to similar levels to 2012. The areas of public expenditure that experienced the strongest growth during the first year of COVID-19 pandemic were spending on social protection (+2.6pp between 2019 and 2020, to 21.9% of GDP) and economic affairs (35) (including many COVID-19 pandemic-related measures; +1.7 pp, to 6.1% of GDP), and health (+1.0 pp, to 8.0%).%), which reflects the measures put in place to mitigate the socio-economic effects of the crisis as well as the additional demand for healthcare, medical appliances and medicines. In 2022, public expenditure higher than in 2019 included economic affairs (+1.4pp, to 5.8% of GDP), health (+0.6pp, to 7.6%) and housing (+0.4pp, to 1%), while social protection spending as a share of GDP almost fully reverted to its pre-pandemic level (+0.1pp, to 19.4%), mainly reflecting positive developments in the labour market. (36)
Chart 1.13
During the COVID-19 pandemic, public expenditure peaked, in particular in social protection, health and economic affairs
Left chart: government expenditure on selected functions (% of GDP: total on right-hand side, individual items on left-hand side), 2012-2022, EU; Right chart: government expenditure (% of GDP), 2022
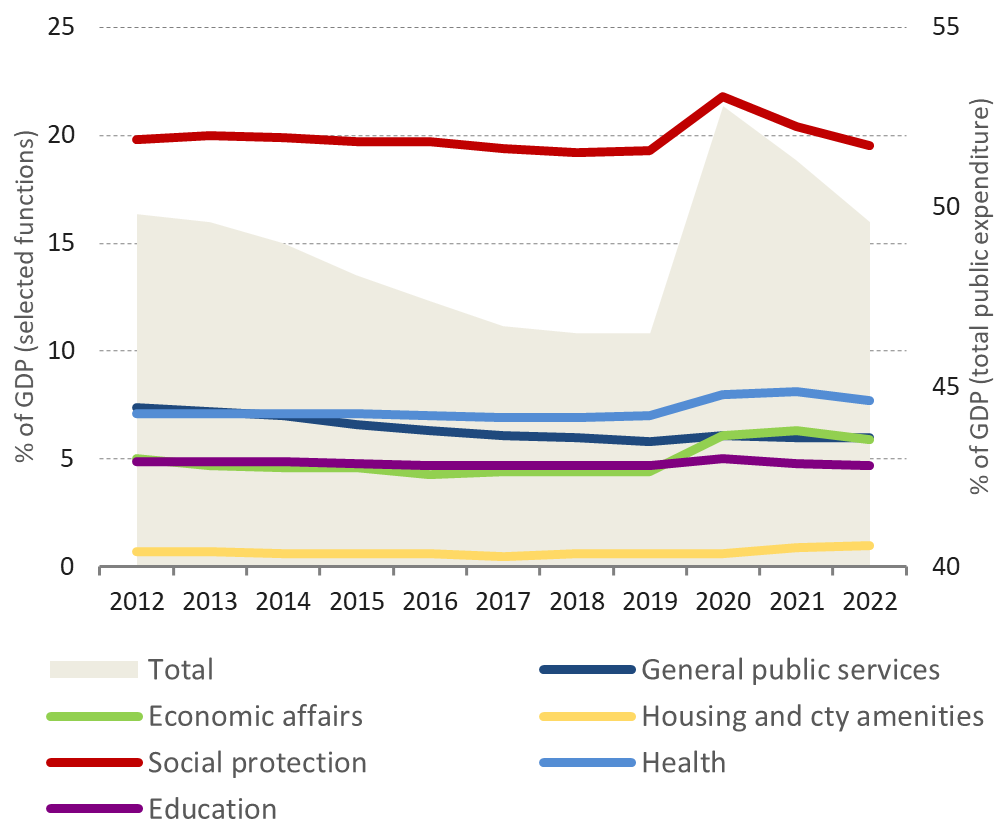
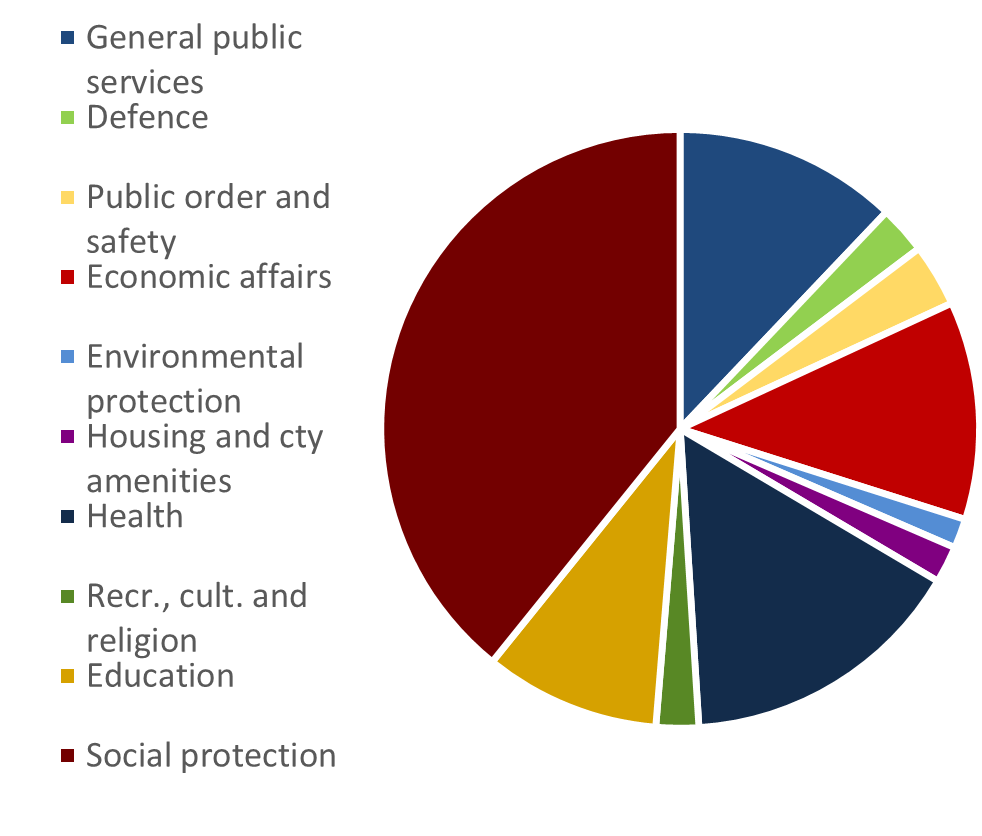
Source: Eurostat [gov_10a_exp].
Chart 1.14
Recent peak in public expenditure on labour market policies, notably for out-of-work maintenance and support
Public expenditure on labour market policies, total and by selected type of action, 2010-2021, EU

Note: Total labour market policy expenditure encompasses categories 1-9 in the database. 2021, DG EMPL calculations (Romania and Italy, pre COVID-19 pandemic expenditure (2019) when 2021 data are missing). Categories: 1 – Labour Market Services, 2 – Training, 3 – Job rotation and job sharing (not used anymore, included in category 4), 4 – Employment incentives, 5 – Supported employment and rehabilitation, 6 – Direct job creation, 7 – Start-up incentives, 8 – Out-of-work income maintenance and support, 9 – Early retirement. Cat 8 ‘Out-of-work income maintenance and support’ encompasses, among others, both unemployment benefits and short-term work schemes, including relevant COVID-19-related schemes.
Source: European Commission Labour Market Policy Database.
Public expenditure on labour market policies peaked recently, with the rollout of government programmes to support employment during the COVID-19 pandemic. Expenditure on labour market policies in the EU substantially increased in 2020 compared to earlier years, both in value (EUR millions) and as a share of GDP, reaching a record high of nearly 3% of GDP before decreasing to 2.3% in 2021 (Chart 1.14). Spending on employment incentives also increased, albeit from a much lower level. Participation in activation support peaked in 2020, reaching 46.3 out of 100 people wanting to work (compared to 33.5 out of 100 persons in 2019). Besides income maintenance and support, and spending on labour market services, expenditure on ALMPs focuses mostly on employment incentives and trainings for jobseekers. On a longer period, at the EU level, spending on employment incentives largely increased from 0.1% of GDP in 2010 to 0.2% of GDP in 2021. In contrast, training programmes have experienced a steady decrease in expenditure over the same period, but still make up a relatively sizeable proportion of the EU countries’ spending on ALMPs. For most of the 22 countries with available information, the level of total spending on ALMPs in 2022 returned to similar levels than before the COVID-19 pandemic. Chapter 3 presents more detailed analysis of expenditure on active labour market policies.(37)
In 2022, expenditure on social protection benefits increased in nominal terms, but decreased in real terms, and as a share of GDP, reflecting positive developments in the labour market. In 2020, social protection benefit expenditure increased by 7.5% in real terms and played a major role in cushioning initial COVID-19 pandemic-related employment losses (Chart 1.15). That year, benefits related to unemployment accounted for the largest share of the increase (+3.5 pp). The growth in social expenditure slowed in 2021 (+0.2%) before falling by 6.0% in 2022 (increase of 2.6% in nominal terms), largely due to a decrease in real terms of benefits related to old-age pensions and survivors’ pensions and health-related benefits, as well as unemployment benefits in a context of recovery and employment growth. Supported by a resilient labour market, the negative contribution of unemployment benefits in 2021 and 2022 stemmed from the tightness of the labour market, the phasing-out of job retention schemes after the pandemic, and unemployed people no longer being eligible. A series of measures between January 2022 and January 2023 sought to support the income of pensioners against inflation (indexation, ad hoc increases, one-off benefits). However, the rise in prices hindered the positive effect of these measures. (38) As a share of GDP, social protection benefit expenditure decreased to 27.2% in 2022, 3 pp lower than in 2020 and 1.5 pp lower than in 2021. Old age and survivors’ benefits represented the highest proportion of social benefit expenditure (46.3%), followed by sickness and healthcare (30.0%), family and children (8.6%), disability (7.0%), unemployment (4.3%), social exclusion (2.6%) and housing (1.3%). At national level, estimated total expenditure on social protection benefits ranged between 11.3% of GDP in Ireland and 32.2% of GDP in France in 2022.(39) The significance of social protection benefits is also affected by the large shares of people entitled to such benefits but not claiming them. For instance, national case studies estimated that in Spain, 58% of households entitled to minimum income benefits in 2022 did not request them in Italy, the non-take-up rate of minimum income by eligible households in 2021 was 38.5%, and almost half (46.6%) of potentially eligible households in Belgium remained uncovered in recent years. (40)
Chart 1.15
Old age, unemployment and health-related benefits contributed to the decline in social protection benefit expenditure in 2022
Growth in social protection expenditure (% change on previous year, in real terms) and contribution, by function, to the yearly increase (purchasing power standards, PPS), both on the left axis, EU

Note: Nominal expenditure converted into real expenditure by deflating with HICP.
Source: Eurostat, ESSPROS [spr_exp_sum] and ESSPROS early estimates (2022), and prices statistics [prc_hicp_aind]; DG EMPL calculations.
Notes
- 35.It includes, among others, administration of general economic, commercial and labour affairs, formulation and implementation of policies, regulation or supervision of activities, support to programmes or schemes, promotion of policies and programmes, administration of sectoral affairs and services, grants, loans or subsidies supporting sectors, administration and operation of government agencies engaged in applied research, grants, loans or subsidies to support applied research by non-government bodies. More details in the Manual on sources and methods for the compilation of COFOG statistics here.
- 36.Based on latest available administrative data, which extends to 2022.
- 37.Based on latest available administrative data, which extends up to 2022.
- 38.(European Commission, 2024c).
- 39.2022 figures are preliminary results based on Eurostat early estimates for expenditure on social protection.
- 40.Based on latest available administrative data, which extends up to 2022. Spain: (Autoridad Independente Responsabilidad Fiscal, 2023); Belgium and Italy: (Almeida, De Poli and Hernández, 2022); for EU-level developments: (Heylen, 2024), (European Commission, 2022f).