
3. Labour market developments
3.4. Labour demand
As an indicator of unmet labour demand, the job vacancy rate in the EU experienced a slight decrease in 2023, but remained at a high level following a surge in 2021-2022. This gauge of labour shortage showed consistent increases post-financial crisis, rising from 1.0% in 2014 to 2.3% in 2019 (Chart 1.10). It briefly receded during the COVID-19 pandemic, to 1.8% in 2020, only to rise sharply in 2021, to 2.4%, and to 3.0% in 2022 (the highest recorded figure to date) before falling to 2.8% in 2023. At sectoral level, the highest job vacancy rates were in ‘administrative and support service activities’ (that include temporary employment agencies) (4.3%), ‘accommodation and food service activities’ (3.8%), ‘construction’ (3.8%), ‘professional, scientific and technical activities’ (3.7%), and ‘information and communication’ (3.4%). The lowest rates were in ‘mining and quarrying’ (1.2%), ‘water supply; sewerage, waste management and remediation activities’ (1.8%), and ‘electricity, gas, steam and air conditioning supply’ (1.8%). Certain sectors, such as ‘construction’ and ‘information and communications technology’ (ICT), play a pivotal role in facilitating the green and digital transitions. Addressing the high number of job vacancies in these sectors will help to eliminate bottlenecks and smooth the transition process.
The labour market continued to be constrained despite a slight decrease in the labour shortage indicator in industry and construction. (27) The labour market continued to be constrained despite a slight decrease in the labour shortage indicator in industry and construction. (Chart 1.11).
Chart 1.10
Job vacancies declined in 2023 but remain high
Job vacancy rates (% of vacancies and occupied posts)
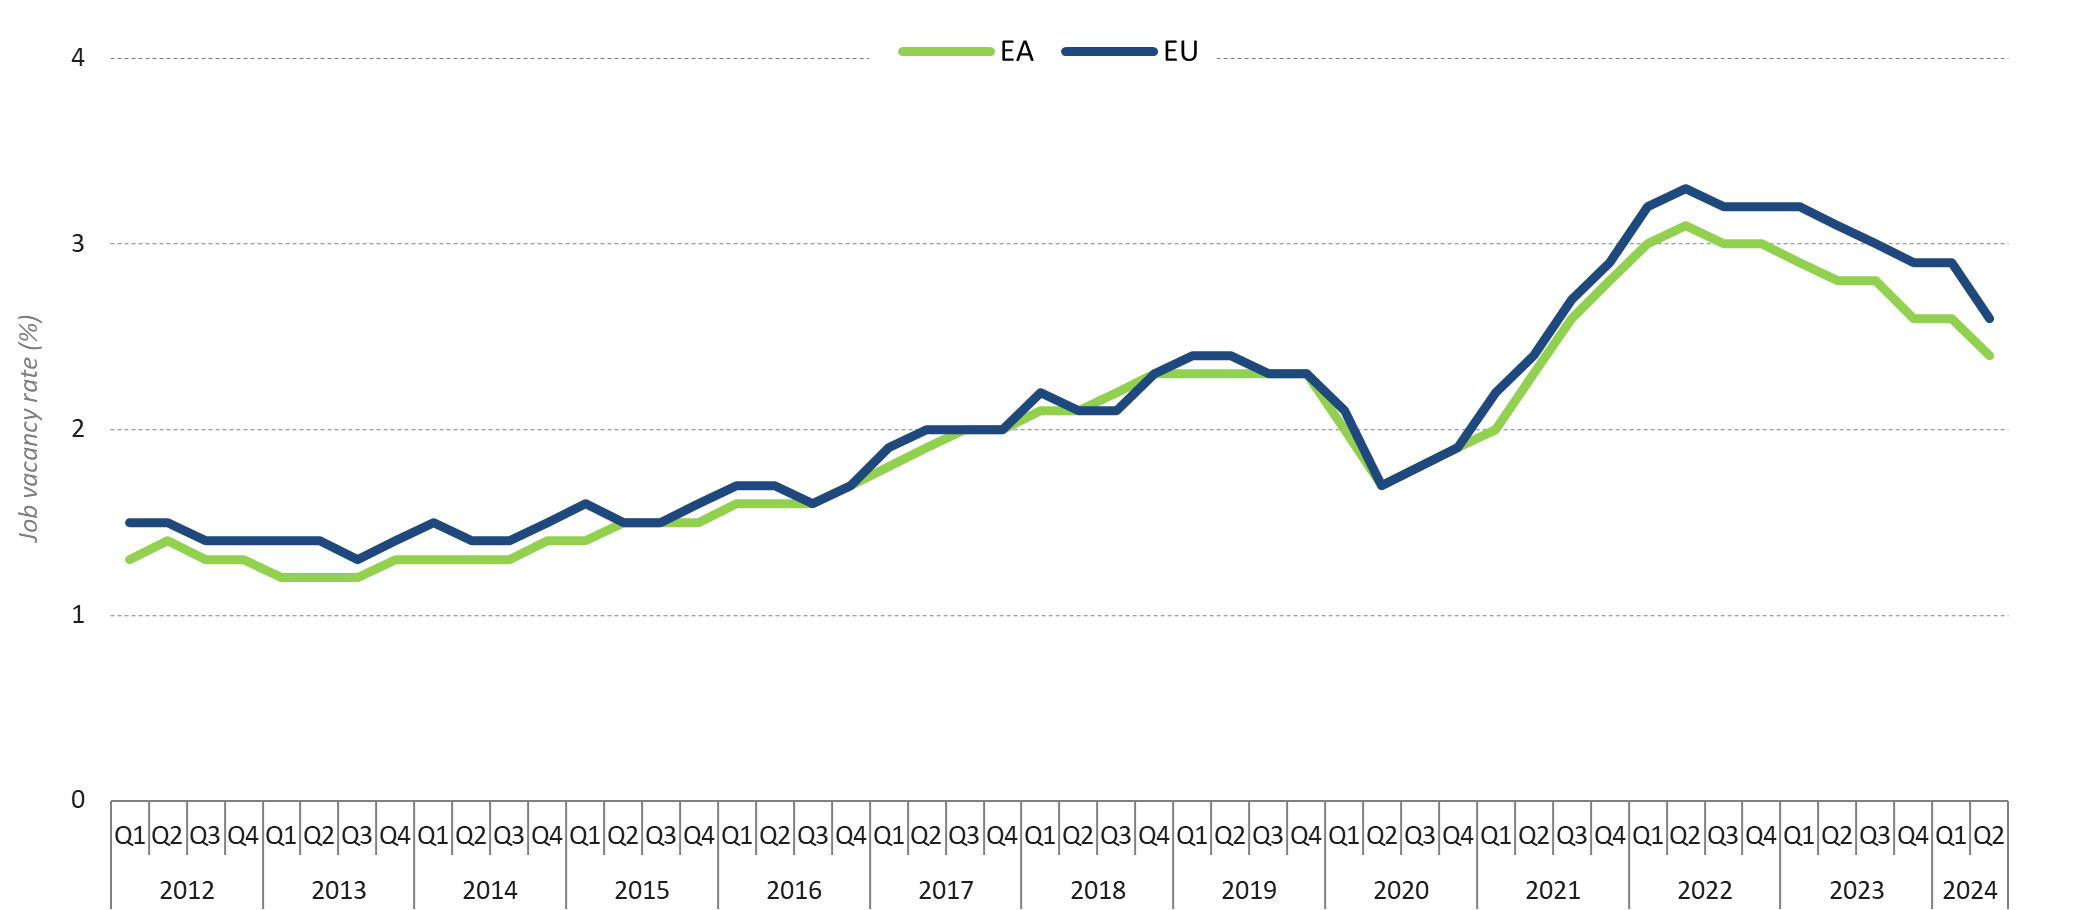
Note: Job vacancy rate = vacancies / (vacancies + occupied posts); NACE rev2 B-S Industry, construction, and services (except activities of households as employers and extra-territorial organisations and bodies).
Source: Eurostat, Job Vacancy Statistics [jvs_q_nace2]. Seasonally adjusted data.
Chart 1.11
Labour shortages declined slightly in industry and construction in 2023, but remained at high levels
Beveridge curves (labour shortage indicators on Y-axis and unemployment rates on X-axis)
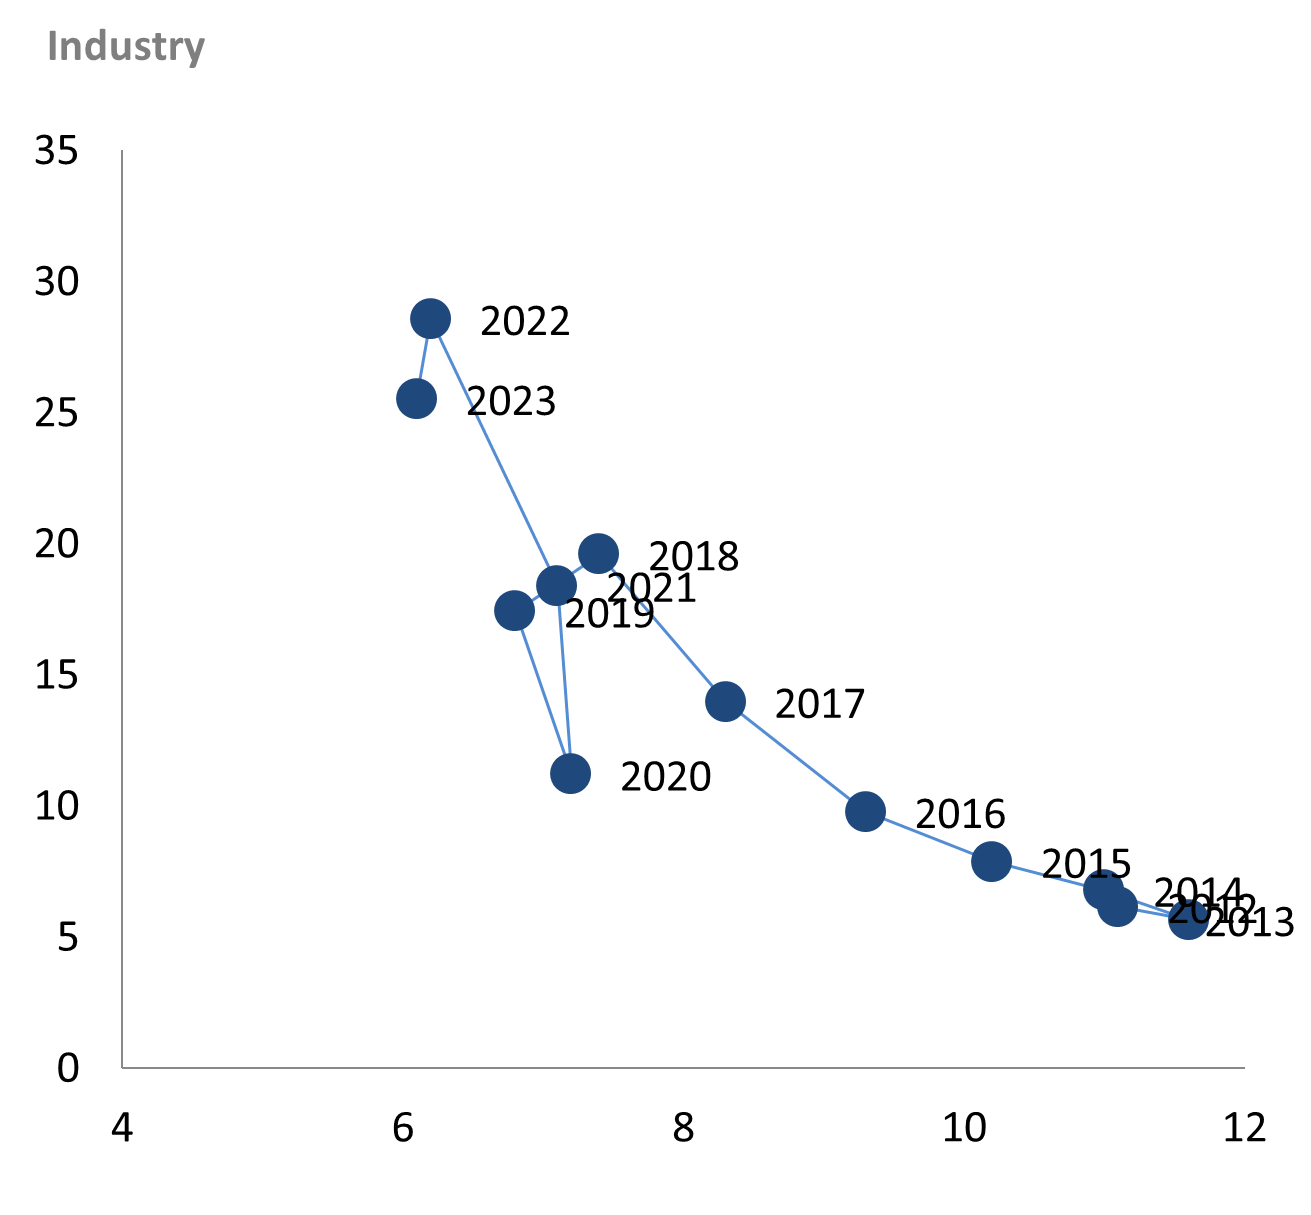
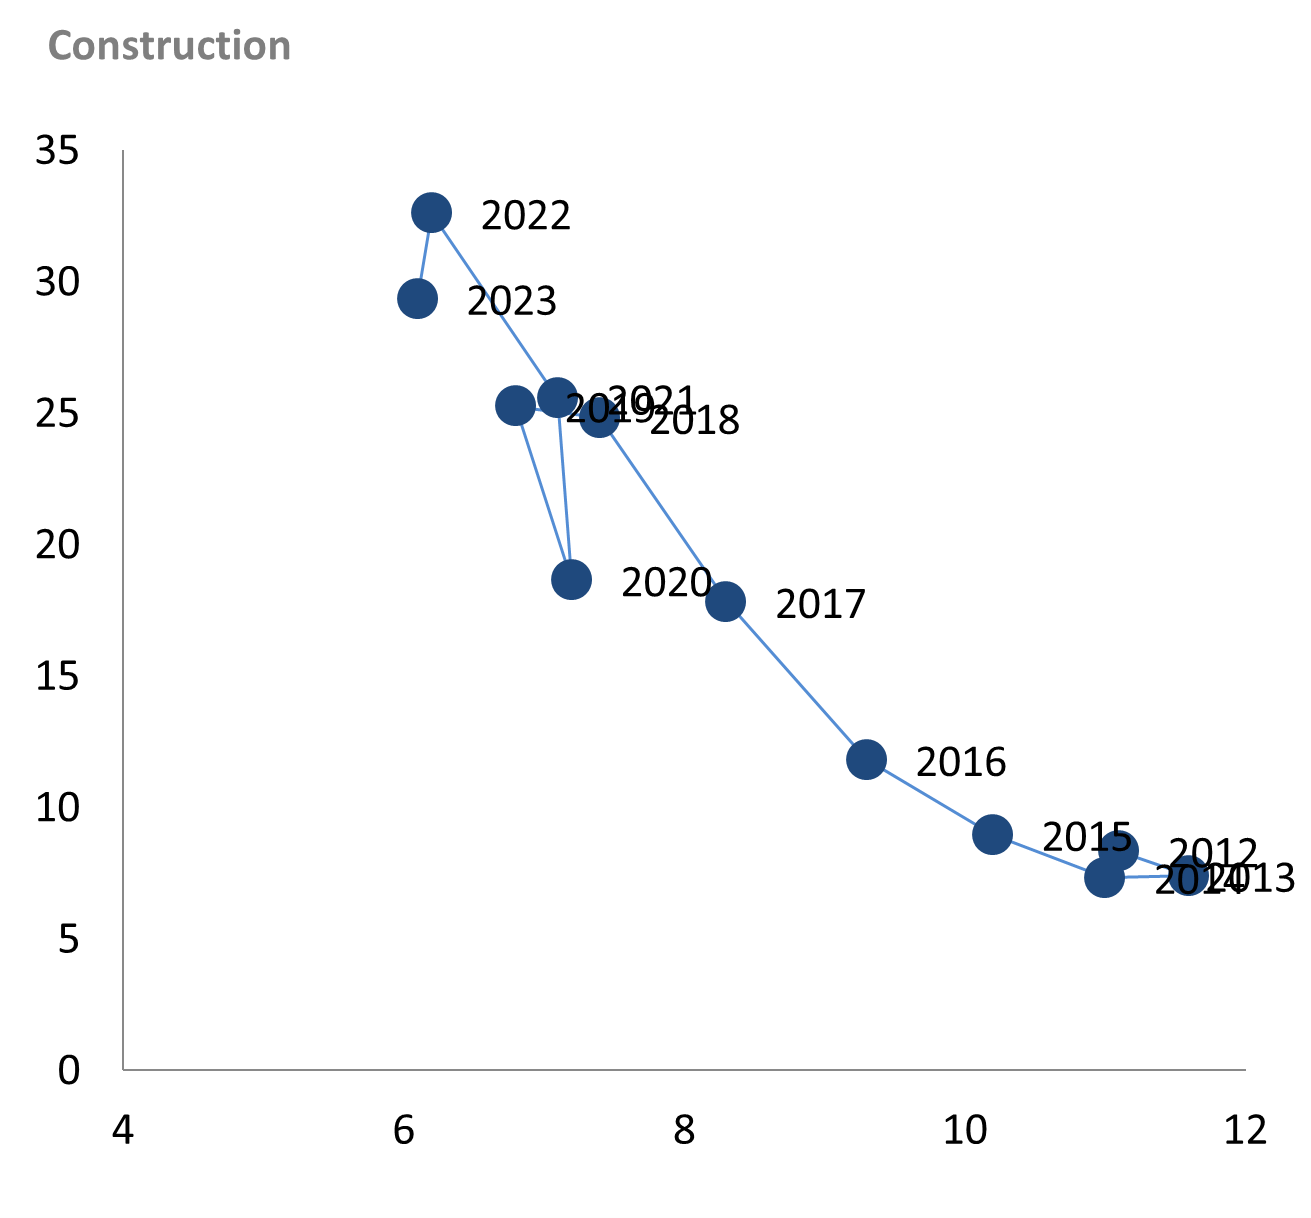

Note: Annual figures for labour shortage indicators (Y axis) are calculated as annual averages of quarterly data (industry and services) or monthly data (construction). This is a sentiment indicator that reflects the share of managers identifying shortage of labour force as a factor limiting production.
Source: Eurostat [ei_bsin_q_r2 ; ei_bsbu_m_r2 ; ei_bsse_q_r2 ; une_rt_a]. Data seasonally adjusted.