
4. Living conditions, poverty, and income developments
4.3. Risk of poverty and social exclusion
The AROPE rate decreased slightly in 2023 but remains high for certain groups, including children (0-17).The AROPE rate in the EU was 21.4% in 2023, a slight decrease compared to the previous two years (21.6% in 2022 and 21.7% in 2021) (Chart 1.21). The AROPE rate for children remained rather stable compared to 2022, but increased from 24.0% in 2020 to 24.8% in 2023. In line with the trend in previous years, the share of people at risk of poverty or social exclusion in 2023 was higher for women (22.4%) than for men (20.3%). Young adults aged 18-24 (26.1%), people with a low level of educational attainment (34.5%), people with disabilities (28.8%), non-EU citizens (45.5%), and unemployed people (66.3%) experienced particularly high risks of poverty or social exclusion.
Progress towards the EU 2030 poverty reduction target is advancing but remains limited for children. The EU 2030 target foresees lifting at least 15 million people out of poverty or social exclusion compared to 2019, including at least five million children. An estimated 93.9 million people in the EU experienced poverty or social exclusion in 2023, 19.7 million of whom were children under 18 years old. As socioeconomic conditions recover from the COVID-19 pandemic and energy crises, the AROPE rate experienced some improvements in 2023, showing a decrease of 0.6 million people from 2022 and a decrease of 1.6 million people from 2019. However, trends in the AROPE rate for children point to very slow improvements in 2023, pointing to the higher vulnerability of this group to the recent cost-of-living crisis. The number of children at risk of poverty or social exclusion decreased by 0.1 million compared to 2022 but increased by 0.6 million compared to 2019. (45) Overall, social protection and inclusion play a crucial role in ensuring socioeconomic resilience to shocks, but specific groups need additional support.. (46) Overall, social protection and inclusion play a crucial role in ensuring socioeconomic resilience to shocks, but specific groups need additional support.
Chart 1.21
At risk of poverty or social exclusion rate decreased slightly from 2020-2023, but increased for children
AROPE rate, AROP rate, severe material and social deprivation (SMSD) rate (% of population), share of people living in very low work intensity (VLWI) households (% of population aged 0-64), 2015-2023, EU
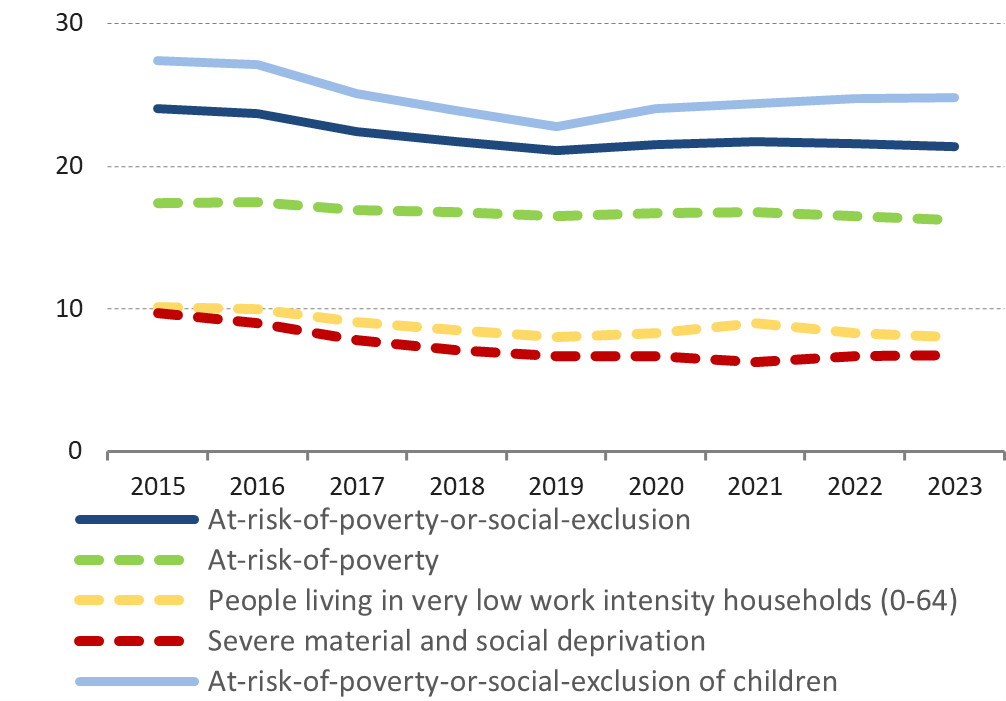
Note: Year refers to: EU-SILC survey year; income from previous year; AROPE, AROP: income from previous year; SMSD: current year; VLWI: status in the past year. Values for AROP between 2015-2018 are estimated. AROPE and AROP break in time series in 2020.
Source: Eurostat, EU SILC [ILC_PEPS01N] [ILC_LI02] [ILC_MDSD11] [ILC_LVHL11N].
The at-risk of poverty (AROP) rate recorded a further slight decrease in 2023. It decreased from 16.5% in 2022 (2021 incomes) to 16.2% in 2023 (2022 incomes). Before social transfers (excluding pensions), this rate was 24.8%, 8.6 pp higher, confirming the high impact of social transfers on decreasing the risk of monetary poverty. The AROP rate was high and increased for unemployed people (47.5% in 2023, compared to 46.2%), while remaining broadly stable for children (+0.1 pp, to 19.4%) (Chart 1.21). In-work poverty decreased only slightly, to 8.3% in 2023 (by 0.2 pp) continuing the longer-term trend from 2015. Despite the protective effect of work, many workers still remain at risk of poverty (Chart 1.23). This income indicator does not directly capture changes in household purchasing power. Eurostat flash estimates (47) indicate that the AROP rate is expected to reduce by a further 0.2 pp (16.0%) in the EU for 2023 incomes, a non-statistically significant decline. The nowcasted results also show non-statistically significant changes for children, older people, and workers. At national level, the AROP rate is expected to remain stable in 17 countries, to decrease in six, (Germany, Estonia, Spain, the Netherlands, Portugal and Finland), and increase in four (Greece, France, Luxembourg, and Austria).
Tax-benefit systems played a significant role in complementing people’s disposable income in 2023. In the EU in 2023 (as in 2020-2022), the average share of benefits in individuals’ disposable incomes was higher than before the onset of the COVID-19 pandemic (Chart 1.22). (48) This illustrates the importance of social protection systems and government intervention in buffering the financial impact of crises on households in the EU. Overall, the positive impact of tax-benefit systems was primarily driven by non-means-tested benefits. The share of non-means-tested benefits increased by 1 pp in 2020 and although it receded slightly until 2023, it remained at a higher level than before the pandemic. One possible explanation for that increase is their faster implementation compared to means-tested benefits, thus their broader use by governments to swiftly respond to the COVID-19 pandemic first and the inflationary crisis later.
Chart 1.22
Tax-benefit systems played a greater role in people's disposable income during and after the COVID-19 pandemic
Share (%) of all individuals’ disposable income in pre-tax income over time, EU

Note: Original income: pre-tax employment and self-employment income; capital, property and investment income; private pensions and transfers. Full disposable income: original income minus taxes and social insurance contributions paid by the individual, plus means-tested benefits, non-means-tested benefits and pensions. Disposable income with means-tested benefits only: original income minus taxes and social insurance contributions paid by the individual, plus means-tested benefits and pensions. Disposable income without any benefits: original income minus taxes and social insurance contributions paid by the individual, plus pensions. The figure shows the ratios of three different types of disposable income to original income, e.g. a blue dot (full disposable income) at 100% indicates that, on average, benefits received by households are equal to the amount paid for taxes and SIC paid by the individuals. If the blue dot is below 100%, people pay, on average, more taxes and SIC than they receive in benefits.
Source: JRC calculations based on Euromod I6. 0+. EU average is weighted by the population of the countries.
The proportion of the population living in severe material and social deprivation remained rather stable. The SMSD rate in 2023 was 6.8%. Contrary to the long-term improvements since 2015, over the last three years the SMSD rate increased slightly, by 0.5 pp (from 6.3% in 2021), in line with the relatively stable real disposable median income (Chart 1.19). The increase was more pronounced for those in the first income quintile, who experienced high SMSD rates (19.0% in 2023, compared to 18.4% in 2021, +0.6 pp), reflecting declines in the purchasing power of the lowest income households over this period (Chart 1.23, right). In line with favourable labour market developments, the proportion of people living in very low work intensity households in 2023 further decreased to 8.0%, compared to 8.3% in 2022.
Chart 1.23
Work protects against poverty, but still imperfectly; Severe material and social deprivation at high levels and slightly increasing for the lowest income group
Left chart: share of population at-risk-of-poverty (AROP rate) for selected characteristics, 2015-2023, EU; Right chart: share of population in severe material and social deprivation (SMSD rate) by income quintile, 2021-2023, EU


Note: Year refers to EU-SILC survey year; income from previous year. AROP rate: income from previous year, SMSD rate: current year. AROP rate between 2015 and 2018 is estimated. AROP rate break in time series in 2020.
Source: Eurostat, EU SILC Eurostat, EU SILC [ILC_LI02] [ILC_LI04] [ILC_IW01] [ILC_PNS6] [ILC_MDD13].
Despite relatively favourable social outcomes, the proportion of the population experiencing energy poverty further increased in 2023. Energy poverty here operationalised and measured by the ‘inability to keep home adequately warm’, increased by 1.3 pp in 2023, reaching 10.6% (compared to 9.3% in 2022 and 6.9% in 2021). There are large variations across Member States, with energy poverty particularly high in Spain (20.8%), Portugal (20.8%), Bulgaria (20.7%), Lithuania (20.0%) and Greece (19.2%). In the context of high energy prices, energy poverty increased more sharply for the population at risk of poverty (by 2.1 pp), to 22.2% in 2023, reaching more than double the EU average (Chart 1.24, left). The proportion of single people with dependent children experiencing energy poverty has surpassed 2012 levels (Chart 1.24, right). The share of households with arrears on utility bills remained stable compared to 2022, while the proportion of households living in a dwelling with a leaking roof, damp walls, floors or foundation, or rot in window frames or floor increased by 0.7 pp to 15.5% in 2023. Household expenditure on housing, water, electricity gas and other fuels have risen steadily since 2010. (49)
Chart 1.24
Peak of population unable to keep their home adequately warm in 2023
Left chart: share of population below/above the at-risk-of-poverty threshold unable to keep home adequately warm and average annual index (2015=100) for electricity, gas and other fuels, 2012-2023, EU; Right chart: share of population below/above the at-risk-of-poverty threshold unable to keep home adequately warm by household composition, 2021-2023, EU.

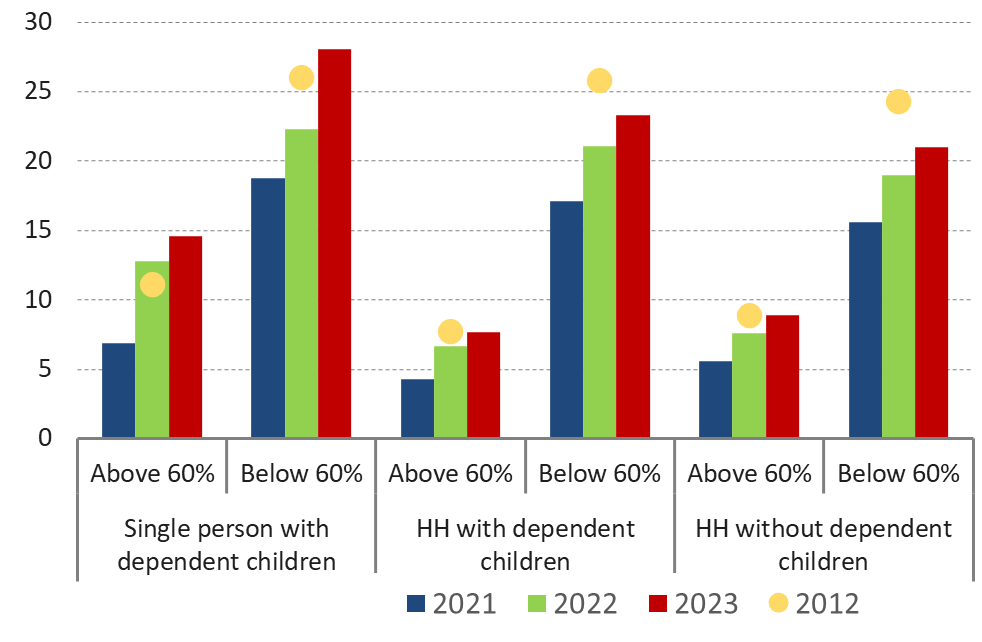
Source: Eurostat, EU-SILC [ILC_MDES01, PRC_HICP_AIND].
Notes
- 45.Figures based on the break-free series [ilc_pecs01] and EMPL calculations to adjust the figures to the break in series in France.
- 46.Figures based on the break-free series [ilc_pecs01].
- 47.Eurostat flash estimates complement structural and detailed indicators from EU-SILC to capture the latest income changes, particularly relevant in times of crisis. Flash estimates are based on modelling and microsimulation techniques that consider the complex interaction between labour market developments, economic and monetary policies, and the implementation of social reforms. For the latter, Eurostat uses the latest information on labour from the 2023 EU-LFS together with the EUROMOD microsimulation model, which provides the effects of direct taxes, social security contributions and benefits on households’ income.
- 48.Calculated as the difference between full disposable income and disposable income without any benefits as a share of full disposable income. For limitations of the modelling exercise and assumptions used in Euromod see (European Commission, 2022d).
- 49.Eurostat [hbs_exp_t121]