
4. Living conditions, poverty, and income developments
This section presents recent trends in income and living conditions of EU households since the start of the cost-of-living crisis. It documents income trends for the overall population and for different income groups, the role of social transfers in mitigating income inequality, and the multifaceted nature of poverty and social exclusion.(41) As the official indicators on inequality and risk of poverty are computed with survey data on income (latest available are 2023 data based on 2022 incomes), these figures are complemented with Eurostat flash estimates on income inequality and poverty (2023 incomes).
4.1. Income and consumptions trends
Following declines in the last three quarters of 2022, real gross disposable household income (GDHI) began to rise again in 2023, especially in the last quarter. The impact of high inflation on real wages prompted real GDHI to decline by 0.3% in the fourth quarter of 2022 compared to the previous year. However, as inflationary pressures eased and nominal wage growth gained pace in 2023, real GDHI saw improvements and was 1.8% higher in the fourth quarter of 2023 compared to the same quarter of 2022 (0.7% in the first, 1.2% in the second, 0.6% in the third quarter in year-on-year comparisons). The positive growth of real GDHI in the first two quarters of 2023 was primarily due to the lower negative impact of taxes on income and wealth. In the context of easing inflation, real compensation of employees contributed positively to GDHI in the second half of 2023 (Chart 1.16). The phase-out of the extraordinary measures after the COVID-19 pandemic and the accompanying energy crisis can explain the negative contribution of net social benefits on the growth of real GDHI observed in most quarters of 2021 and 2022. In the first two quarters of 2023, these net social benefits started to positively contribute to growth again, but stagnated in the second two quarters (see Section 3.6).
Chart 1.16
Real GDP growth, real GDHI growth and its main components
Real GDHI and real GDP (% change on previous year), and contribution of GDHI components (pp), 2012-2023, EU
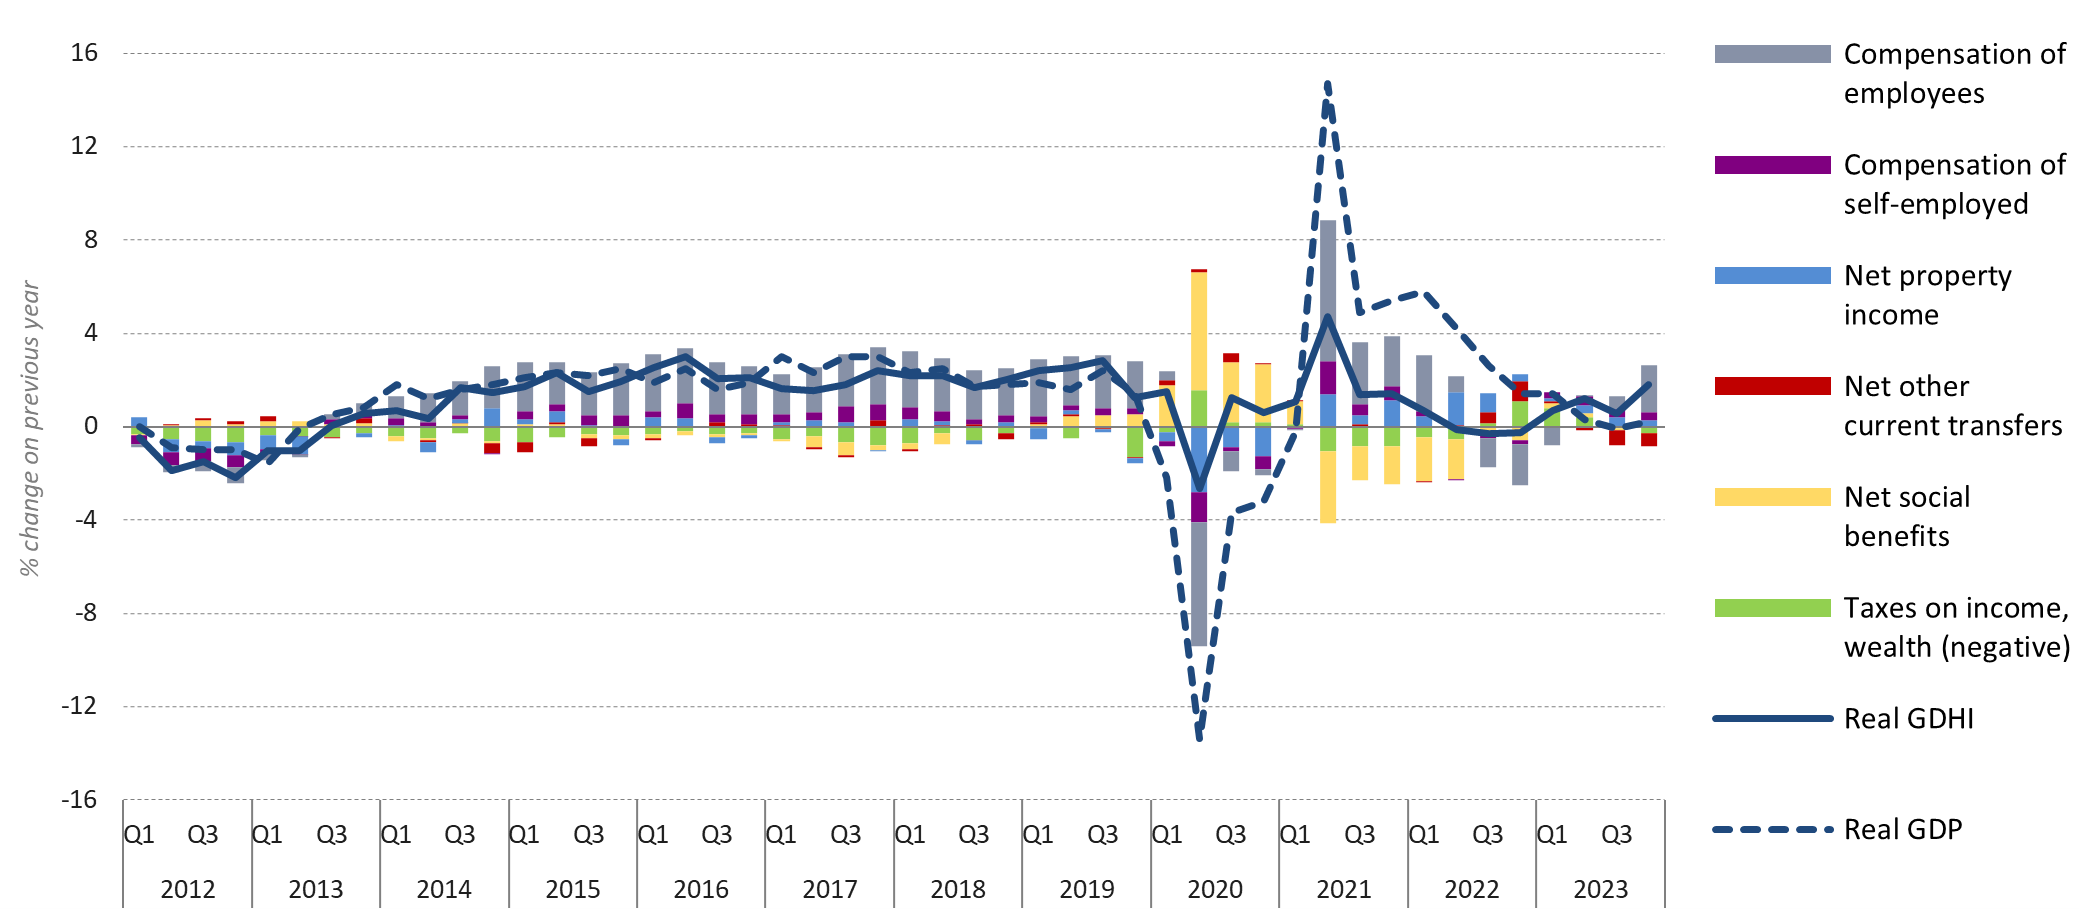
Note: Nominal GDHI converted into real GDHI by deflating it with the price index of household final consumption expenditure [prc_hicp_aind].
Source: DG EMPL calculations based on Eurostat data, national accounts [nasq_10_nf_tr] and [namq_10_gdp], data non-seasonally adjusted.
The price of some necessities continued to increase in 2023, affecting the purchasing power of lower-income households, while energy prices remained high. Despite easing inflationary pressure, some essential items for households, such as food and beverages (12.6%), clothing and footwear (4.4%) and rents (3.0%), continued to increase in 2023. This negatively impacted households, especially those with lower incomes, which spend a large share of their income on essential consumption items. However, prices grew less substantially for electricity, gas and other fuels (1.4%), which likely eased the financial pressure stemming from energy consumption for lower-income and some middle-income households. In this context, the increase in energy poverty in 2023 was less pronounced compared to 2022 (Chart 1.17).
Chart 1.17
Prices of items continued to increase in 2023 compared to 2022 and 2021
Price index of household final consumption expenditure (year-on-year change), by COICOP, HICP annual data, EU

Note: Consumption items selected from the classification of individual consumption by purpose (COICOP); HICP gives comparable measures of inflation for the countries and country groups for which it is produced.
Source: Eurostat data [prc_hicp_aind].
In the context of easing inflation, the proportion of people reporting financial distress experienced a decline. After stagnating at high levels, around 17.1%, from May to December 2023, financial distress slightly declined in the first two quarters of 2024, reaching 16.2% in July (-1.0 pp compared to one year before). In the same month, the share of the population declaring that they needed to draw on savings reached 12.0% (-0.8 pp compared to the same month in 2023), while 4.2% stated that they were running into debt (-0.2 pp) (Chart 1.18).
Chart 1.18
Persistent financial distress over the last year, especially for lower-income households
Reported financial distress by income quartile, 2012-2024, EU
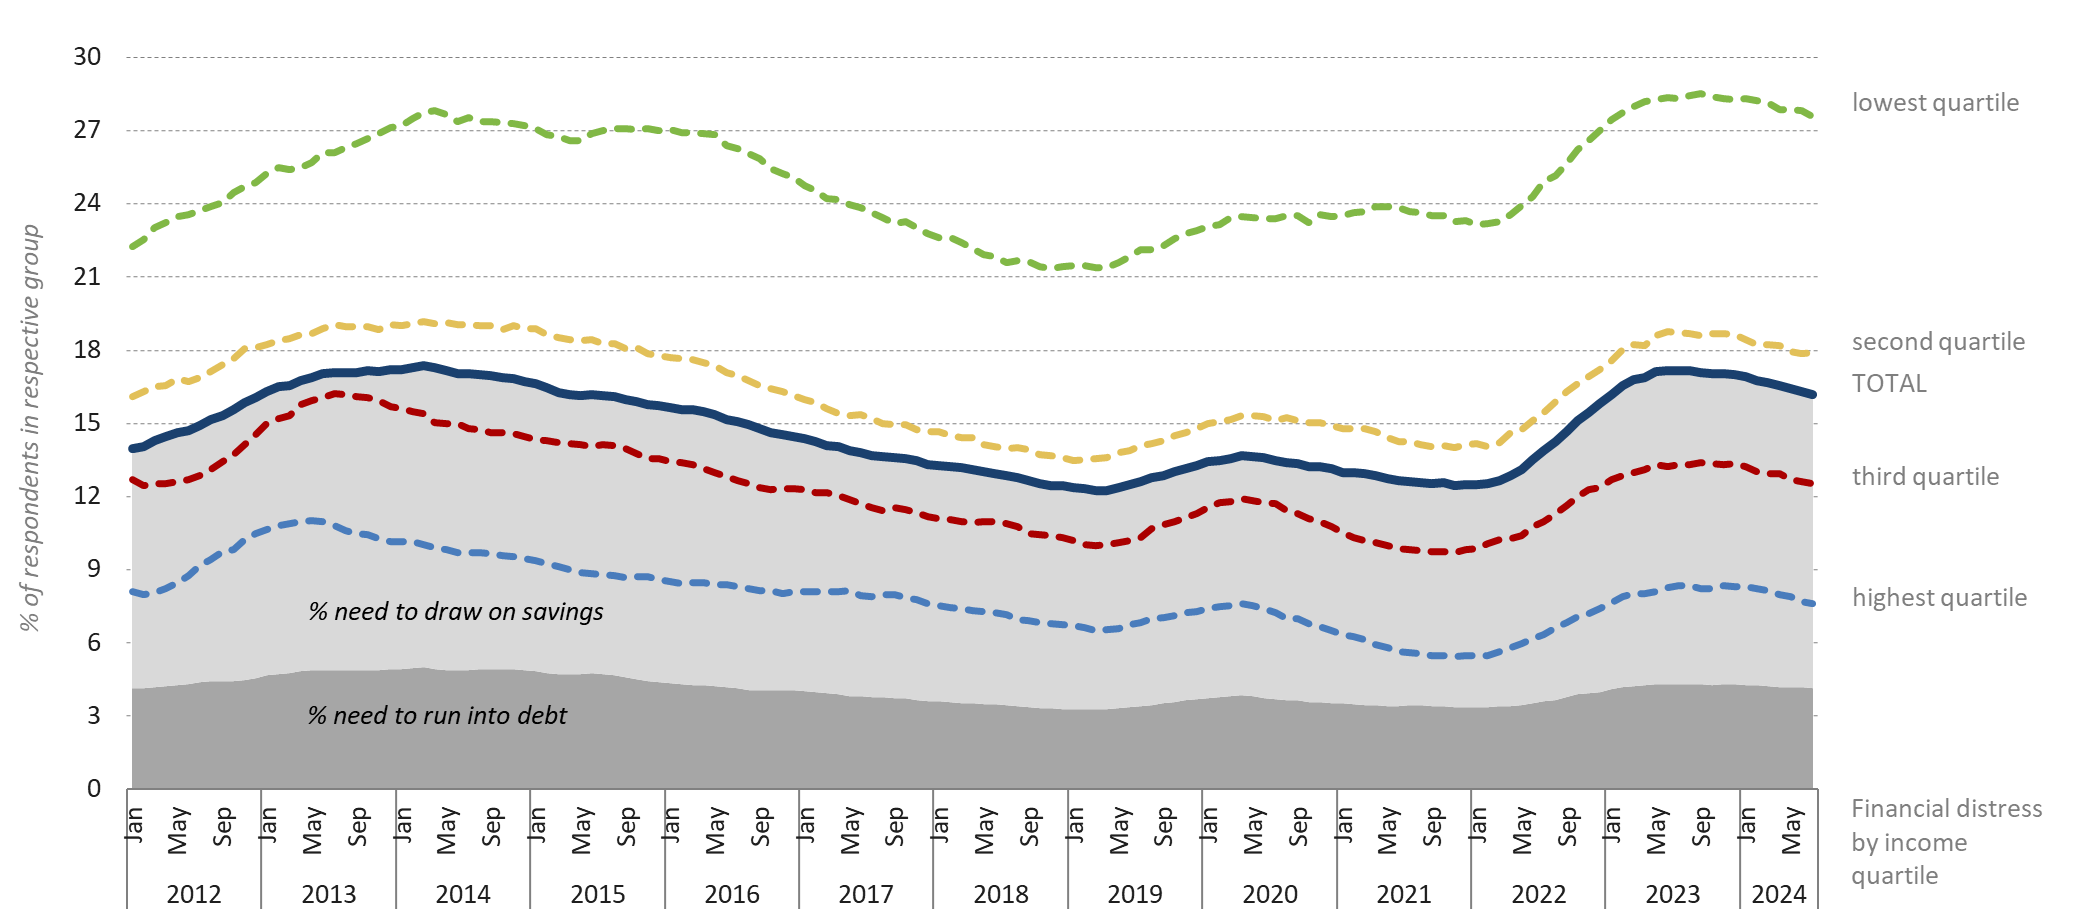
Note: Lines show the long-term averages for financial distress for the population as a whole and for households in the four income quartiles. Overall share of adults reporting having to draw on savings and/or run into debt are in light grey and dark grey, respectively, which together represent total financial distress.
Source: DG EMPL calculations based on Business and Consumer Surveys, unadjusted data, 12-month moving average.
Lower-income households still experienced particularly elevated levels of financial distress. In July 2024 this indicator reached 27.6% for the lowest income quartile (-0.7 pp on a yearly basis), remaining at almost 10 pp or more above the shares for other income quartiles. It amounted to 17.9% for the second quartile (-0.8 pp), 12.5% for the third quartile (-0.8 pp), and 7.6% for the wealthiest quartile (-0.7 pp) (Chart 1.18). Persistent financial distress, especially for lower-income households, could be partly due to average price increases for certain consumer items in 2023, notably food, and ongoing elevated energy prices.
Chart 1.19
Real median disposable income did not increase in all countries since 2010
Median equivalised disposable income in real terms (Index SILC 2010 = 100)
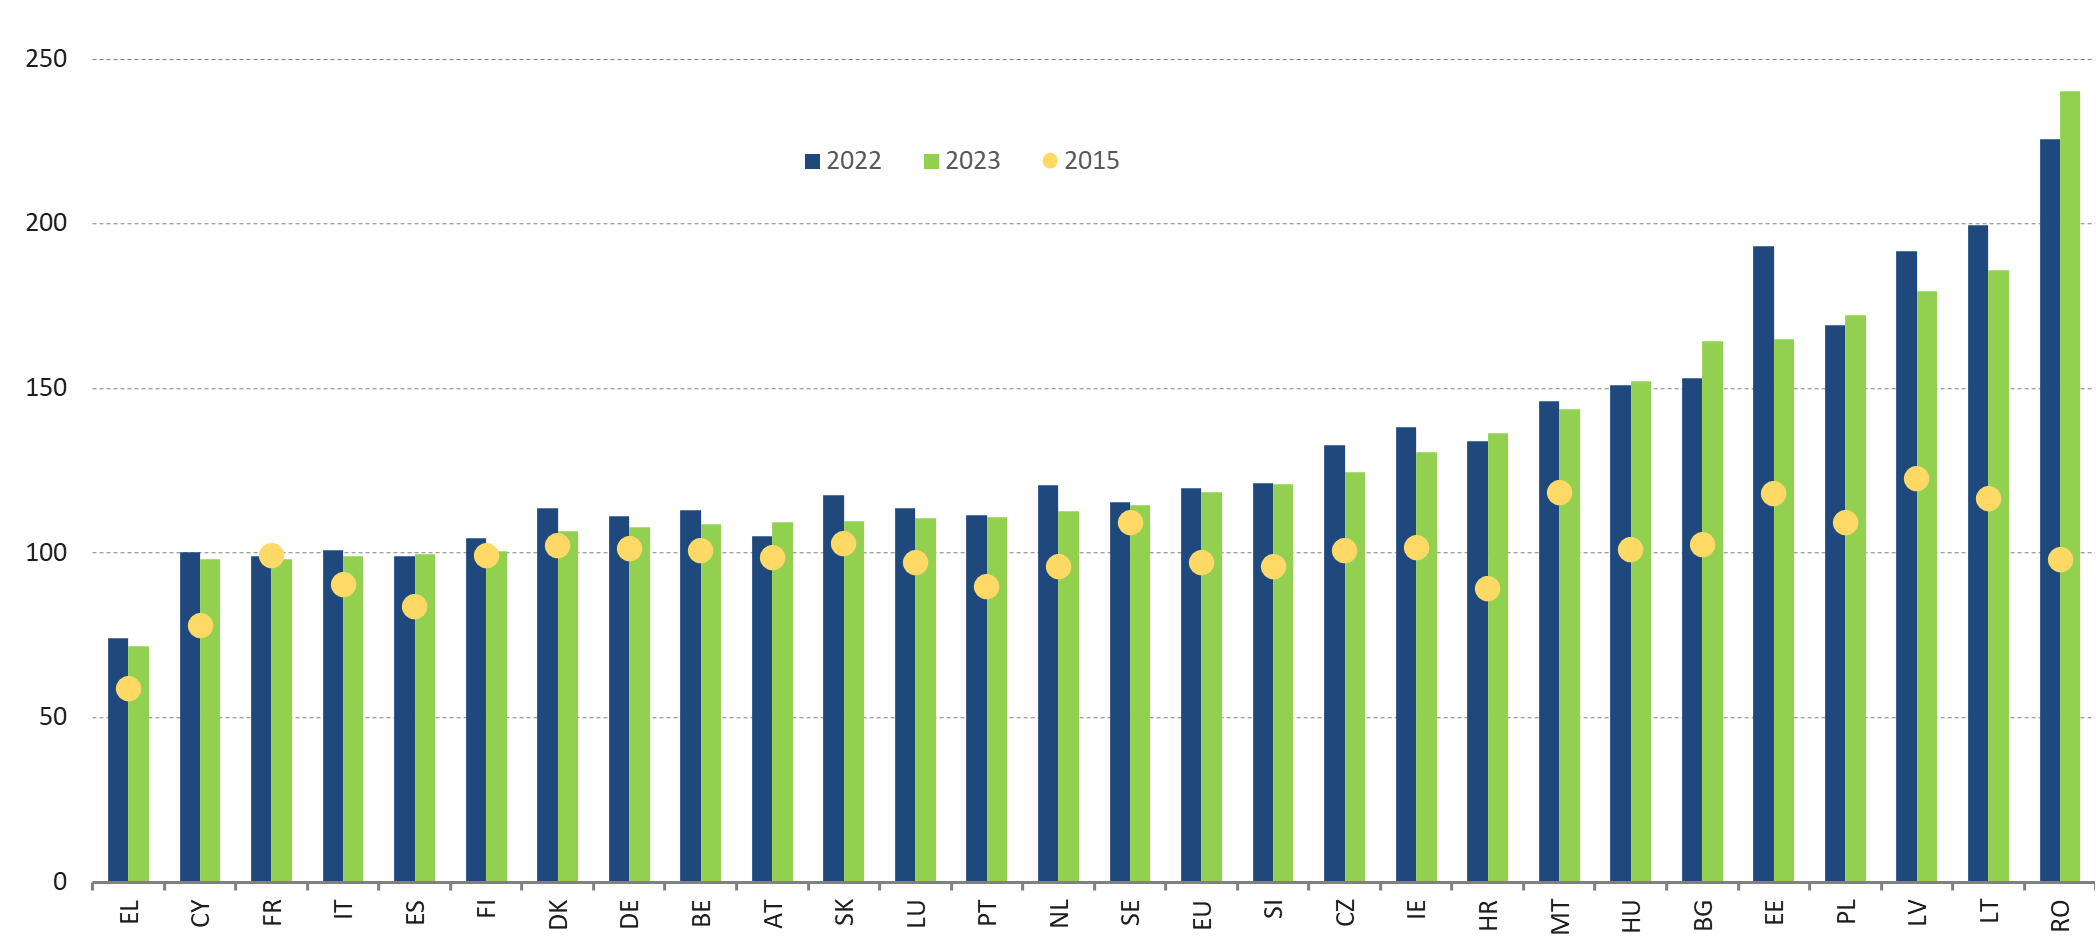
Source: Eurostat [ILC_DI18].
Over the last decade, real median disposable income increased for the EU average but remained at 2015 (2014 incomes) levels in 2023 (2022 incomes) in a number of Member States. This includes some major EU economies (Chart 1.19). The real median disposable income at EU level increased from 97% of the 2010 real median income in 2015 (2014 incomes) to 118.5% in 2023 (2022 incomes). It remained quite stable since 2020. The trend varied considerably across the Member States. In France, Italy, Finland, Denmark, Germany, Belgium, Austria, Slovakia and Sweden, the 2023 real median disposable income remained at 2015 levels, while it increased most in Romania, Latvia, Lithuania, Poland, Bulgaria and Hungary. In Greece, the real median disposable income remains well below the pre-financial crisis level. In nominal terms, the flash estimates (2023 income) nowcast an overall increase of 6.0% for 2023 incomes, with positive changes estimated for all countries. In real terms, however, a slight, non-statistically significant increase (0.2%) is expected at EU level, while at national level, the nowcasted real income is estimated to increase in 16 countries, to remain stable in six countries, and to decrease in five countries, (42) reflecting the heterogeneity of the impact of inflation across countries.
Notes
- 41.Note that the social transfers analysed here do not include in-kind transfers such as healthcare coverage. Those are nevertheless known to have strong impact on reducing poverty (see the State of Health Synthesis Report 2023 p.17, and ESTAT on theSTIK - Impact of health social transfers in kind on income distribution and inequality - Statistics Explained (europa.eu)).
- 42.Stable: Denmark, Croatia, Cyprus, Latvia, Malta, Austria and Sweden. Decrease: Czechia, Germany, France, Italy, and Hungary. Increase: Belgium, Bulgaria, Estonia, Ireland, Greece, Spain, Lithuania, Luxembourg, the Netherlands, Poland, Portugal, Romania, Slovenia, Slovakia, Finland.