
Annex: Technical Annex
A2.1. Measurement of convergence
In this report, convergence is broadly understood as a reduction in disparities across geographical entities (countries or regions) over time. This broad understanding of convergence was operationalised in several ways in previous research, focusing on:
- Declining variation of an outcome across regional entities (Sigma convergence)
- Catching up of worse performing countries with better performing ones (Beta convergence)
- Changes in country outcome rankings (Gamma convergence)
- Declining distance from the best-performing group of countries (Delta convergence)
- Sigma and Beta convergence are the most commonly used methods for assessing convergence and are the key focus of this research. It is also important to assess the direction of convergence, i.e. whether countries or regions converge towards a better or worse outcome from a policy perspective. This technical annex presents a detailed methodology for assessing these two types of convergence and their direction. Assessing Delta and Gamma convergence goes beyond the scope of this report.
Reduction in disparities across Member States or regions over time (Sigma convergence)
Sigma convergence occurs when variation in a given outcome across geographical entities (countries or regions) declines over time. Conversely, divergence occurs when variation in national or regional outcomes increases over time. The analysis plots a chosen measure of outcome variation over time and assesses trends in its development.
For most of this report, the measure chosen to assess variation is standard deviation, calculated according to the following formula,
Where stands for a value of outcome x for a geographical entity i in a given year , and stands for the mean value of an outcome across all geographical entities in a year .In statistical terms, standard deviation is an absolute measure of variation of an outcome around its mean value. This is a suitable measure of variation for most socio-economic outcomes covered in this report, where distance from the mean is of principal interest. For example, if countries fall within 2 pp of a mean EU unemployment rate of 2%, this can be considered a similar variation in outcomes to the case where countries fall within 2 pp of a mean EU unemployment rate of 4 %.
Using standard deviation as a measure of variation poses some challenges. Firstly, the magnitude of standard deviation is sensitive to the unit in which outcome is measured, which makes comparison of standard deviation across outcomes measured in different units uninformative (e.g., comparing cross-country standard deviation in employment rates and GDP per capita is meaningless, as the former is expressed as a percentage and the latter is expressed in EUR). Secondly, standard deviation only focuses on measuring absolute distances from the mean and has little to say about changes in relative terms. This is problematic for some of the socio-economic outcomes covered by this report (GDP per capita, wages, income), which tend to grow over longer periods of time and have no upper bound. For example, if GDP grew by 50% in each country considered, this would by default lead to a 50% increase in standard deviation across countries, even though the relative positions of the countries would remain the same.
To account for this, the report also analyses convergence using a coefficient of variation for those indicators (GDP per capita, wages, income), for which focusing solely on standard deviation would be too restrictive. Coefficient of variation is defined as standard deviation divided by the mean:
Coefficient of variation adjusts standard deviation by developments in outcome mean over time and is therefore insensitive to level changes (e.g., a 50% increase in GDP per capita in all countries considered would not change the value of coefficient of variation). It measures variation relative to the mean rather than in absolute terms.
Catching-up of worse performing Member States or regions (Beta convergence)
Beta convergence assesses whether countries or regions that start with worse outcomes improve faster over time than those starting with better outcomes. Where this is the case, Member States or regions are considered converging. Conversely, if countries or regions with better initial outcomes improve faster than others over time, this signifies divergence.
Beta convergence is estimated via a logarithmic regression model, which regresses the growth of an indicator over a certain period of time on its initial value. The specification of this model is as follows,
where is the indicator value in country at a time , is the growth rate of this indicator at time , and are coefficients to be estimated and is the error term.
Beta convergence exists if the estimated regression coefficient β is statistically significant and negative, i.e. if countries that performed worse at the start of the period of interest improved faster than those that started in better positions. In this report, whenever beta convergence is analysed, it is referred to as catching-up.
Direction of convergence
The report also considers the overall direction of convergence patterns: where convergence is accompanied by improvements in mean EU outcomes (increase in the mean for a maximisation indicator, such as employment rate, or decrease for a minimisation indicator, such as AROPE), this is defined as upward convergence. Where mean EU outcome deteriorates (decrease in the mean for a maximisation indicator and increase for a minimisation indicator), this is considered downward convergence. From an EU policy-making perspective, it is important to achieve upward convergence, i.e., improvement in average outcomes at EU level accompanied by reduced geographical disparities:
A2.2. Regional convergence
Chart A2.1
Convergence patterns of economic gains differed across NUTS2 regions
GDP per capita in EUR and their cross-regional variation (measured by standard deviation and coefficient of variation, hence adjusted by average EU GDP), EU-NUTS2
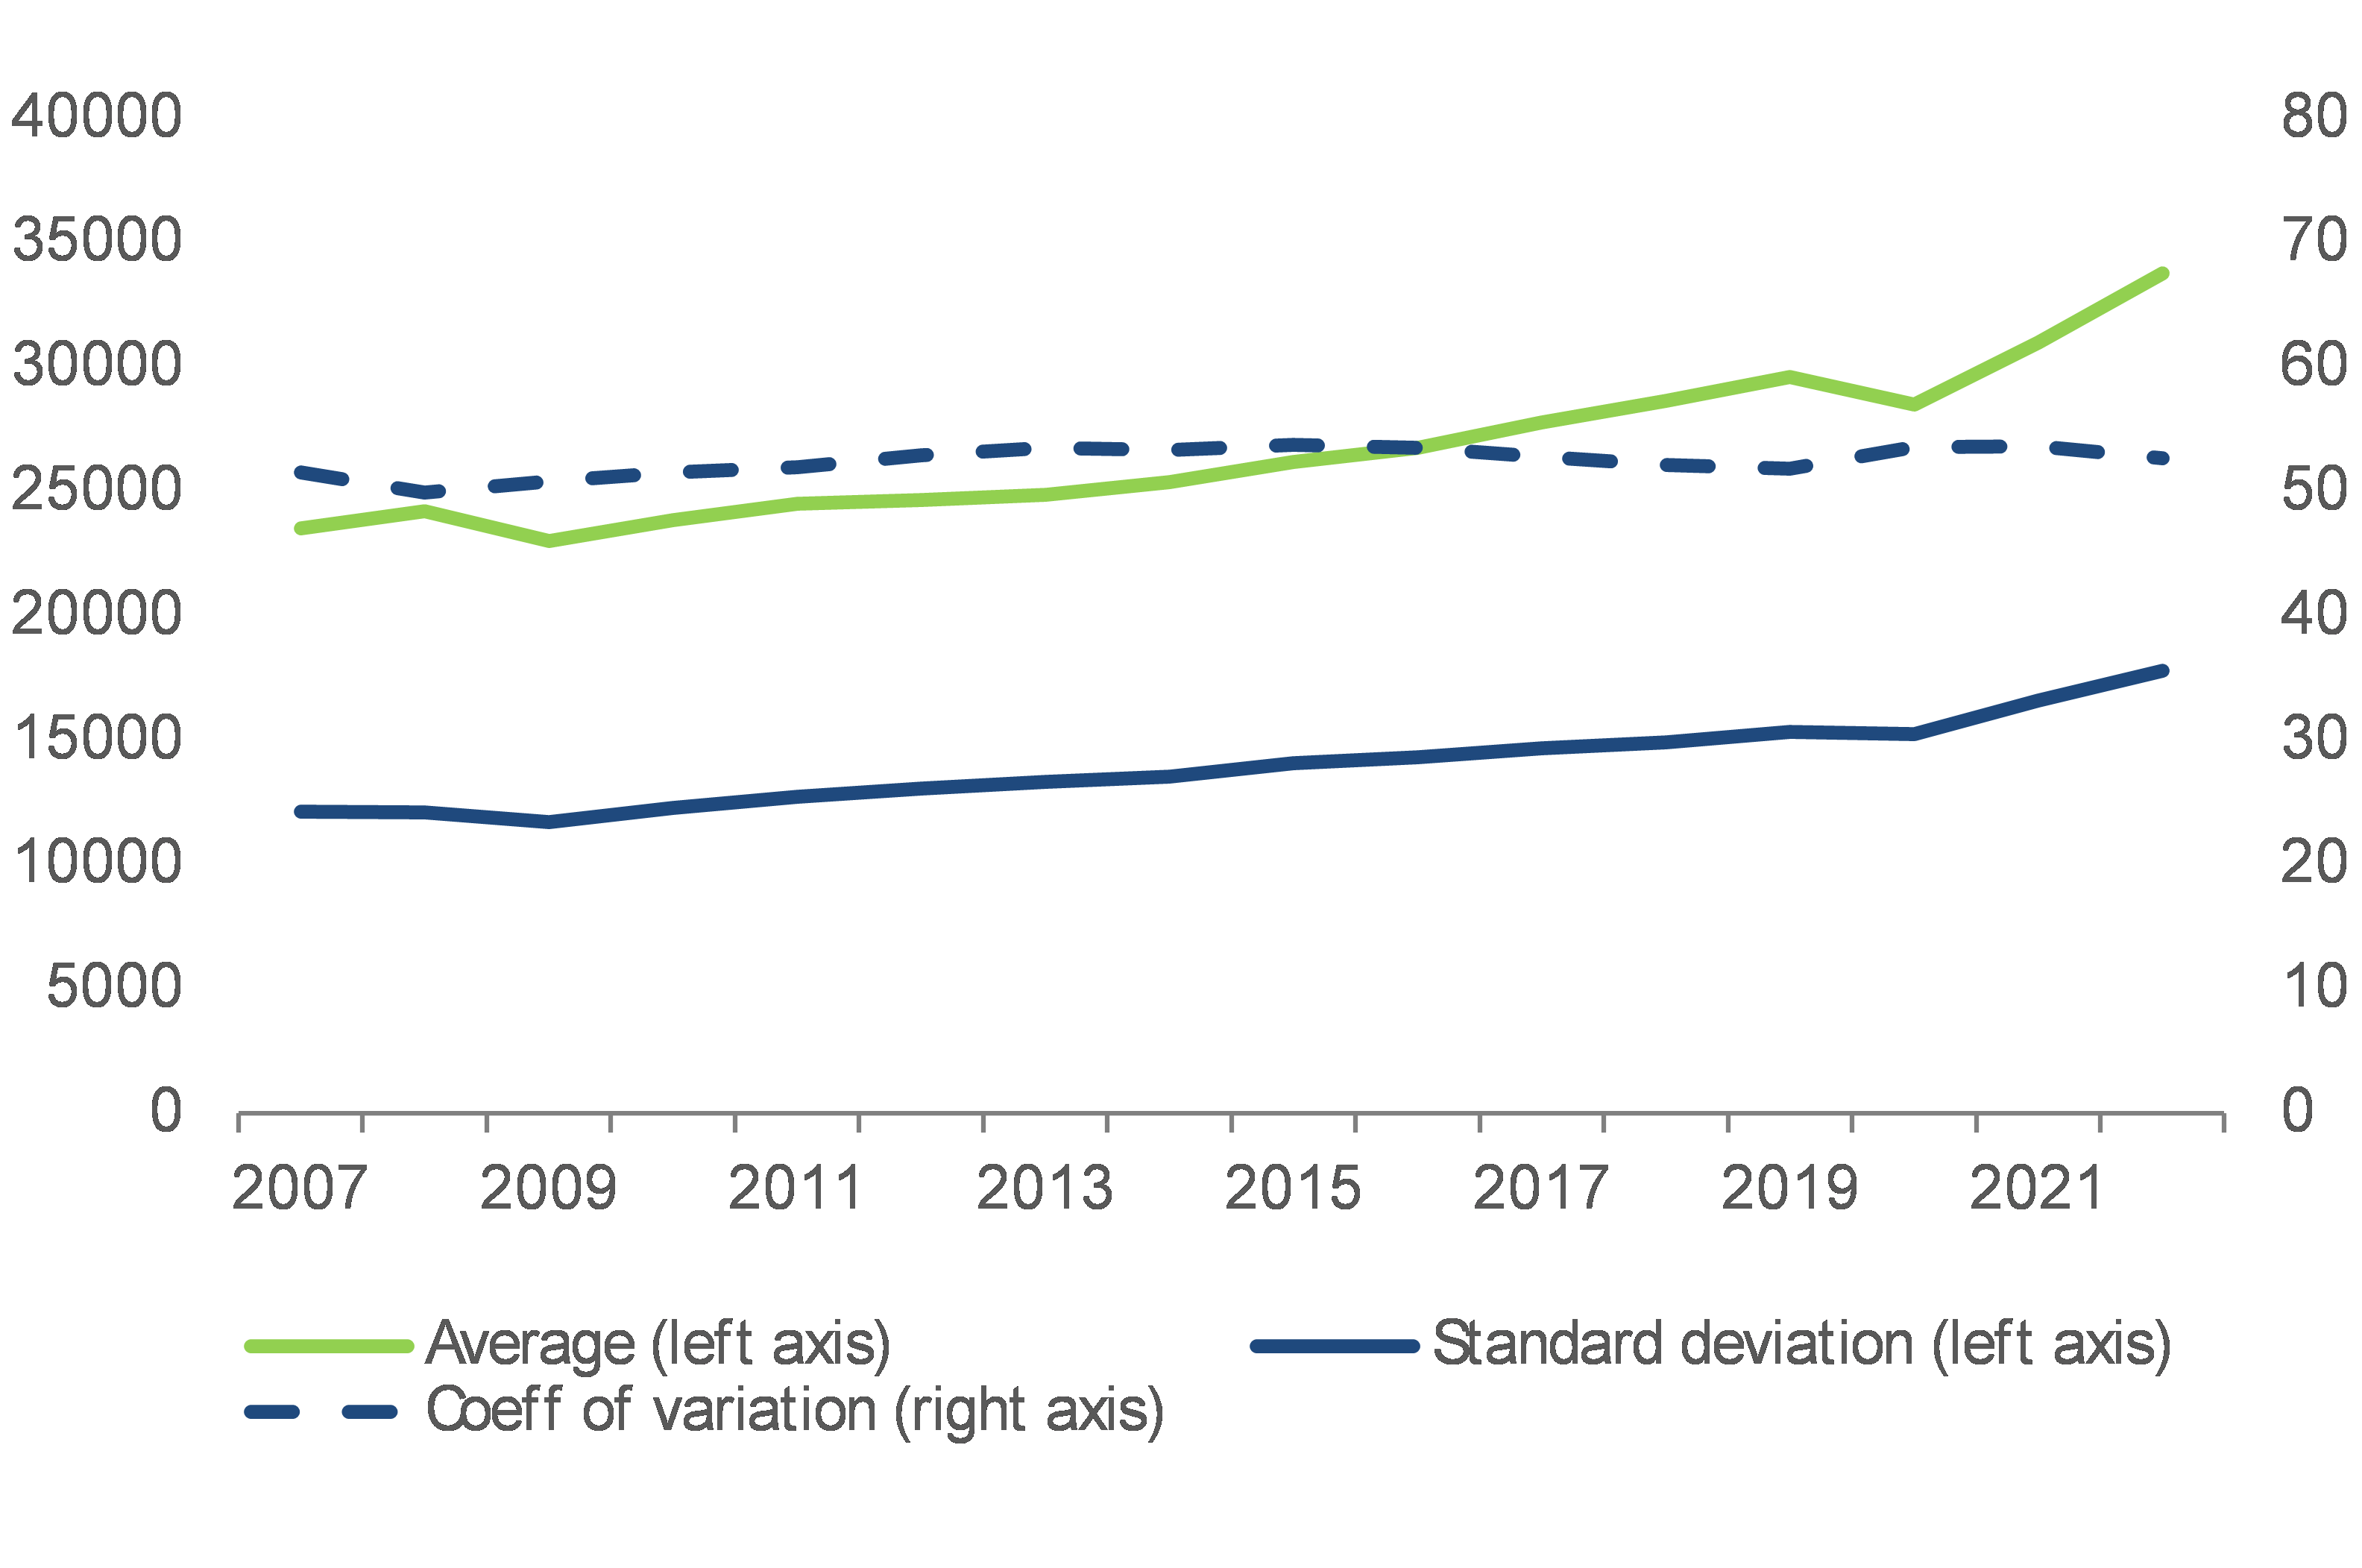
Note: Standard deviation is a measure of cross-regional variation, the higher the standard deviation, the higher the cross-regional variation. The EU average levels are unweighted values representing an average NUTS2 region.
Source: DG EMPL calculations based on Eurostat dataset nama_10r_2gdp
Chart A2.2
Since 2014 regional labour market outcomes improved, accompanied by convergence
Employment rate, % of population 20-64, unemployment rate, % of labour force 15-74, young people neither in employment nor in education and training (NEET), % of population 15-29, and their cross-regional variation (measured by standard deviation), EU-NUTS2
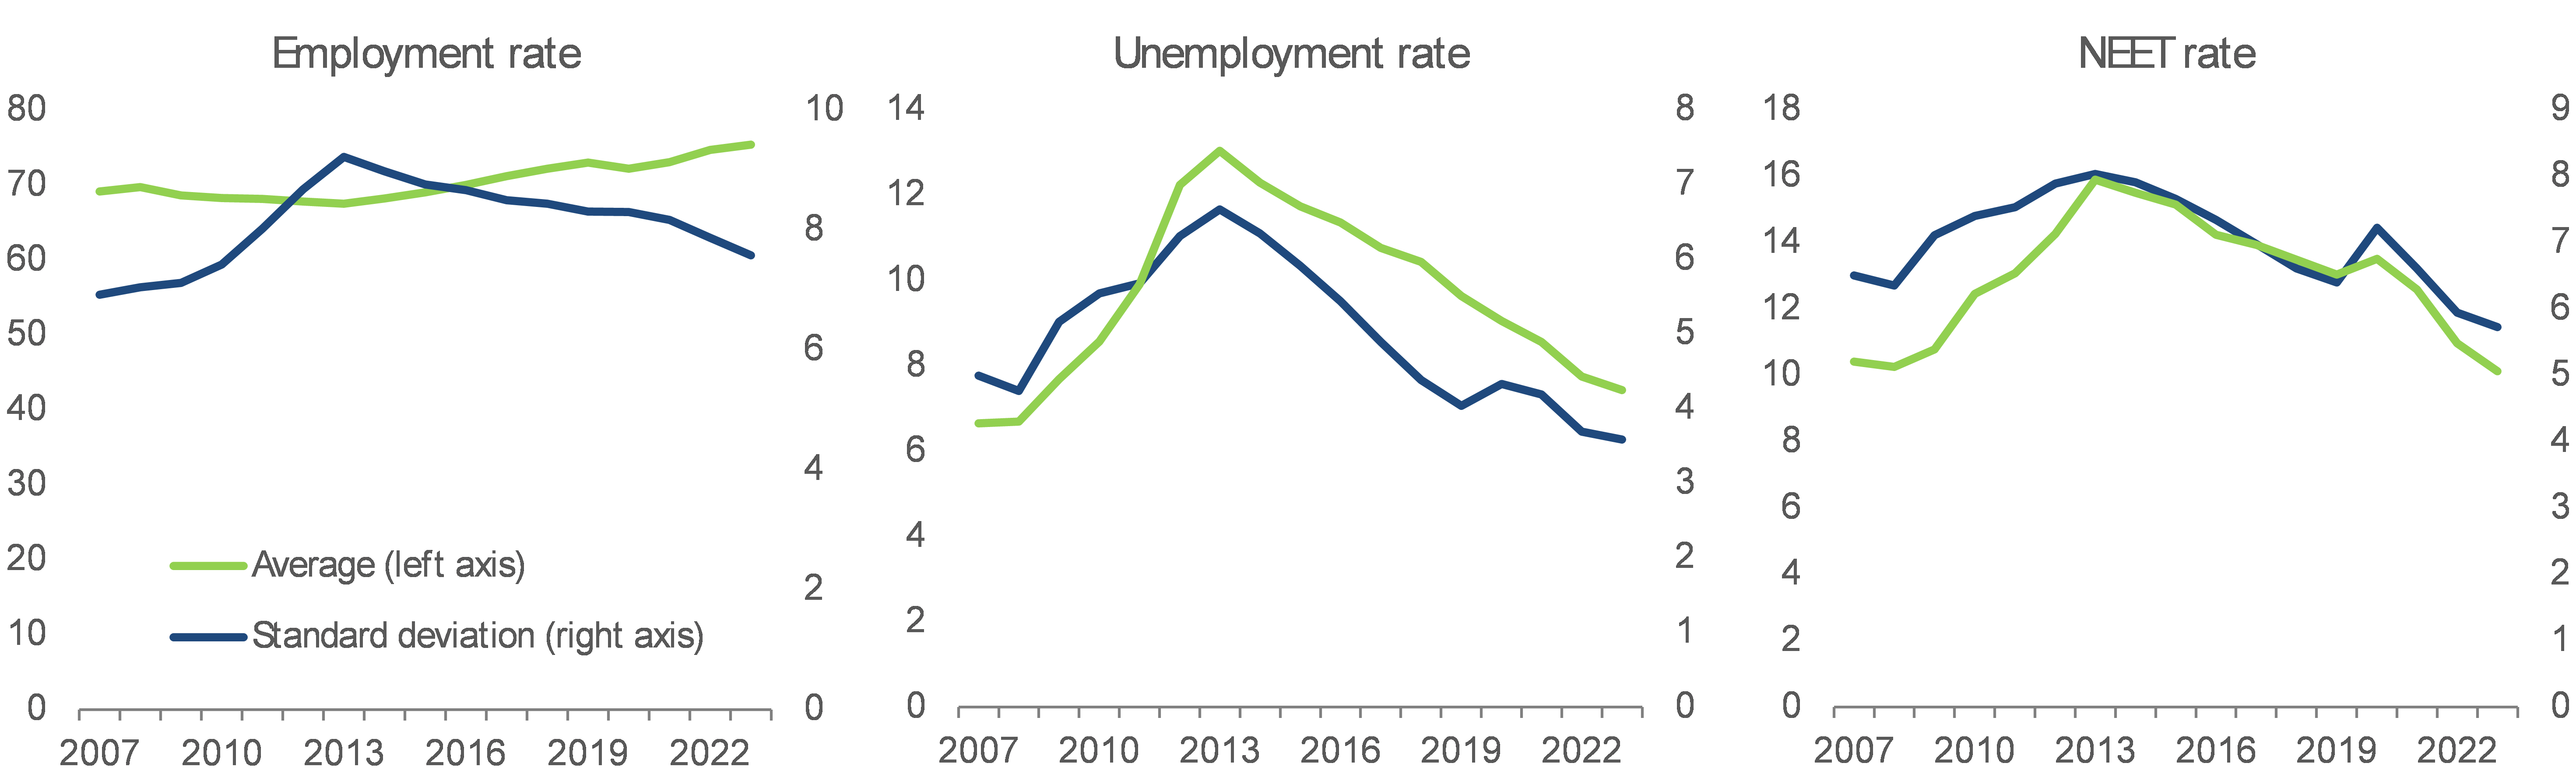
Note: Standard deviation is a measure of cross-regional variation, the higher the standard deviation, the higher the cross-regional variation. The EU average levels are unweighted values representing an average NUTS2 region.
Source: DG EMPL calculations based on Eurostat datasets lfst_r_lfe2emprt, lfst_r_lfu2gan and edat_lfse_38
Table A2.1
Catching-up of worst performing regions between 2007-2023
Beta-convergence patterns and regression coefficients at national level, by indicator

Note: Statistically significant logarithmic regressions coefficients marked in green, with coefficient in brackets. *GDP per capita data is only available until 2022.
Source: DG EMPL calculations based on Eurostat data