
2. Analysis of socioeconomic convergence at eu level
2.2. Convergence of labour market outcomes and skills supply
Since 2014, the labour market has performed strongly but sizeable differences persist across countries and regions (Figure 2.1). Following a downturn between 2008 and 2013 due to the economic and financial crisis, (70) the EU employment rate increased from 67.6 % in 2014 to 75.3 % in 2023 (Chart 2.2). Unemployment started to decline in 2014 (11 %) and fell to 6.1% in 2023 (71). Outcomes for young people, aged 15-24, followed a similar pattern, with the youth unemployment rate steadily decreasing from 24.1 % in 2014 to 14.5 % in 2023, and the NEET rate declining from 16% in 2014 to 11.2% in 2023. The employment rate of older workers (aged 55-64) improved from 49.7% to 63.9% during the same period. As regards cross-country variation, in 2023, five Member States had already reached or exceeded their national employment rate targets. (72) Employment rates varied from 66% in some southern Member States to around 80% in most northern and western Member States. Unemployment of people aged 15-74 ranged from 2.6 % to 12%, while unemployment rates for young people aged 15-24 ranged from 6% to almost 29%. NEET rates ranged from almost 5% to 19%.
Over the last decade, labour market outcomes have displayed broad upward convergence. Since 2014, improvements in employment, unemployment (including among young people) and NEET rates were accompanied by decreasing national and regional variation (Chart 2.2), leading to upward convergence in labour market outcomes. Employment rates of older people converged upwards as well (Chart A2.2 in Technical annex). Convergence in real wages differs according to the type of measurement: absolute differences in wages have largely remained stable since 2007 (Chart 2.3), but relative differences across countries have decreased, showing upward convergence. (73)
Figure 2.1
Differences in employment rates across EU regions remain sizable
Employment rate (% of people aged 20-64) by NUTS2 regions, 2023

Source: Eurostat, [lfst_r_lfe2emprtn], IMAGE Interactive map generator
Convergence of labour market outcomes was only temporarily interrupted by the COVID-19 pandemic. In 2021, the labour market had already bounced back due to short-time work schemes and other exceptional support measures. This was a much quicker recovery than after the 2008 financial crisis, which led to a divergence of labour market outcomes until 2014. Since then, the average performance of countries and regions has improved with national and regional differences beginning to narrow (Chart 2.2). While improvements in employment were quickly evident, reductions in (youth) unemployment and NEET rates took longer to materialise, reaching pre-2008 values only in 2018. Overall, the impact of the 2008 financial crisis on disparities in regional overall employment rates was more severe and protracted than at national level, with regional differences remaining above 2007 levels in 2022 (Chart A2.2 in Technical annex).
Chart 2.2
Labour market outcomes have improved since 2014, accompanied by convergence
Employment rate (% of population aged 20-64), unemployment rate (% of population in the labour force aged 15-74), youth unemployment rate (% of labour force aged 15-24), young people neither in employment nor in education and training (NEET) (% of population aged 15-29), and their cross-country variation (measured by standard deviation), 2007-2023, EU-27

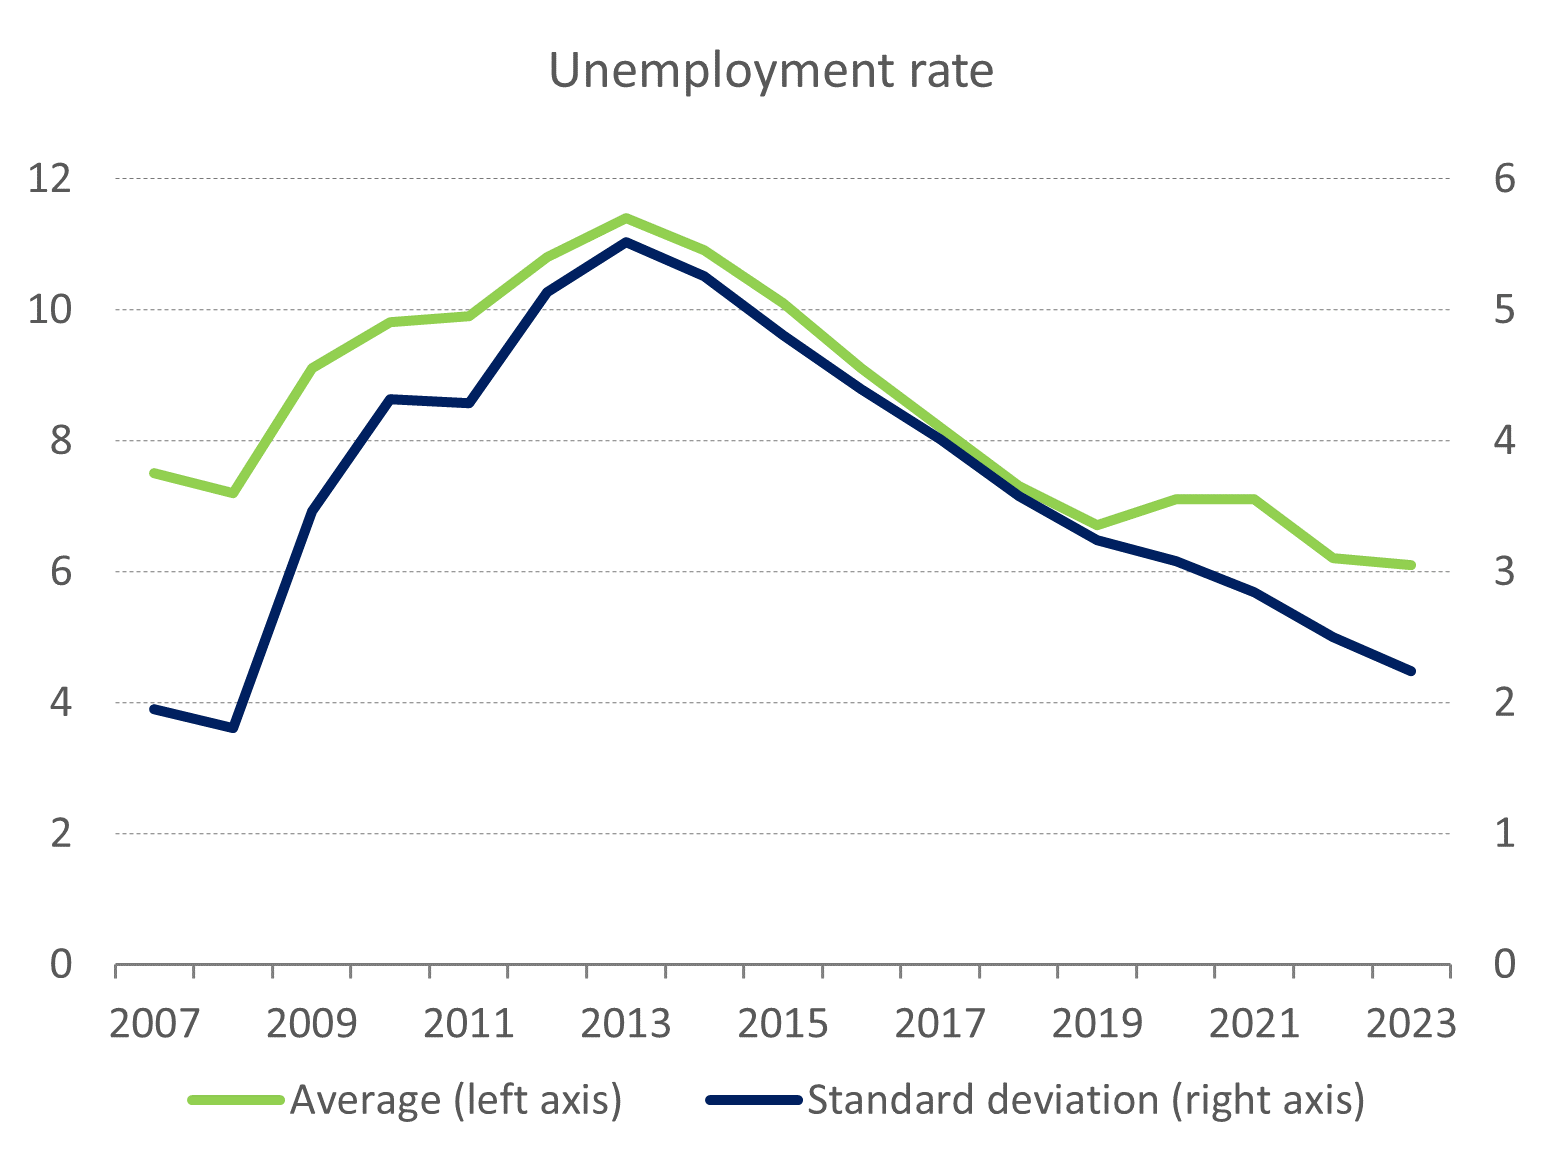
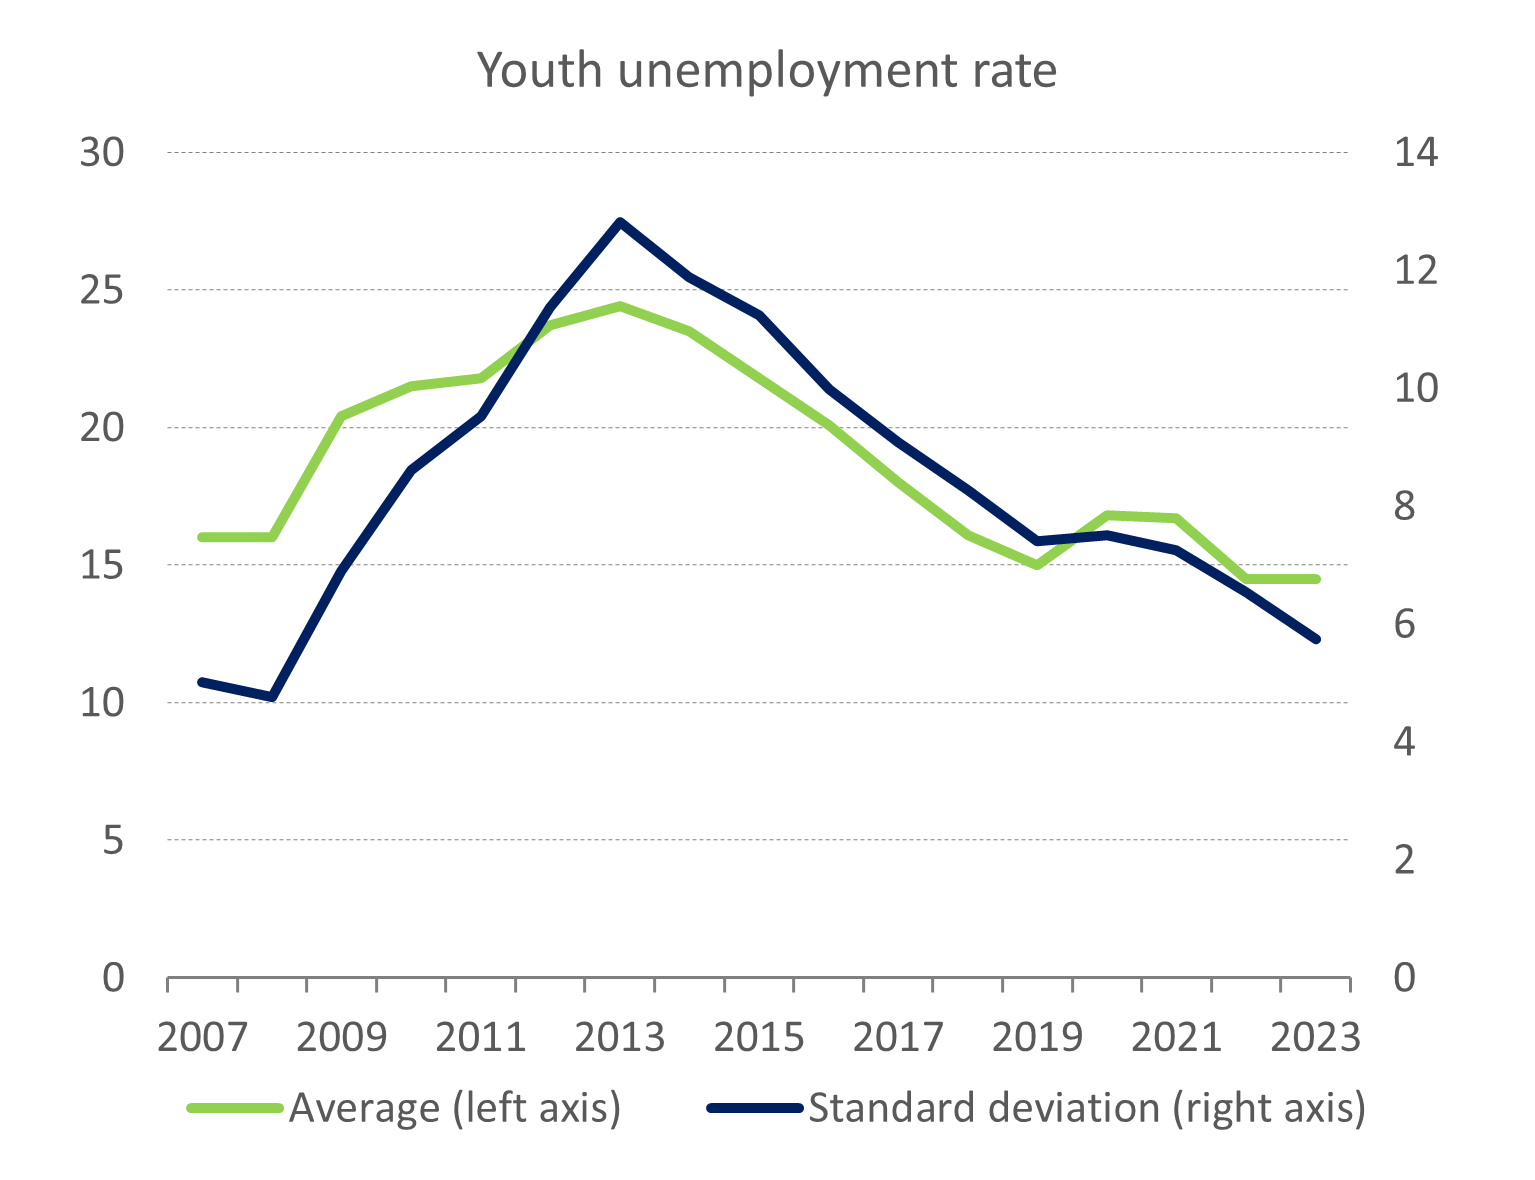
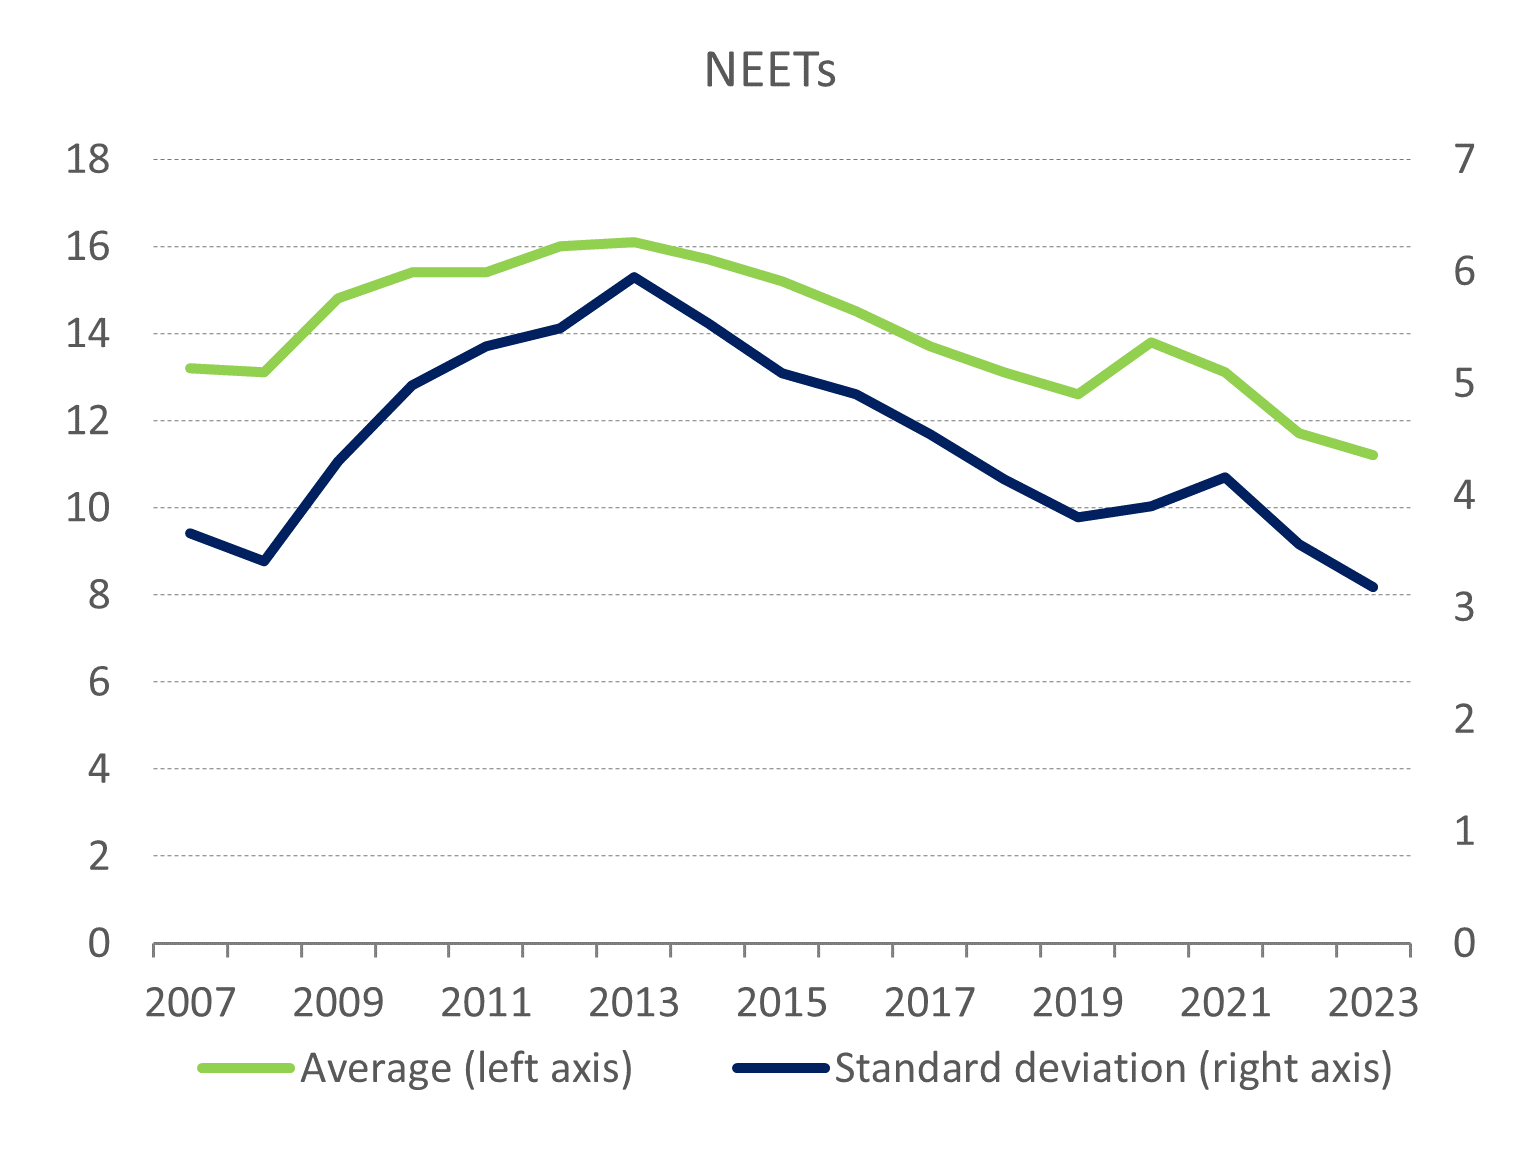
Note: Estimations based on employment rate of age group 20-64, unemployment rate of age group 15-74, and youth unemployment rate of age group 15-24. EU average levels are weighted values. Indicators differ from the Social Scoreboard main indicators in terms of EU average levels. Indicators were selected to allow visualisation of a wider time period before 2009. Standard deviation is a measure of cross-country variation, the higher the standard deviation, the higher the cross-country variation.
Source: DG EMPL calculations based on EU Labour Force Survey (EU-LFS) datasets lfsa_ergan, lfsa_urgan, edat_lfse_20
Chat 2.3
Cross-country differences in real wages decreased in the longer term
Real compensation per employee (PPS) and cross-country variation (measured by standard deviation and coefficient of variation), 2021-2022, EU-27
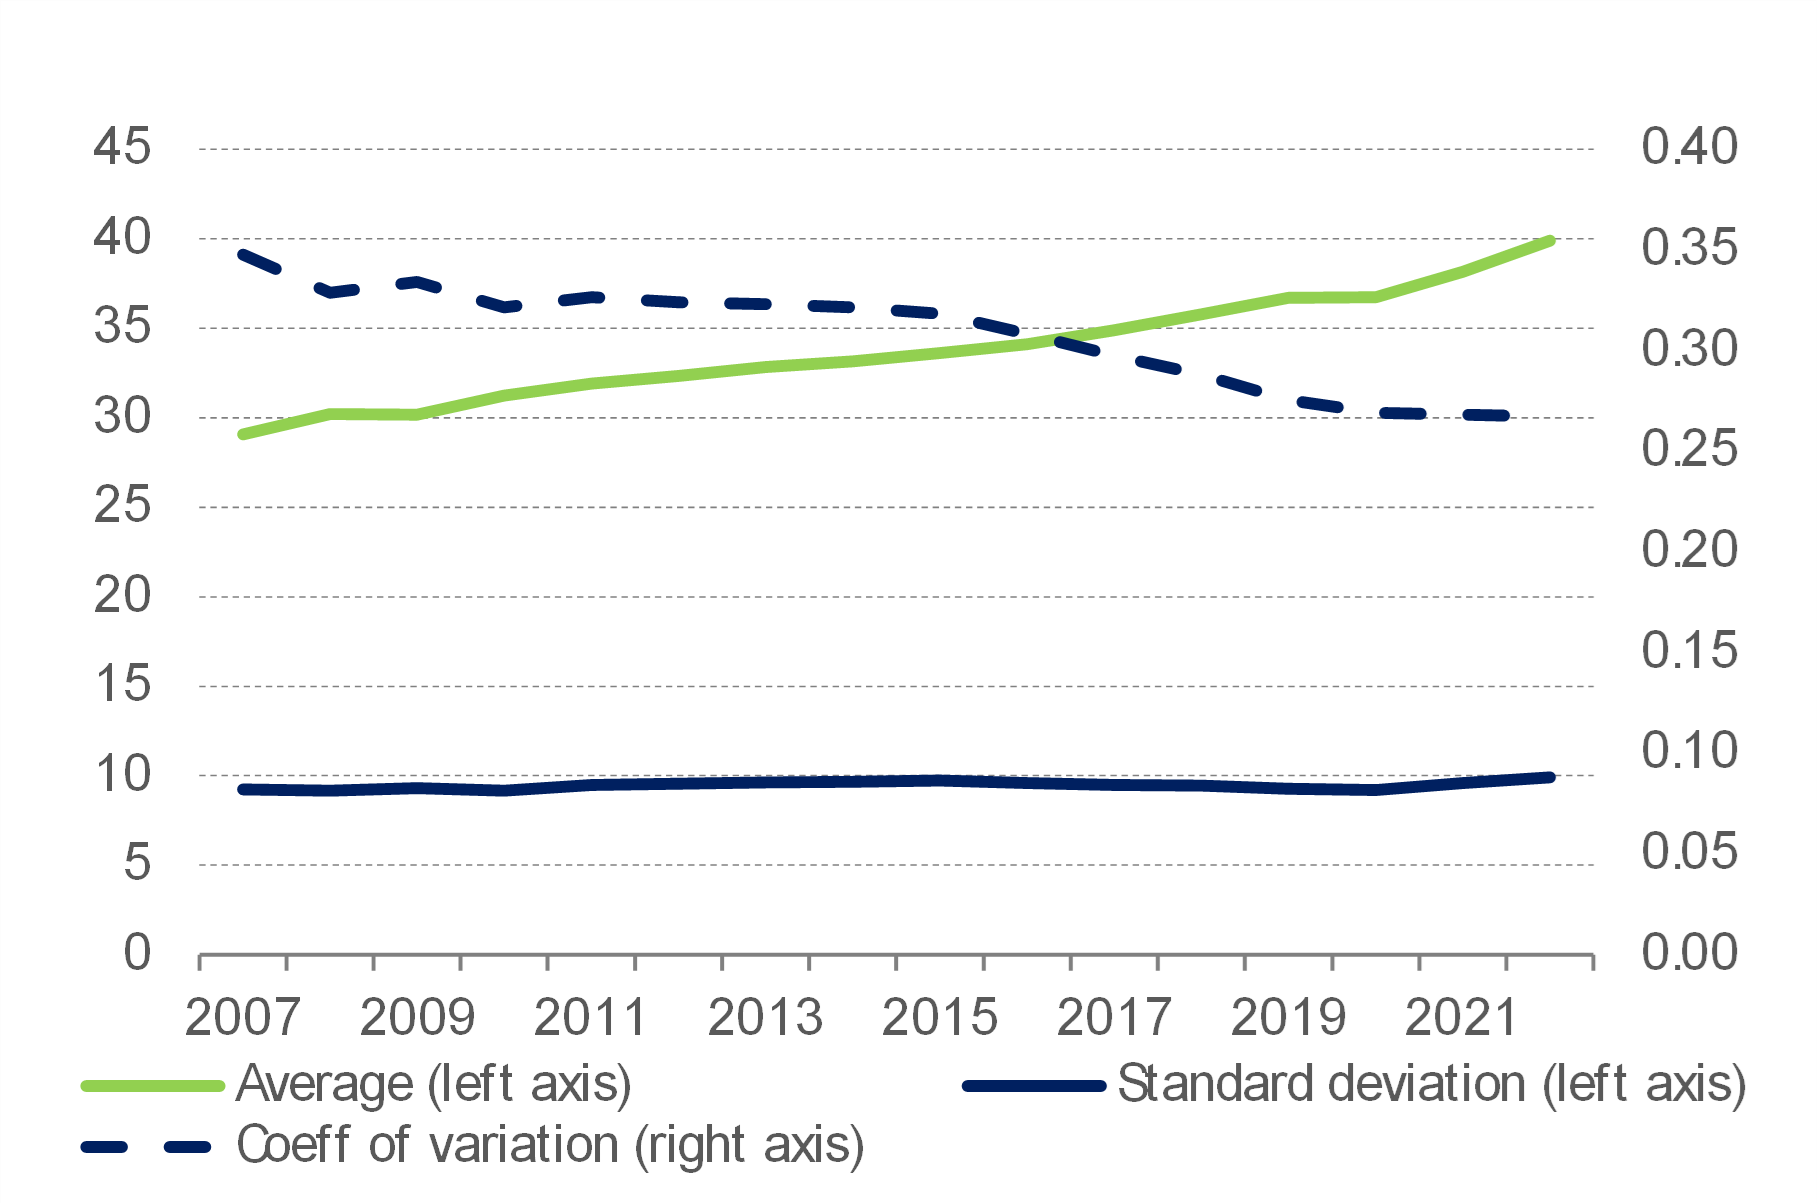
Note: Standard deviation is a measure of cross-country variation, the higher the standard deviation, the higher the cross-country variation.
Source: Annual macroeconomic database of the European Commission Directorate-General for Economic and Financial Affairs (AMECO).
Cross-country and regional variations in labour market performance are linked to a number of factors, including differences in human capital development. Participation in learning is one of the factors linked to employability, adoption of advanced technologies, (74) and production of high-value goods. Widening gaps in skill development suggest increasing variation in the supply of skilled workers. In the last decade, labour and skills shortages increased in the EU, driven by demographic changes, substantial job growth due to the green and digital transitions, as well as changing skill requirements, and poor working conditions. (75) This may exert pressure on the labour market, creating more potential for employment in lagging regions, and consequently catching up in labour market outcomes.
Chart 2.4
Increasing disparities in skills supply create further risks for the labour market
Tertiary education attainment and adult participation in learning (last 4 weeks) (% of population aged 30-34), and cross-country variation (measured by standard deviation), 2007-2023, EU-27
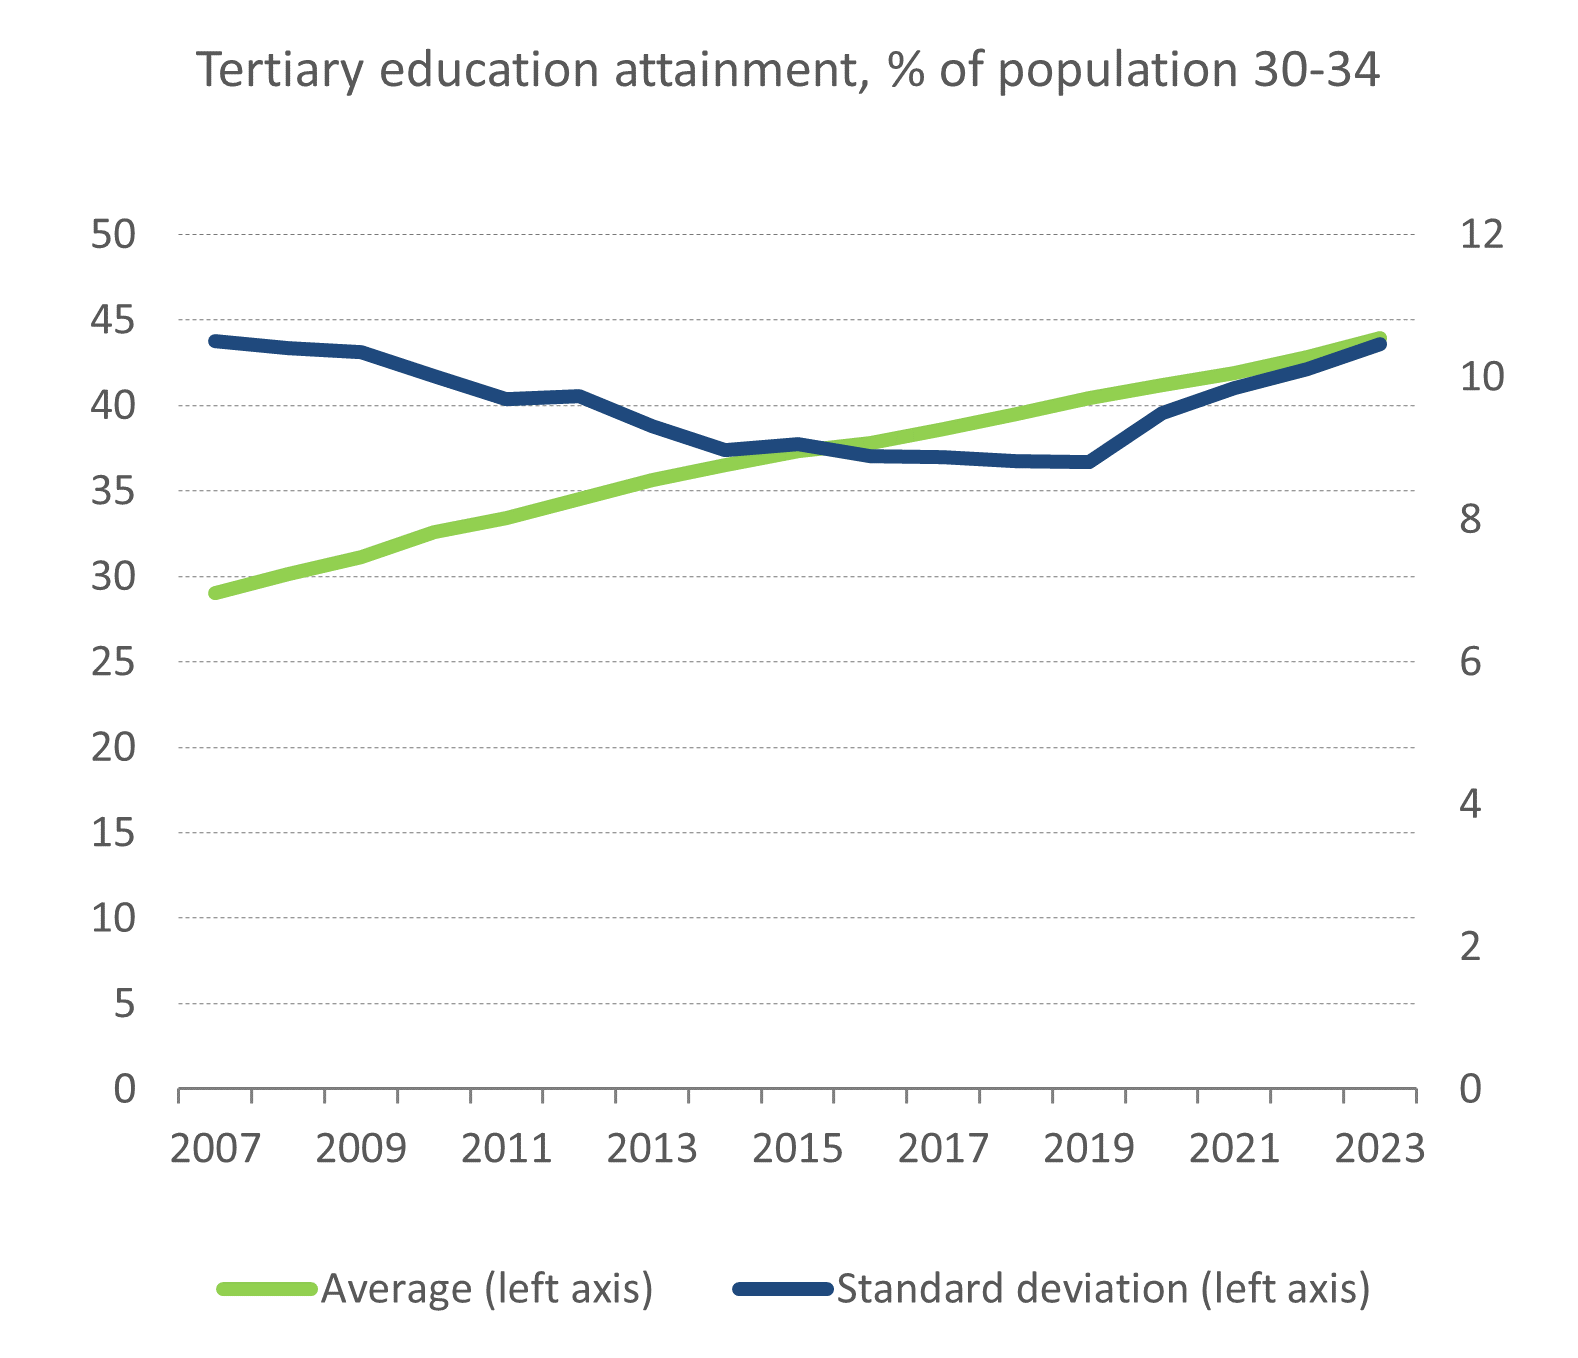

Note: Standard deviation is a measure of cross-country variation, the higher the standard deviation, the higher the cross-country variation. EU average levels are weighted values.
Source: DG EMPL calculations based on Eurostat datasets trng_lfse_01, edat_lfse_03.
Tertiary education attainment has grown considerably, although disparities between countries are stable in the long term. The share of population aged 30-34 attaining tertiary education in the EU grew considerably, from 29% in 2007, to 36.5 % in 2014, and 43.9 % in 2023 (Chart 2.4) (76). After declining until 2013 and stabilising between 2014 and 2019, disparities started to increase again in 2020. Member States in central and eastern Europe perform below the EU average, while those in north and western Europe rank highest, with overall EU rates varying from 22.8% to 66% in 2023. The convergence after the 2008 financial crisis may be partly linked to the resilience of employment in some high-skilled occupational groups. (77) Growing job insecurity during that period led to an increasing demand for higher education as an alternative to employment. (78)
Regional variation in tertiary education attainment increased, contrasting with stability in national disparities. Regional disparities did not change much between 2007 and 2015 but have since started to grow steadily (Chart 2.5). In 2023, tertiary education attainment exceeded 50% in approximately 50 regions covering more than half of the Member States (while it ranged from 28% to 48% in the majority of EU NUTS2 regions, Figure 2.2). These were often the capital regions of these countries, whose exceptionally high shares of tertiary graduates contributed to high variation across regions. Having tertiary education was also considerably more common in regions with a higher rather than lower GDP per capita (12 pp difference). (79) By contrast, about four in five regions in Bulgaria, Czechia, Portugal and Romania had tertiary education attainment below 30%. The persistence of regional differences in tertiary education attainment raises concerns about potential talent development traps in regions lacking a qualified workforce capable of enhancing productivity. This is an important challenge to balance regional development, as highlighted in the European Commission’s recent Communication on Harnessing Talent in Europe’s Regions. (80)
Chart 2.5
Growing disparities in skill supply pose challenges to regional development
Tertiary education attainment and adult participation in learning (last 4 weeks) (% of population aged 30-34), and cross-regional variation (measured by standard deviation), 2007-2023, EU-NUTS2


Note: Standard deviation is a measure of cross-regional variation, the higher the standard deviation, the higher the cross-regional variation.
Source: DG EMPL calculations based on Eurostat datasets edat_lfse_04, trng_lfse_04..
Figure 2.2
Regional variation in tertiary education attainment ranged from 28-48% in most NUTS2 regions
Tertiary educational attainment, 2023 (% of people aged 30-34), NUTS 2 regions
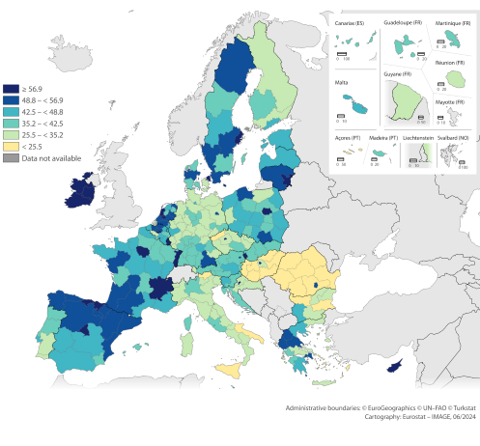
Note: Tertiary educational attainment (% of people aged 30-34) by NUTS2 regions, 2023.
Source: Eurostat, edat_lfse_04 IMAGE Interactive map generator.
While participation in adult learning improved somewhat at the EU level, disparities increased including in relation to the development of basic digital skills. The indicator for adult learning participation (over the last four weeks) stood at 7.9% in 2007, increasing to 10.1% in 2014, and 12.8% in 2023. (81) However, differences in national (and regional) participation rates widened, ranging from 1.4% to 38.8% in 2023 (Chart 2.4). Adult participation rates tended to be higher in northern and western EU regions and in regions with higher GDP per capita (around 14% for both) compared to eastern EU and regions with lower GDP per capita (around 8% for both). Evidence points to slightly increasing cross-country disparities between Member States in the development of basic digital skills. (82) This is particularly important in the context of growing digitalisation and digital intensity of jobs and the existing gender gaps. (83) There was some increase in the share of people with basic or above-basic digital skills (from 53.9% in 2021 to 55.6 in 2023). However, differences across countries are sizeable, ranging from 28% to 83%.
On average, countries and regions with poorly performing labour markets and lower participation in adult learning have somewhat caught up with those with better outcomes (Table 2.1). In 2014-2023, Greece, Spain and Croatia experienced more rapid improvements in employment than other Member States, and several countries also experienced quick reductions in unemployment, including among young people (Greece, Spain, Croatia, Italy, Cyprus, Portugal) and NEET rates (Bulgaria, Greece, Spain, Croatia, Italy). For youth unemployment rate, the catching-up during the 2014-2023 period was not strong enough to compensate for the lack of convergence between 2007 and 2014, and thus there was no catching-up effect over the whole 2007-2023 period. Catching-up in adult learning participation and tertiary attainment was more rapid during the financial crisis than in other periods. While this catching-up continued during 2014-2023 for adult learning (notably due to improvements in Hungary, Poland, Romania, and Slovakia), there is no significant evidence of catching-up in tertiary attainment levels. The regional catch-up effects between 2007 and 2023 are broadly comparable with those observed at national level (Table A2.1 in Technical annex), albeit of weaker magnitude in some cases (employment and unemployment rates).
Table 2.1
Prominent catching-up of worst performing countries, especially between 2014-2023
Beta-convergence patterns and regression coefficients at national level, by indicator, 2007-2023

Note: Statistically significant logarithmic regressions coefficients in green, with coefficient in brackets. *AROPE rate estimations correspond to 2007-2014 and 2015-2023 time periods, in order to capture definition and recalculations of the old (pre-2014) and new (since 2015) indicator. Healthy life years indicator is available until 2022. 2014-2022 estimates shown for GDP per capita, GDHI, and healthy life years (men and women).
Source: DG EMPL calculations based on Eurostat data. The full list of indicators are available in chart notes across section 2.
Notes
- 70.Eurostat dataset used to monitor the EU 2030 employment target (lfsi_emp_a) is limited to 2009-2022. A historical dataset for employment rates is used to show earlier data points (lfsa_ergan). The historical data shows that the employment rate in 2008 was 69.5%, decreasing to 75.3% in 2023.
- 71.For the overview of general unemployment rate trends in the text the Eurostat data code une_rt_a is used.
- 72.The national targets are available here.
- 73.The difference in the two measures is that changes in the coefficient of variation might be led by changes in the average level of the indicator, suggesting upward convergence across countries, rather than changes in the standard variation which would point to a convergence of wage distribution.
- 74.(World Bank, 2018).
- 75.(European Commission, 2024b).
- 76.In order to ensure consistency across the analysis, the figures refer to the Social scoreboard indicator tertiary education attainment as % of population aged 30-34, and not the EU target indicator, which considers the age bracket 25-34. Trends in standard deviations of the indicator follow similar pattern for both of the age brackets.
- 77.(European Centre for the Development of Vocational Training (Cedefop), 2011).
- 78.(Kärkkäinen, 2010), (Douglas, 2010).
- 79.(European Commission, 2024b).
- 80.Read Communication press release here.
- 81.Analysis refers to the European Pillar of Social Rights Social Scoreboard indicator of adult participation in learning in the past 4 weeks (LFS) and not to the adult participation in learning in the last 12 months (Adult Education Survey (AES)) indicator that monitors the EU 2030 adult learning target. Unlike the EU 2030 adult learning target, the LFS indicator referring to the past 4 weeks provides more data points, enabling analysis of cross-country variations over time.
- 82.The digital skills indicator in the Social Scoreboard has been revised: the new indicator includes two reference points, 2021 and 2023.
- 83.In 2023, more women, aged 16-44, had at least basic digital skills than men in the same age groups. Among the older people aged 45 or over, the trend is reverse (based on Eurostat indicator isoc_sk_dssk_i21 and Eurostat Statistics Explained article).