
2. Analysis of socioeconomic convergence at eu level
This section provides a brief assessment of convergence in key socioeconomic outcomes, examining selected headline indicators of the EU Social Scoreboard. (61) It analyses convergence in economic performance and living standards, labour market outcomes, skills supply, and social outcomes. To assess convergence across countries and regions (at NUTS 2 level) over time, it relies on methodological approaches centred on reduction in national and regional disparities, defined as sigma convergence, and catching-up of worse performers, defined as beta convergence (see part A2.1. and A2.2. of the Technical annex). (62) For each indicator, the analysis looks at convergence across all Member States and, where data allow (63), across all sub-national regions. (64) Unless regional results differ significantly from national results at EU level, tables and charts with regional results are presented in part A2.2. of the Technical annex. The analysis covers developments since 2007, (65) primarily 2014-2023 because 2014 marked the end of the period most directly affected by the 2008 financial crisis and the associated, well-documented setbacks to convergence in the EU. (66)
2.1. Convergence of economic outcomes and living standards
Over the last decade, GDP per capita increased at a faster pace than in previous years. GDP per capita in Purchasing Power Standard (PPS) grew from EUR 26 632 to EUR 35 616 between 2014 and 2022 (Chart 2.1)(67), with the impacts of the COVID-19 pandemic proving temporary and limited. In 2022, the top three countries in the EU had GDP levels above EUR 46 000 per capita, while the bottom three had GDP per capita levels below EUR 24 000. In terms of regional disparities, GDP has tended to be lower in eastern and southern regions (less than 80% and around 85% of EU average GDP per capita, respectively) compared to northern and western regions (around 120%).
Growth in real household incomes reflected improved standards of living. Real gross domestic household income (GDHI) rose by 11.8%, from EUR 15 450 per capita in 2014 to EUR 17 283 per capita in 2022 (Chart 2.1). This was accompanied by growth in net wealth over the period (Box 2.1). The impact of the COVID-19 pandemic on income growth was limited, largely due to automatic stabilisers and the income support measures adopted in the Member States. Still, cross-country variation of GDHI per capita remained substantial in 2022, ranging from EUR 9 300 to EUR 35 300.
These improvements in GDP per capita have resulted in some convergence of economic gains across Member States and regions. Over the long-term, cross-country variation in GDHI has decreased, pointing to convergence across Member States, while both national and regional variation of GDP per capita remained rather stable (Chart 2.1).(68) However, after 2014, GDP per capita variation decreased in relative terms (i.e. adjusted for average EU GDP growth), but not strongly enough to create convergence in absolute differences across Member States (i.e. not adjusted for changes in EU GDP average; Chart 2.1 and Chart A2.1 in Technical annex). As such, the results of the two measurements lead to rather ambiguous convergence results. Differences increased after 2020, suggesting uneven impacts of the COVID-19 pandemic and subsequent inflationary pressures on economic growth. Convergence trends in GDP per capita measured in EUR and in purchasing power standard (PPS) are the same, with slightly different magnitude.
Strong GDP per capita and household income growth in central and eastern European countries tend to support upward convergence at EU level. Some Eastern countries and regions that started at lower GDP per capita and household income levels experienced strong increases since 2014, supporting a mild catching-up effect in both GDP and household income (Table 2.1). For example, Bulgaria, Croatia, Poland, and Romania caught up in terms of GDP while Croatia, Hungary, Latvia and Lithuania caught up in terms of household income. Conversely, stagnation or decline in some southern regions and countries posed a challenge to upward convergence, especially for household income. These contrasting trends reflect underlying differences in productivity growth and investment dynamics, with eastern regions often registering high increases in productivity and investment, unlike many southern regions. They also reflect disproportionate impacts of economic shocks and other persisting structural challenges, notably quality of institutions and smooth functioning of the labour market. (69)
Chart 2.1
Convergence patterns of economic gains vary across the Member States
GDP per capita (EUR and PPS) and real GDHI per capita (EUR), and cross-country variation (measured by standard deviation and coefficient of variation, hence adjusted by average EU GDP), 2007-2022, EU-27


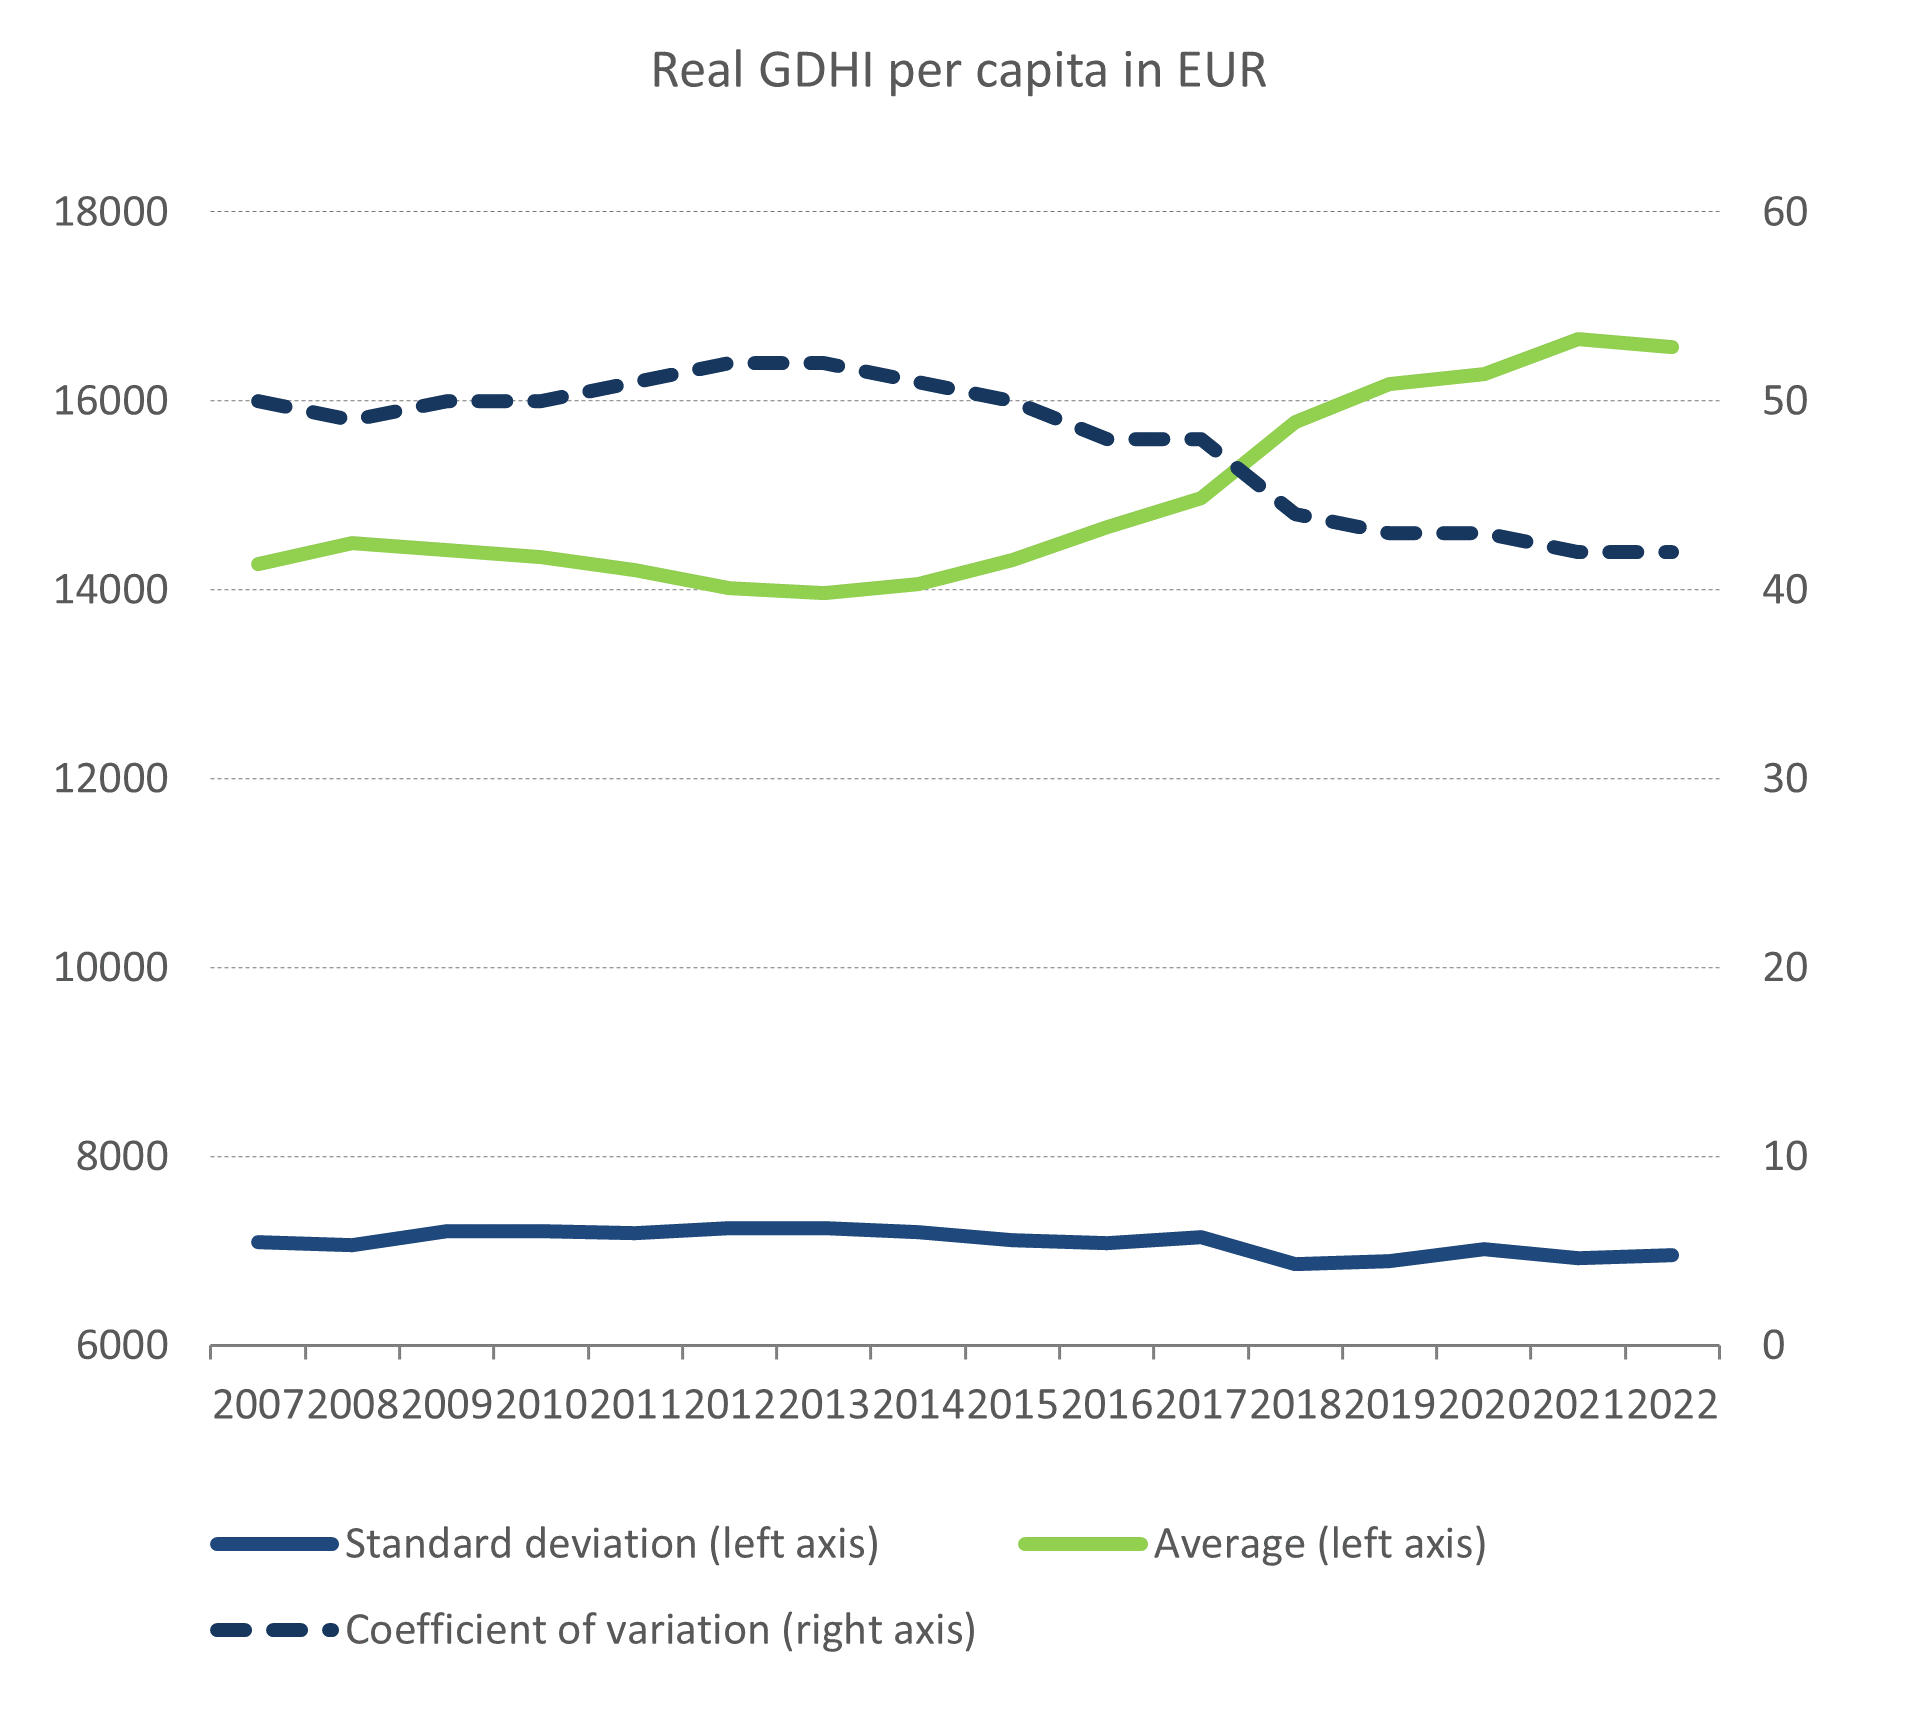
Note: GDHI data missing for Malta and Romania. Standard deviation is a measure of cross-country variation, the higher the standard deviation, the higher the cross-country variation. EU average levels are weighted values.
Source: DG EMPL calculations based on Eurostat datasets nama_10_pc, GDHI DG EMPL calculations
Box 2.1: Convergence in national wealth levels and distribution
Median net wealth was stable for most of the 2010s with disparities between countries declining (Chart 1). Between 2010 and 2017, there were only mild changes in median wealth across the 14 eurozone countries that participated in the Household Finance and Consumption Survey (HFCS), (1) accompanied by oscillating variation in wealth levels across countries. Higher saving rates and higher prices of certain assets (notably real estate) triggered throughout the COVID-19 pandemic resulted in an increase in net wealth in every country in the euro area, except for Finland. (2) That increase coincided with a drop in wealth disparity between countries. No post-COVID-19 household-level data on wealth are available to assess the durability of the changes during the pandemic.
Chart 1
Median wealth has increased on average in the euro area, with countries converging upwards
Average and standard deviation of median net wealth, 2010 – 2021, euro area

Notes: Median household net wealth in 2021 EUR purchasing power standard (PPS). Dispersion measured as standard deviation of log-transformed median wealth by country. Dark blue line includes the 14 countries participating in both wave 1 and wave 4 of the HFCS: Belgium, Germany, crGreece, Spain, France, Italy, Cyprus, Luxembourg, Malta, the Netherlands, Austria, Portugal, Slovakia, Finland. Light green line also includes Estonia, Ireland, Latvia, Hungary, Slovenia. Yellow line, includes Croatia and Lithuania, in addition to the 19 countries already listed above. Standard deviation is a measure of cross-country variation, the higher the standard deviation, the higher the cross-country variation.
Source: OECD calculations based on the Eurosystem Household Finance and Consumption Survey (HFCS), https://www.ecb.europa.eu/stats/ecb_surveys/hfcs/html/index.en.html.
Since 2014, net wealth grew for all income quintiles, benefitting mostly top earners. Increases in household net wealth were relatively modest between 2014 and 2017, with median wealth among the top fifth of earners (top quintile) recording the largest growth (15%). Between 2017 and 2021, median household net wealth grew over 20% for all income quintiles. In absolute terms, the top income quintile still benefitted most from this growth, increasing their net wealth by EUR 50,000 (PPS) between 2017 and 2021 (Chart 2)
Chart 2
Median net wealth grew across the income distribution between 2010 and 2021
Median household net wealth by income quintile, euro area average, 2021 USD PPP, 14 EU countries
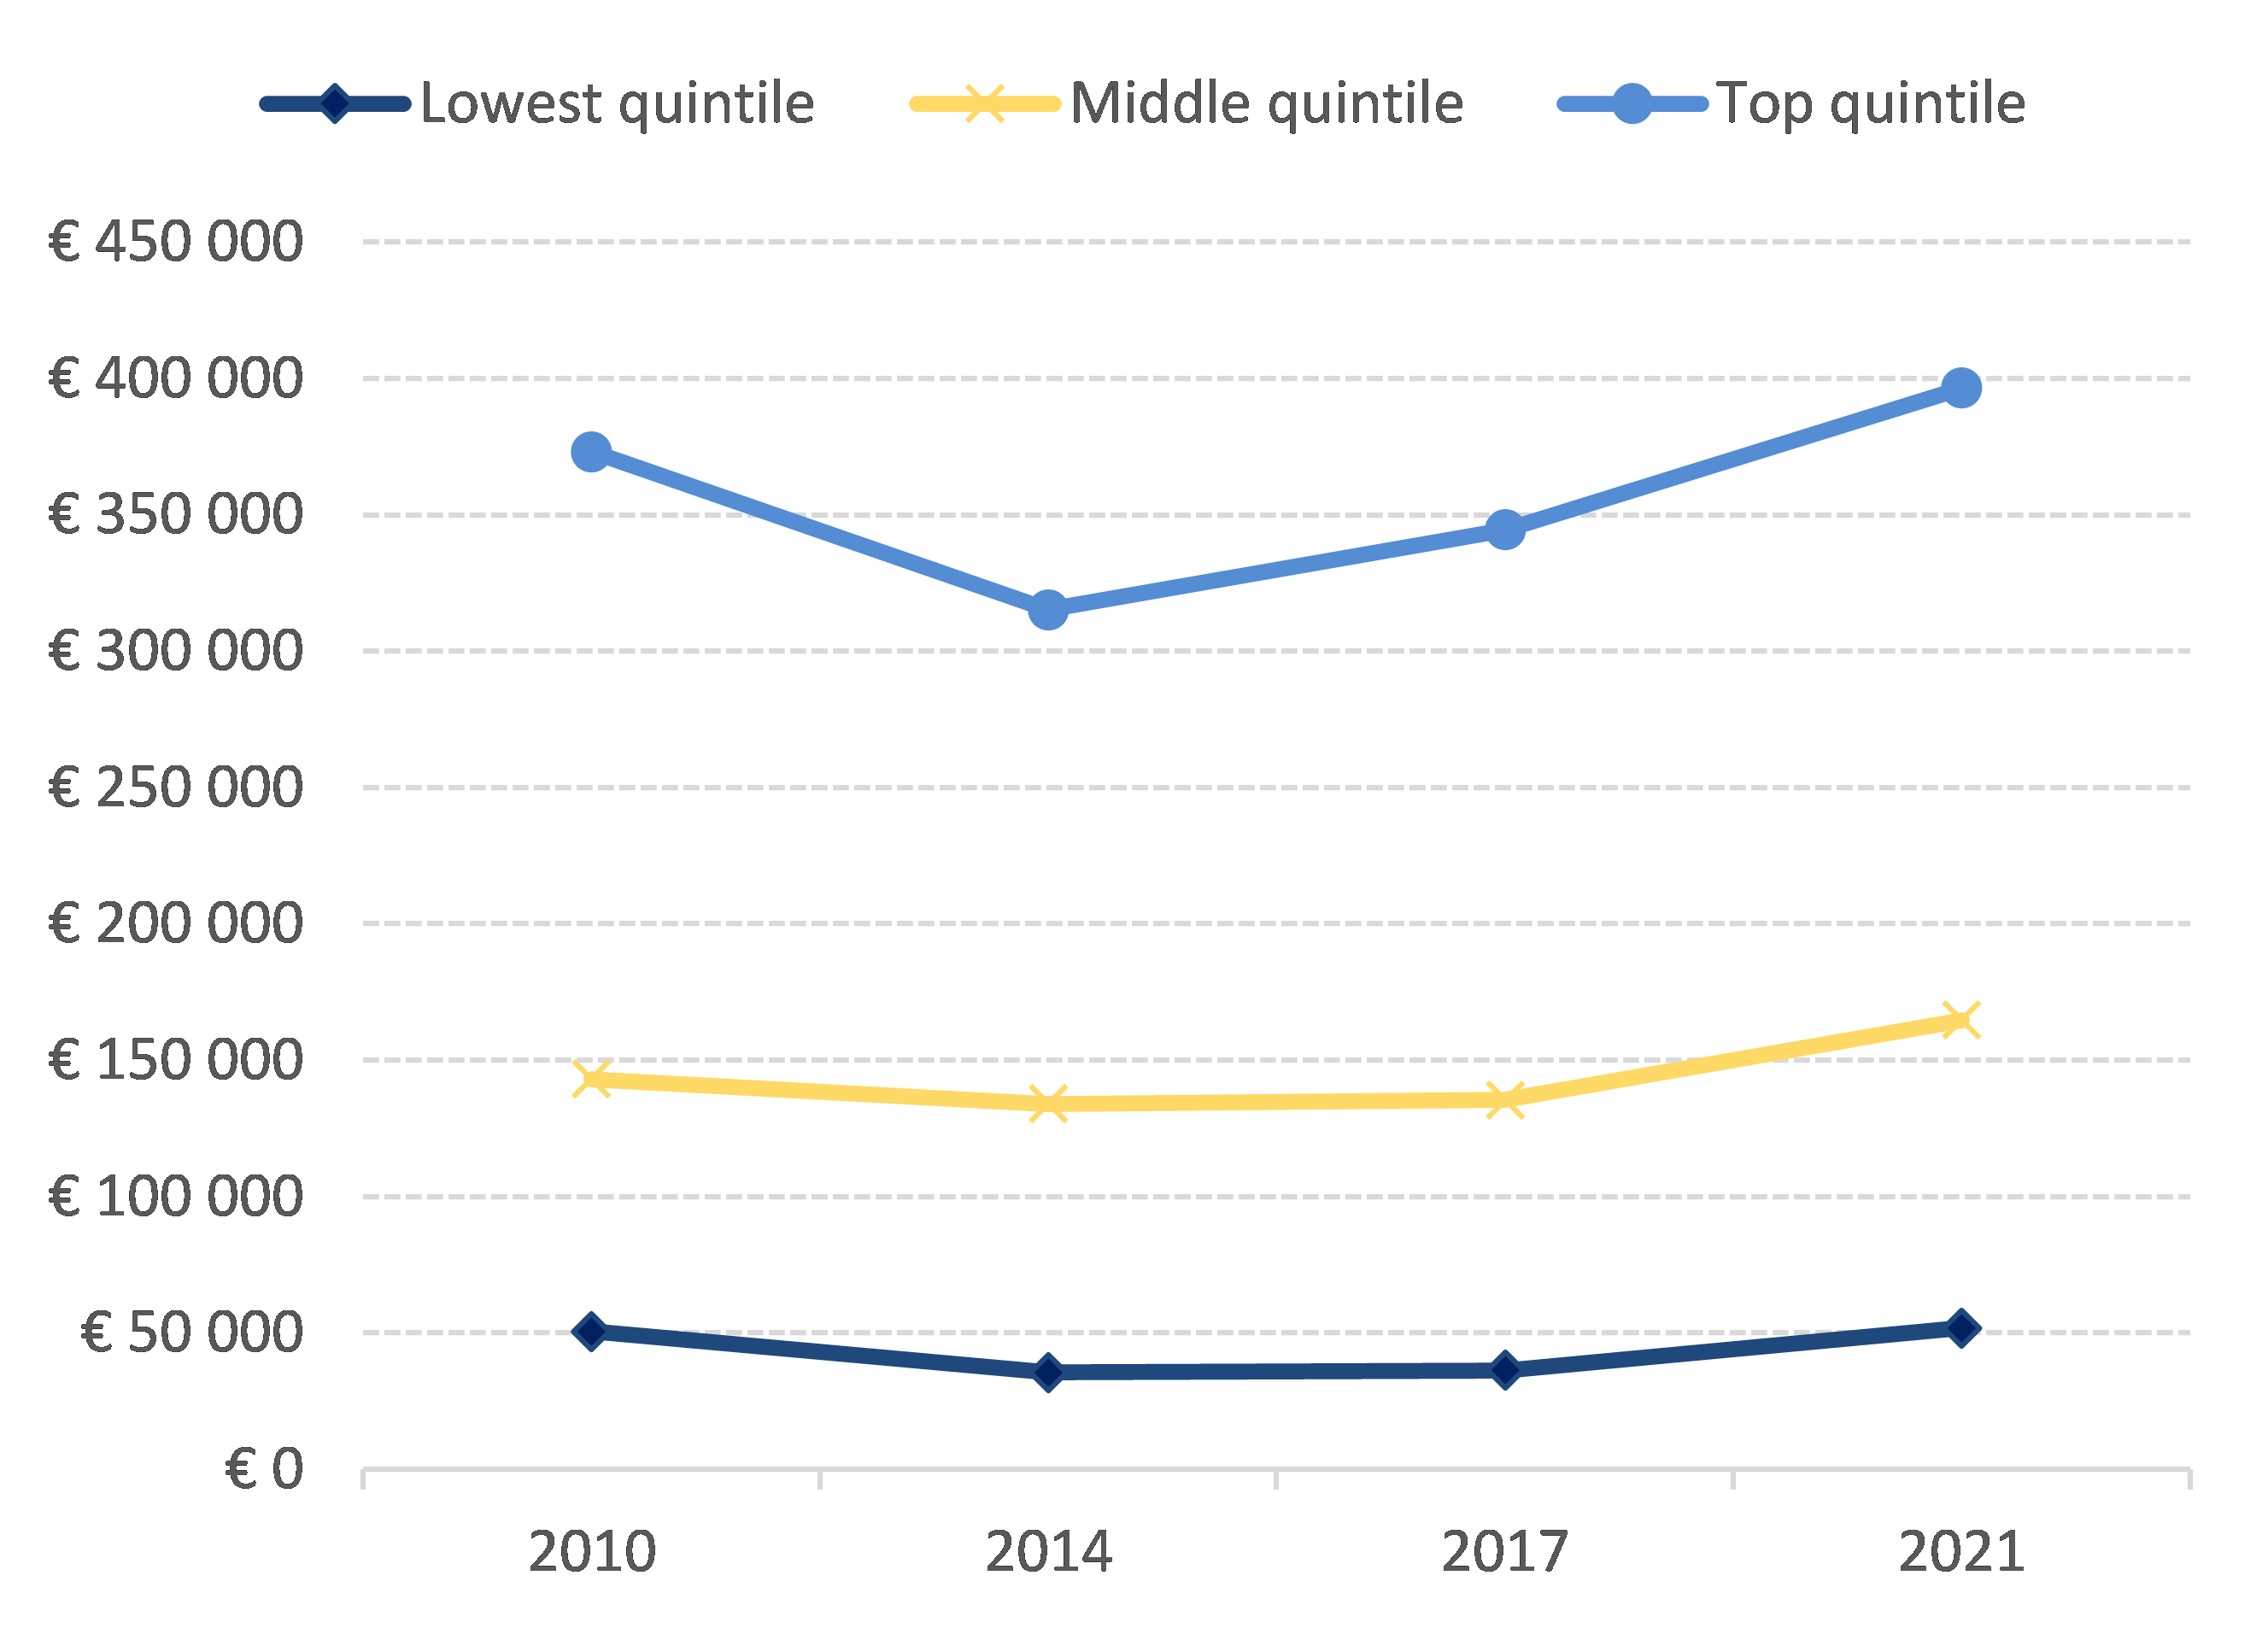
Notes: Median household net wealth in 2021 EUR PPS. Median household net wealth calculated for: people in the bottom fifth of income earners (lowest quintile); people in the middle fifth of income earners (middle quintile); people in the top fifth of income earners (top quintile).
Source: OECD calculations based on the HFCS, https://www.ecb.europa.eu/stats/ecb_surveys/hfcs/html/index.en.html.
Wealth concentration increased after the financial crisis but decreased during COVID-19. The distribution of wealth became more unequal between 2010 and 2017 (Chart 3), with an increase in the share of wealth held by the top 10% at the expense of the bottom 50%. Eleven of the 14 countries with data available since 2010 saw the wealth share held by the top 10% increase between 2014 and 2017 (from 48% to 50%). (3) At the same time, variation in wealth concentration across countries decreased until 2017 (Chart 3), as wealth in less unequal countries became more concentrated. Breaking the previous trend, during the COVID-19 pandemic there was a decrease in the wealth share of the top 10%, accompanied by a rising share of wealth held by the bottom 50%. (4)
Chart 3
Wealth concentration increased after the financial crisis but decreased during COVID-19
Average and standard deviation of wealth share of top 10% and bottom 50%, 2010-2021

Notes: Dispersion measured as standard deviation of wealth share by country. See Figure 1 note for more information. Standard deviation is a measure of cross-country variation, the higher the standard deviation, the higher the cross-country variation.
Source: OECD calculations based on the HFCS.
The increasing concentration of wealth during the 2010s continued the longer-term increases in wealth inequalities in the EU. (5) In all the countries, the concentration of wealth has increased significantly since 1995, although following different patterns (Chart 4). In most of the selected countries, the wealth share held by the top 1% has increased significantly, resulting in a higher concentration of wealth at the very top. This typically came at the expense of the bottom 50% of the distribution, except in Poland and Austria, where it was at the expense of the middle class instead.
Chart 4
Wealth concentration increased over the long-term in many EU countries in 1995 and 2022
Share of net wealth held by the…

Notes: Net household wealth is the sum of financial assets (e.g. equity or bonds) and non-financial assets (e.g. housing or land) owned by individuals, net of their debts. Wealth inequality is measured using the distribution of net household wealth among adults (equal-split series). Population comprises individuals over age 20.
Source: World Inequality Database, data on 1 March 2024.
- 1. HFCS data have some limitations in capturing the concentration of wealth at the very top of the wealth distribution due to difficulties in covering the wealthiest individuals in a survey and due to underreporting of wealth at the top.
- 2. For the purposes of this analysis, “euro area” here refers to the group of countries represented in the HFCS, i.e. including Hungary in wave 2 and Croatia in wave 3 (joined the eurozone in 2023). Figure 1 note contains a full list of countries included in each time series.
- 3. The increase in concentration of wealth between 2014 and 2017 is also apparent for the broader group of 19 countries for which data are available since 2014, although the patterns are weaker.
- 4. In general, this was due to lower debt levels and higher housing prices, both of which favour the bottom and middle of the distribution. Financial asset prices were also lower in 2020 than in 2017 for most countries but grew in 2021.
- 5. Longer-term data series were taken from the World Inequality Database. They are not entirely comparable to data collected by the European Central Bank presented elsewhere in this box, but allow for the study of the evolution of wealth concentration over a longer time period. Only those countries for which the World Inequality Database long-term data are known to be of good quality were selected for analysis.
Notes
- 61.Latest version of the Social Scoreboard can be found here.
- 62.The methodology, as developed by the Eurofound and used in this report, focuses on analysis at the level of territorial unit (country, region) with no weighting for the territorial unit. The reason for that is to avoid compromising the evolution in variation of outcomes for those units.
- 63.Regional level data cover employment and unemployment rates, people not in employment, education or training (NEETs), GDP per capita, adult participation in learning, and tertiary education attainment. Regional data are not readily available for other indicators covered at national level.
- 64.Nomenclature of territorial units for statistics (NUTS) 2.
- 65.When data start to become available on a more systematic basis across indicators.
- 66.(Eurofound, 2018).
- 67.GDP per capita grew from EUR 26 630 to EUR 35 620 between 2014 and 2022. Convergence estimations of GDP as measured in per capita EUR, PPS and chain linked volumes follow similar patterns.
- 68.(European Commission, 2024b) shows rather stable trend of convergence, considering longer time period since 1995.
- 69.Quality of institutions, the European Quality of Government Index captures citizens’ perceptions and experiences of various public services (education, healthcare, law enforcement). A high-quality government is defined as one that combines high impartiality, good public service delivery and low corruption; Smooth functioning of the labour market; (European Commission, 2024b).