
EU support to young farmers should be better targeted to foster effective generational renewal
About the report:The number of young farmers fell from 3.3 mln in 2005 to 2.3 mln in 2013. The EU allocated 9.6 billion euro to young farmers in 2007-2020 to foster generational renewal in agriculture. The Court found that this aid is often poorly-defined, with no expected result and impact specified. For Pillar 1 (direct payments), the aid is provided in a standardized form not matching young farmers’ needs other than additional income. For Pillar 2 (rural development), the aid better addresses young farmers’ needs and prompts specific actions (e.g. introducing organic farming, water- or energy-saving initiatives), however the managing authorities did not always apply selection procedures to prioritise the best projects. The Court recommends to better define the objectives and target the EU support in order to foster effective generational renewal.
| HTML | EPUB | ||
|---|---|---|---|
 |
 |
 |
 |
Executive summary
IThe overall number of farmers in the EU-27 has fallen rapidly in the last decade, dropping from 14.5 million farmers in 2005 to 10.7 million farmers in 2013. The number of young farmers (up to 44 years old) fell from 3.3 million in 2005 to 2.3 million in 2013. As the number of farmers decreased across all age groups, the percentage of young farmers in the farming population remained relatively stable, at just above 20 %. However, significant differences exist between Member States.
IIIn 2007-2020 the EU allocated 9.6 billion euro in specific aid to young farmers to enhance the competitiveness of agricultural holdings and generational renewal in agriculture. Including co-financing from Member States of Pillar 2 setting-up measure, total public support amounts to 18.3 billion euro. Almost 200 000 young farmers received EU aid for setting up in the 2007-2013 period. More than 70 % of the EU funding was provided under the Pillar 2 (EAFRD) measure for the setting up of young farmers, while the remaining 30 % is provided, in 2014-2020, under the Pillar 1 (EAGF) direct payment to young farmers.
IIIAgainst this backdrop, we examined the role of the EU in supporting young farmers and fostering generational renewal. The audit was carried out at the Commission and in the four Member States with most spending for young farmers: France, Spain, Poland and Italy. The audit aimed to answer the following question: ‘Is the EU support to young farmers well designed to contribute effectively towards improved generational renewal?’
IVThe overall conclusion is that EU support for young farmers is based on a poorly-defined intervention logic, with no expected result and impact specified. It should be better targeted to foster effective generational renewal. However, we found significant differences between the Pillar 1 payment to young farmers and the Pillar 2 setting-up measure.
VFor Pillar 1 payment to young farmers we found that:
- the aid is not based on a sound needs assessment and its objective does not reflect the general objective of encouraging generational renewal. The Member States did not coordinate Pillar 1 payment with the Pillar 2 setting-up measure or national measures;
- in the absence of a needs assessment the aid is provided in a standardized form (annual payment per hectare), in an amount and in a timing where it is unclear which specific needs other than additional income are addressed;
- the common monitoring and evaluation framework did not provide useful indicators for assessing the effectiveness of this payment, as there are no results indicators for this payment and data on the income and viability of the supported holdings are not collected.
For Pillar 2 measure for setting up of young farmers we found that:
- although it is generally based on a vague needs assessment, its objectives are partially specific, measurable, achievable, relevant and timed and reflect the general objective of encouraging generational renewal. There is some effective coordination with the Pillar 2 investment measure;
- the aid is provided in a form (lump sum subject to the accomplishment of a business plan and, in some cases, also an interest subsidy on a loan) addressing more directly the young farmers’ needs of access to land, capital and knowledge. The amount of aid is generally linked to the needs and modulated to prompt specific actions (e.g. introducing organic farming, water- or energy-saving initiatives);
- the aid is directed to more qualified farmers, who commit to implement a business plan guiding them in developing viable holdings and who are often encouraged through the project selection process to set up in less favoured areas. However, the business plans were of variable quality and managing authorities in some cases did not apply selection procedures to prioritise best projects. Selection criteria were introduced late in the 2007-2013 period, minimum thresholds were either too low or non-existent and the seven-year budget for the measure was used up in some Member States to fund nearly all applications submitted at the start of the programming period, thus preventing young farmers who set up later from receiving funding;
- we found little evidence about whether the EU measures facilitated the setting-up of young farmers and improved generational renewal and the viability of the supported holdings, mainly because of the low quality of indicators set by the common monitoring system.
We recommend that Commission and the Member States:
- improve the intervention logic by reinforcing needs assessment and defining SMART objectives, which will reflect the overall objective of fostering the generational renewal;
- improve the targeting of the measures through better project selection systems and use of business plans;
- improve the monitoring and evaluation framework by drawing on best practices developed by Member States in their monitoring systems and evaluation reports.
Introduction
A decreasing farming population
01EU agriculture is facing a decreasing farming population. The overall number of farmers in the EU-275 has rapidly decreased in the last decade, falling from 14.5 million in 2005 to 10.7 million in 2013, i.e. a reduction of one fourth in less than a decade. All age groups of farmers were affected (see Figure 1). It is not possible to know the number of farmers up to 40 years old as Eurostat data does not split the age group 35-44 years old into further sub-groups6.
Figure 1
Evolution of the number of farmers by age group in the 27 EU Member States

Source: Eurostat, Farm Structure Survey7.
The number of young farmers (up to 44 years old) decreased from 3.3 million in 2005 to 2.3 million in 2013, i.e. a reduction of one third in less than a decade. However, the percentage of young farmers in the farming population remained relatively stable, at just above 20 % (see Figure 2).
Figure 2
Evolution of the breakdown of farmers’ by age group in the 27 EU Member States

Source: Eurostat, Farm Structure Survey.
Significant differences exist between Member States: for example, in Poland the share of young farmers in the farming population increased from 34 % in 2007 to 36 % in 2013, while in Spain it decreased from 21 % in 2007 to 16 % in 2013. Annex I provides an overview of the number of farmers in individual Member States and of the variation between 2007 and 2013, while Annex II indicates the evolution of the distribution of farmers by age.
Generational renewal is high on the political agenda
04In 2008 the European Parliament considered that ‘generational change is necessary to preserve a high level of food quality and food safety within the EU as well as EU’s self-sufficiency in the future’ and that ‘the CAP must seek to remove the barriers currently facing young people wishing to set up in farming, by making generational change one of its priorities’8. In 2011 it noted that ‘the measures for young farmers contained in the second pillar have proved to be insufficient to stop a rapid ageing of the agricultural sector’ and that ‘support schemes in the second pillar should be extended’9. Also the Council in 2014 pointed out10 that young farmers and generational renewal in agriculture are fundamental for the sustainability and long term competitiveness of European agriculture.
05In 2015 the Commission argued11 that supporting young farmers is a priority. According to Commissioner Phil Hogan12: ‘… generational renewal is an issue that goes far beyond a reduction in the average age of farmers in the EU. It is also about empowering a new generation of highly-qualified young farmers to bring the full benefits of technology to support sustainable farming practices in Europe’. He stated that there are ‘barriers which hinder young people from taking up agricultural activity’ naming access to land, finance and knowledge as the most significant.
EU support for young farmers
06The total EU budget allocated specifically for the support to young farmers over the 2007-2020 period is 9.6 billion euro. It doubled from 3.2 billion euro in the 2007-2013 period, provided under the Pillar 2 setting-up measure, to 6.4 billion euro in the 2014-2020 period, mainly due to the introduction of an additional direct payment to young farmers under Pillar 1 (see Figure 3). Total public expenditure, including national co-financing by Member States of Pillar 2 setting-up measure, is 18.3 billion euro.
Figure 3
EU budget for support to young farmers under Pillar 1 (EAGF) and Pillar 2 (EAFRD) in the 2007-2013 and 2014-2020 programming periods

Source: ECA based on Commission’s data (2007-2013 expenditure and 2014-2020 allocations).
Support for young farmers was introduced back in the 1980s13. Since 2000, most support has been provided under the Pillar 2 measure for the setting-up of young farmers14. This measure was followed by the ‘Farm and business development’ measure in the 2014-2020 period. The measure is implemented in 92 out of the 118 Rural Development Programmes (RDPs) across 24 out of the 28 Member States.
08Additional support for young farmers was introduced in the 2014-2020 period under Pillar 115 in the form of an additional payment of 25 % for young farmers on top of direct payments.
09Figure 4 provides an overview of the EU instruments targeting – directly or indirectly – young farmers in the 2007-2020 period. As Figure 4 indicates, the audit focused on the measures supporting directly young farmers: the Pillar 2 setting-up measure and the Pillar 1 additional payment for young farmers.
Figure 4
Overview of EU measures supporting young farmers in 2007-2020 period

Source: ECA.
Table 1 below compares the main features of Pillar 1 and Pillar 2 support for young farmers in the 2014-2020 period.
Pillar 1 – European Agricultural Guarantee Fund (EAGF) Payment to young farmers | Pillar 2 – European Agricultural Fund for Rural Development (EAFRD) Measure 6.1 – Farm and business development for young farmers | |
|---|---|---|
| Legal basis | Article 50 of Regulation (EU) No 1307/2013 | Article 19 of Regulation (EU) No 1305/2013 |
| Form of support | Additional payment to young farmers entitled to a payment under the basic payment scheme or the single area payment scheme. | Business start-up aid of maximum 70 000 euro granted on the basis of a business plan (final payment is conditional upon the correct implementation of the business plan). |
| Support duration | Paid yearly for a maximum of 5 years (from the year of setting up). | Paid once per holding / per farmer in at least 2 instalments. |
| Implementation | Compulsory for all Member States, which can only set few parameters: budget, calculation method, limit of hectares, requirements for skills and joint control over legal holdings (see paragraph 40). | Voluntary for Member States/regions, which define priorities and objectives in RDPs, set eligibility and selection criteria, select projects and report to the Commission on the implementation of the measures. |
| Objective | ‘To facilitate the initial establishment of young farmers and the structural adjustment of their holdings after the initial setting up’1, and contribute to the general CAP objective of viable food production by enhancing farm viability2 and encouraging generational renewal3 | |
| Eligible beneficiaries |
|
|
| Number of beneficiaries | 279 071 (in 2015). | 193 828 in 2007-2013 period. No target at EU level for 2014-2020 period. |
| Average amount of aid per beneficiary | 1 135 euro (in 2015). | 20 000 euro (in 2007-2013). |
1 Preamble (47) of Regulation (EU) No 1307/2013 and Preamble (17) of Regulation (EU) No 1305/2013.
2 See Article 5 of Regulation (EU) No 1305/2013.
3 For Pillar 1 see Commission’s Memo ‘CAP Reform – an explanation of the main elements’ of 26 June 2013: ‘In order to encourage generational renewal, the Basic Payment awarded to new entrant Young Farmers (those under 40) should be topped up by an additional 25 % for the first 5 years of installation.’ and the European Parliament factsheet ‘First pillar of the Common Agricultural Policy (CAP): Direct payments to farmers’: ‘To encourage generational renewal, the basic payment awarded to young farmers (under 40 years of age), newcomers or farms set up in the previous five years is increased by 25 % for the first five years.’
For Pillar 2 see Article 5 of Regulation (EU) No 1305/2013, referring to the specific priority of ‘facilitating the entry of adequately skilled farmers into the agricultural sector and, in particular, generational renewal’.
Source: ECA based on Commission’s data.
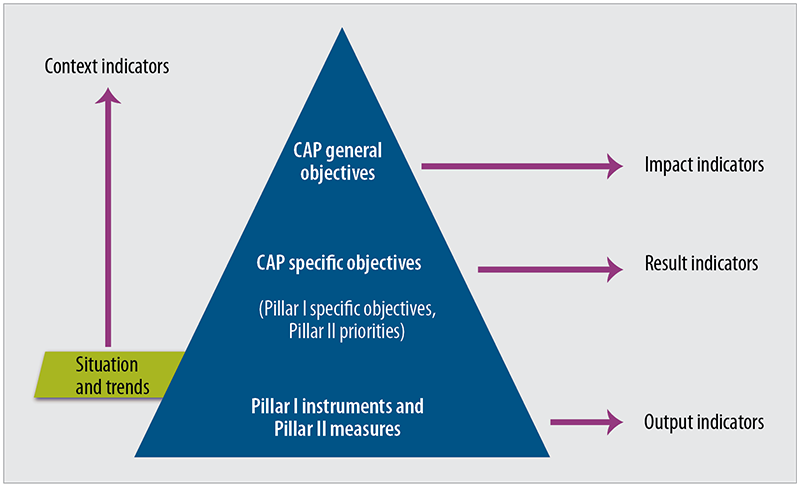
Audit scope and approach
11The audit aimed to answer the following question:
Is the EU support to young farmers well designed to contribute effectively towards improved generational renewal?
12In order to answer this question we focused on the measures supporting directly young farmers in the 2007-2020 period (see Figure 4), namely the 2007-2013 Pillar 2 measure 112 for setting-up of young farmers and its corresponding measure 6.1 in 2014-2020, and the 2014-2020 Pillar 1 payment to young farmers. We assessed the intervention logic (Part I of the report), the targeting in the implementation of the measures (Part II), and their results (Part III).
13The audit was carried out between April and October 2016 and covered four Member States that spent the highest amount on young farmers: France, Spain, Poland and Italy (see Figure 5). These four Member States represent 56 % of the total EU budget corresponding to the measures supporting directly young farmers in the 2007-2020 period (see Figure 4). Annex III provides an overview of the EU budget allocated specifically to young farmers by Member State.
14In these four Member States we examined the national frameworks, that set the intervention logic and the main features of the measures, and the extent of coordination between such measures and national policies favouring generational renewal. To assess the implementation and results of the measures, we focused on seven regions that are among the ones which spent the most under the measures supporting directly young farmers:
- France (Pays de la Loire and Midi-Pyrénées);
- Spain (Andalucía);
- Poland (Warminsko-Mazurskie and Dolnoslaskie);
- Italy (Emilia-Romagna and Puglia).
Figure 5
EU support for young farmers under Pillar 1 (EAGF) and Pillar 2 (EAFRD) in the 2007-2020 period (the rectangle represents the audited Member States)

Source: ECA based on Commission’s data (2007-2013 expenditure and 2014-2020 allocations).
The audit approach combined an audit of the control systems, mainly at Commission and Member State level, with an examination of a sample of 57 projects at final beneficiary level to verify the implementation and the result of the measures. We also analysed relevant statistics and studies provided by Eurostat (e.g. Farm Structure Surveys), national parliaments and statistical offices, universities and young farmers’ organisations at EU, national and regional level.
16These studies indicated that there are general factors other than EU measures influencing generational renewal (e.g. the economic and social situation, the propensity of banks to provide loans, the employment possibilities in sectors other than agriculture, and the high concentration of agricultural land in relatively low number of farms16). National policies favouring the exit of old farmers can also play an important role, as indicated by Germany, one of the Member States which, like Denmark, Ireland, the Netherlands and UK-Northern Ireland, chose not to implement the setting up measure under 2014-2020 Pillar 2. In fact, the 2007-2013 mid-term evaluation for Germany (Rhineland-Palatinate) showed that the measure 112 for the setting up of young farmers failed to adequately address the problem of farms lacking a suitable successor and that it was not possible to identify what impact such support had had on farmers’ age structure. In addition, Germany considered that its ‘Hofabgabeklausel’ social security scheme, which requires farmers to relinquish their farm in order to receive their old-age pension, plays a major role in successful generational renewal in the farming sector.
Observations
Part I – Intervention logic
17The Commission and the Member States should adequately design policy interventions. For this purpose we examined whether the Commission and the Member States were:
- carrying out sound ex-ante needs assessments in the specific areas of intervention;
- deciding which funds are best matching the young farmers’ needs;
- defining specific, measurable, achievable, relevant and timed (SMART) objectives;
- defining arrangements to ensure an effective, efficient and coordinated use of the various funds.
Young farmers’ needs identified at general level …
18According to Commission’s studies, interviews with the audited managing authorities and young farmers’ associations, barriers hindering young people to become farmers can be classified as relating to:
- access to land: around 60 % of young farmers in the 28 EU Member States reported problems in buying or renting land17. According to several studies18, the problem lies in the high price of land and the reluctance of older farmers to retire;
- access to capital: around 35 % of young farmers in the 28 EU Member States reported problems in accessing subsidies and credits19. According to studies20 and interviewed young farmers’ associations, in France, Italy and Spain the problem is due to the complexity and length of the public support procedures rather than to the insufficiency of the subsidies;
- access to knowledge: around 20 % of young farmers in the 28 EU Member States reported problems in accessing knowledge21. In 2010, only 14 % of farmers up to 35 years old in the 27 EU Member States had a full agricultural training22, although this varied significantly across the EU. For example, in France (Pays-Loire) 84 % of farmers up to 35 years old had a full agricultural training, in Italy (Emilia-Romagna) 27 %, in Poland 26 % and in Spain (Andalucía) only 3 %;
- access to a sufficient and stable income: some Member States and young farmers’ associations indicated such a need, although in the four audited Member States there are no statistically representative data on the income of young farmers (up to 40 years old) or data showing whether the income in the first years of farming activity is generally insufficient or unstable, or more so than in later years;
- access to basic infrastructure and services in rural areas, equivalent to those available to young people who do not live in rural areas, such as broadband, nurseries, schools, transport and postal services, healthcare and replacement services.
… but general needs were not further investigated
19In most audited Member States/regions our examination showed that it is not known if the extent of such barriers is common to all young farmers setting up in a given region or only to some of them, for example those in specific geographical areas, agricultural sectors or financial situations (e.g. those who have not inherited sufficient land or capital). Nor is it known at which moment during the setting-up process which of these obstacles appear to be more serious.
Pillar 1
20The Pillar 1 additional payment for young farmers is based on the assumption that young farmers starting an agricultural activity face financial challenges23. Although this assumption may be true, the Commission’s impact assessment24 did not provide data supporting it or an estimation of the expected impact of this additional payment on the young farmers’ income, on the viability of their holdings or on generational renewal rates, but focused only on the budgetary implications of the different methods proposed for calculating this payment. It is not clear what young farmers’ needs this payment should address, other than additional income, and what should be its added value.
21Also at Member State level there were no documents, studies or data explaining why this additional payment was needed or supporting the assumption that young farmers starting an agricultural activity face financial challenges. In Italy we found some non-representative data at national level showing that the Farm Net Added Value25 was slightly higher (80 000 euro on average) in 2010 for holdings held by farmers under 40 compared to older farmers (73 000 euro). Nor are there any data showing whether income in the first years of farming activity is generally insufficient or unstable, or more so than in later years.
22Regulation (EU) 1307/2013 delegates to Member States some implementation choices, such as fixing a certain budget for the payment or a certain limit on the number of hectares on the basis of which it should be calculated (see also paragraphs 39 to 41). However, there were no documents, studies or data providing sound justification for such choices.
Pillar 2
23The general needs and the decrease in the number of young farmers were mentioned in most of the audited Member States’ programming documents (ex-ante assessments, rural development programmes) relating to the Pillar 2 measure for the setting-up of young farmers. However, the underlying reasons why young people face barriers in terms of accessing land, capital, knowledge, income or services were not sufficiently investigated and were generally not supported by quantifiable evidence.
Partial mismatch between needs and form of support
Pillar 1
24In the absence of a needs assessment it is unclear which specific needs other than additional income are addressed by the Pillar 1 payment to young farmers. However, concerning income we could not determine if the need for a higher and more stable income, which should normally be addressed directly by this payment, was dealt with. The audited Member States could not provide statistically representative data on young farmers’ incomes or data showing whether their income in the first years of farming is generally insufficient or unstable, or more so than in later years. Concerning the other needs:
- the need to improve access to land is not directly addressed by this payment, which is only provided to young farmers who already have land;
- the need for better access to capital is not evident since it is not known if beneficiaries of this payment lack sufficient capital to run a viable holding and/or sufficient access to credit to subsidise investments likely to increase their viability;
- the need for better access to knowledge is not specifically addressed by this payment, which is provided without requiring a minimum level of agricultural education in most Member States.
Pillar 2
25Under Pillar 2 measure for setting up young farmers the aid is provided in the form of a lump sum (subject to the accomplishment of the business plan), an interest subsidy or a combination of the two. It therefore addresses more directly the specific needs of young farmers, in particular:
- the need to improve access to land is partially addressed, as farmers could use the lump sum to buy land or could subsidise credit for land purchases;
- the need for better access to capital is generally addressed, as the farmers can use it for investments likely to increase the viability of their holdings and, in some cases, also to get a subsidised loan;
- the need for better access to knowledge is generally addressed by this measure, as beneficiaries must have or acquire a minimum level of agricultural education;
- the need for sufficient and more stable incomes is indirectly addressed by supporting the actions and investments likely to lead to the development of viable holdings.
Objectives set at general level …
26The common general objective of the support to young farmers under Pillars 1 and 2 at EU level is to facilitate the initial establishment of young farmers and the structural adjustment of their holdings after the initial setting up, with the ultimate aim of increasing viability and favouring generational renewal (see Table 1).
… but the general objective of encouraging generational renewal was not reflected in the objective of Pillar 1 payment to young farmers
27Annex IV shows the intervention logic of Pillar 1: the payment to young farmers should contribute to improving agricultural competitiveness and enhancing farm income and, more generally, to achieving the CAP objective of viable food production. However, the general objective of encouraging generational renewal was not reflected in the objective of this payment.
28In the absence of a needs assessment, the objective of the Pillar 1 payment for young farmers remains:
- not sufficiently specific as there is no description of the expected outcome (e.g. expressed as rate, number, percentage or frequency) or indication of the targeted population of young farmers to support (e.g. in specific geographical areas or financial situations);
- only partially measurable since it is not known what percentage of the income of young farmers this payment should represent, nor are there any quantifiable targets in terms of the results this payment should generate;
- not known if the objective is achievable or to what extent is achievable, as it is not sufficiently specific and measurable;
- not clear to which extent the objective is relevant, as it is not known what young farmers’ needs this payment should address, other than additional income, and how widespread is such need among young farmers starting an agricultural activity (see paragraphs 19 to 22);
- not timed as it is not defined by when the objective should be achieved.
The general objective of encouraging generational renewal was reflected in the objective of Pillar 2 setting-up measure
29At EU level, the objective of the Pillar 2 measure for the setting up of young farmers is to ‘favour the setting up of adequately skilled farmers in agriculture and, in particular, generational renewal’ and contribute to the general CAP objective of viable food production by enhancing farm viability (see Table 1). In addition to this EU-wide objective, the Member States defined in their 2007-2013 RDPs more specific objectives for this measure, such as promoting employment, retaining population in rural areas, improving the competitiveness of the farms, increasing their profitability and using new technologies and improving human capital.
30We found that the objectives of the Pillar 2 measure for the setting up of young farmers in the four audited Member States were partially SMART, as they were:
- reasonably specific, as the aim was to support adequately-skilled young farmers and they were often accompanied by a description of an expected result (e.g. ‘to create added value through diversification and job creation’ or ‘to increase the profitability of farms’);
- partially measurable, as there was a target indicator in terms of output (absolute number of young farmers to be supported and, in relative terms, percentage of the total number of holdings in a region), but no quantifiable target in terms of expected results, such as the generational renewal rate needed to achieve the objectives (see paragraph 71);
- partially achievable, since they were achievable in terms of output (number of young farmers to be supported), but it is not known if they were achievable in terms of results and impact on generational renewal;
- partially relevant, since they were relevant to the general need to support generational renewal. However, it was often not known to what extent they were relevant to the needs of access to land, capital, knowledge, income or services (see paragraphs 19 and 23);
- partially timed as there is no deadline by which, for example, a certain rate of young/older farmers should be achieved.
Limited coordination between support measures, though some good practices were identified
Little coordination between EU and national measures supporting young farmers
31In the four audited Member States we observed limited coordination between the EU and national support measures. More specifically:
- In France there is a wide range of national aids in favour of young farmers, such as tax advantages, exemptions from social security contributions, priority access for purchasing agricultural land, and aid for training courses. There are information centres to inform potential beneficiaries about the various aids. There are also coordination bodies to ensure complementarity between the various aids but no specific coordination mechanisms between the EU and national measures;
- In Italy there is some coordination of the scope of the intervention with the national measure providing young farmers an interest subsidy for the purchase of land (an issue only partially addressed by the EU measures) and mechanisms in place to avoid accumulation of this aid with the EU Pillar 2 setting-up measure; there are also tax advantages for which there are no coordination mechanisms with EU measures;
- In Poland there are loans with favourable conditions but no coordination mechanisms with EU measures;
- In Spain there are loans with favourable conditions and tax advantages having a direct impact on the young farmers’ income, like the Pillar 1 payment to young farmers. However, there is no coordination mechanism between these aids, which can be cumulated.
In none of the four audited Member States the authorities have an overview of the different EU and national aids provided to the beneficiaries. There is a risk that some young farmers are over-supported in comparison to their actual needs (e.g. benefitting from the EU Pillar 1 payment to young farmers, Pillar 2 setting-up measures, investments, diversification, training and the various national aids), while others are under-supported.
No coordination between Pillar 1 payment to young farmers and Pillar 2 setting-up measure
33Although the Commission indicated that the 2013 CAP reform was aimed at ‘increasing the links between the two Pillars, this offering more holistic and integrated approach to policy support’26, in the four audited Member States we did not observe any coordination between the national authorities managing Pillar 1 payment to young farmers and Pillar 2 setting-up measure. The two measures are managed by different authorities, according to different rules (see Table 1). In particular, the fact of having received aid from the Pillar 2 setting-up measure has no influence on the possibility of receiving the Pillar 1 payment to young farmers.
Good synergy in Pillar 2 between the setting up and the investments measure
34In the four audited Member States we observed different levels of coordination between the Pillar 2 setting-up measure and the investment measure, which generated some synergistic effects.
35In Italy, where the aid to young farmers was provided in the form of an aid package, as recommended by the National Strategic Plan (see Box 1), the combination of the setting up and investment measures proved successful.
Box 1
Example of good synergy between the setting-up and investment measures
Italy (Emilia-Romagna)
Young farmers applying for the setting-up measure were encouraged to apply at the same time also for the investment measure thanks to higher amounts of aid under the setting-up measure (in 2007-2013) and the award of more points increasing the likelihood of being selected (in 2014-2020). Therefore, half of the applicants for the setting-up measure also received support under the investment measure. On average, these applicants set up larger, more productive, more profitable holdings and invested and innovated more than the others27:

The aid provided by the setting-up measure is twice more cost-effective when provided jointly with the investments measure. In fact, the return on the public aid (measured as the increase in the annual gross added value of the holdings over the amount of aid28) for beneficiaries of both measures is double that for beneficiaries of the setting-up measure only.
Also in Spain (Andalucía) in 2007-2013 joint calls were organised between the setting-up and the investment measure, allowing young farmers to receive support under both measures. However, in 2014-2020 the aid package approach was discontinued and separate calls were organised for the two measures, which were assessed at different times against different selection criteria.
37In France and Poland the setting-up and investment measures worked separately, but young farmers applying for the investment measure benefitted from an extra 10 % in aid to co-finance the investments, while in France, they were also awarded additional points in the project selection system.
Part II – Targeting of the measures
38The Member States should apply selection methods that prioritise the most cost-effective interventions, for example by:
- targeting the aid towards more qualified young farmers and less favoured areas (e.g. facing highest insufficiency of generational renewal);
- applying selection procedures (e.g. competitive calls for proposals based on clear and relevant selection criteria) and tools (e.g. business plans) to prioritise beneficiaries likely to increase the viability of their holdings thanks to the aid;
- providing an amount of aid linked to improving their viability;
- providing the aid within a reasonable time frame, when needed to facilitate the initial establishment of young farmers and the structural adjustments of their holding.
Pillar 1 payment to young farmers: an over-standardized aid
Pillar 1 legal framework limits the scope for targeting …
39The Pillar 1 payment to young farmers is provided yearly for a maximum period of five years to any applicants no older than 40 in the year of their first application, setting up for the first time in an agricultural holding as head of the holding, or who have already set up such a holding during the five years preceding the first application for the scheme.
40Pillar 1 does provide additional income to young farmers. However, the Pillar 1 legal framework does not allow Member States to sufficiently target young farmers who are most likely to need an additional payment to be viable. In fact, Member States can only:
- fix the percentage of the national ceiling to be used to finance payments to young farmers29 (up to 2 % of the direct payment budget);
- choose between three calculation methods30 (most Member States, including France and Poland, calculated it as 25 % of the national average direct payment per hectare);
- set a limit (between 25 and 90 hectares) for the number of hectares on the basis of which this payment is calculated (most Member States set it at 90 hectares);
- opt to require additional skills and/or training (10 Member States and one region added such requirements31);
- choose whether to accept joint control of young/non-young farmers over the legal entities applying for the payment or to limit access to legal entities controlled solely by young farmers32.
Furthermore, the implementation of the payment for young farmers is compulsory for all Member States, including those which chose not to implement the setting up measure under Pillar 2 (see paragraph 16). Table 2 provides an overview of the audited Members States’ choices in implementing the Pillar 1 payment to young farmers, while Annex V provides an overview for all 28 EU Member States.
| France | Italy | Poland | Spain | |
|---|---|---|---|---|
| % of the annual national ceiling | 1 % | 1 % | 1 % | 2 % |
| Calculation method: | 25 % of the national average payment per hectare | Average value of entitlements held by a farmer | 25 % of the national average payment per hectare | Average value of entitlements held by a farmer |
| Maximum limit of hectares on the basis of which the payment is calculated | 34 ha | 90 ha | 50 ha | 90 ha |
| Additional skills and/or training requirements | Yes | No | Yes | No |
| Allow joint control of young and non-young farmers over legal persons | Yes | Yes | Yes | Yes |
Source: ECA based on Commission’s data.
… resulting in an over-standardized aid
42Therefore, this payment is provided regardless of:
- applicants’ skills and/or training requirements (in most Member States33): young farmers without any agricultural training are also supported;
- the location of the beneficiaries: young farmers located in less favoured areas, who generally face greater viability challenges, are not favoured in comparison with those located in other areas;
- the viability of the holdings: holdings that are already profitable and do not need this additional payment to be viable are also supported (see examples in Box 2).
Box 2
Examples of holding not needing Pillar 1 additional payment for young farmers to be viable
Poland
One audited beneficiary had a holding of 513 hectares, was receiving around 100 000 euro of EU direct payments every year and was generating a net profit of around 150 000 euro (equal to 15 times the average GDP per capita in Poland) in the three years before applying for the additional payment for young farmers. Therefore, this beneficiary had no financial challenges and was already running a viable holding before obtaining the payment for young farmers (3 000 euro in 2015).
Spain (Andalucía)
Two of the eight audited beneficiaries had holdings of more than 50 hectares, generating an agricultural income of around 400 000 euro and 700 000 euro, respectively (i.e. more than 10 times the average Spanish reference income34), in the year before applying for the payment for young farmers. These beneficiaries had already been running a viable holding for more than three years before obtaining the payment for young farmers (4 200 and 1 200 euro respectively in 2015).
Payment also provided to holdings in which young farmers have a minor role
43In case of joint control of a legal holding with other non-young farmers, this payment is provided under the same conditions regardless of the role of the young farmer in terms of decision-making power. In such situation, even a small share of a legal holding held by a young person not exercising an agricultural activity and, as an individual, not qualifying as an active farmer35 can make the entire holding eligible for this payment (see example in Box 3).
Box 3
Example of holding receiving the payment for young farmers despite the young person having only a minor role in the holding
Italy (Emilia-Romagna)
In case of simple companies36 at least one shareholder needs to be young, irrespective of his/her share, to make the entire holding eligible for the payment for young farmers. This payment is not proportional to the share held by the young shareholder or to his/her decision-making power and the active farmer requirement has to be fulfilled by the company, not by the individual young shareholder. Consequently, there are no checks on whether the young shareholder is exercising an agricultural activity as his/her main activity, (s)he is registered as a farmer with social security or that a non-insignificant part of his/her revenue derives from agriculture.
For example, one audited young farmer, who owns 16 % of the shares of a simple company, was neither working in the company nor exercising any agricultural activity and, as an individual, would not qualify as an active farmer. Nonetheless, the company received 8 000 euro in 2016 in additional payment to young farmers for its 90 eligible hectares.
There is a risk that this payment is being provided across the EU to numerous holdings in which the young beneficiary has a minor role in the holding and limited decision-making power and, as an individual, would not qualify as an active farmer, as in the example reported above. Out of the 279 071 applicants37 for this payment in the EU in 2015, 61 742 (around 20 % of the total) exercise joint control over the holding. Nearly half of them (i.e. 26 925, around 10 % of the total) exercise control over the holding jointly with non-young farmers.
45Out of the four Member States audited, this risk is higher in France and Italy (Emilia-Romagna), where respectively 64 % and 42 % of beneficiaries set up in legal holdings. We could not obtain data in either Member State on the average share of the legal holdings held by young beneficiaries or other information to assess their actual role (e.g. whether the young farmers have a decisive influence on management decisions regarding the holdings, whether (s)he, as an individual, would qualify as an active farmer, whether (s)he is registered as a farmer with the social security).
46More generally, there is a risk that this payment is provided across the EU to holdings in which the young farmer is not involved in daily management. Additionally, as the aid is delivered under the same conditions as for direct payments, there are no checks on the legal title to use the land declared by the young farmer to receive this payment.
Not known if amount of aid is linked to needs
47Table 3 provides an overview of the amount of aid in the four audited Member States.
| Amount of aid (euro) | France1 | Italy | Spain (Andalucía) | Poland |
|---|---|---|---|---|
| Average | Not known | 1 143 | 2 182 | 1 040 |
| Minimum | Not known | 15 | 16 | 25 |
| Maximum | Not known | 25 887 | 15 342 | 3 000 |
1 As of February 2017, the French authorities could not provide a database with the list of beneficiaries of this payment in 2015 indicating the amount received from this payment and the other Pillar 1 direct payments, the date of setting-up and application, the number of hectares and the share of the holding held by the young farmer (in case of joint control of the holding).
Source: ECA based on Member States’ data.
48At EU level, the average amount of aid provided by the payment for young farmers was 1 200 euro per holding in 2015. This amount represents around 4 % of the average income of a holding (30 000 euro) in the EU38 and even less in some Member States. For example, in Italy the average amount of aid was 1 143 euro, representing less than 2 % of the average income of a holding run by a young farmer (64 328 euro)39.
49This amount is not linked to the viability or other characteristics of the holdings (see paragraph 42) and it is not known if it is proportional to young farmers’ needs, as these were not assessed (see paragraphs 19 to 22). Audited beneficiaries indicated that this amount was mainly used to cover current expenditure and to make up for shortfalls in their revenue resulting from the fluctuation of agricultural prices, which is a situation that all farmers – not only those up to 40 – have to face. It is therefore unlikely that the amount of aid currently provided by this payment would have a substantial impact on the viability of the holdings and on the young farmers’ setting-up decisions.
50Italy and Spain opted for calculating the amount of aid as 25 % of the average value of entitlements held by each young farmer. This value is linked to the historical value of the entitlements held by each young farmer, who acquired or rented them from other farmers (e.g. parents or older farmers). Since the objective of this payment is to facilitate the initial establishment of young farmers it is not clear why the amount of aid is linked to the history of the holdings and consequently penalises young farmers who are not inheriting or obtaining high-value entitlements previously held by other farmers.
Timing of aid not facilitating the initial setting-up of young farmers
51The aid was often paid to beneficiaries who had been established for several years and, in some cases (see examples in Box 2), had already achieved a sufficient and stable income. This means that the timing of the aid was generally not consistent with its claimed objectives, as it was often paid too late to facilitate the initial establishment of young farmers or to contribute to any structural adjustment of their holdings. Nor did it act as incentive, as most of young farmers audited had set up before knowing that they would receive the aid.
Pillar 2 project selection system allows good targeting, although best projects were sometimes not prioritised
Eligibility and selection criteria allowed targeting the aid towards more qualified farmers and less favoured areas …
52All four audited Member States directed the aid towards more qualified farmers, by requiring either to have a sufficient level of agricultural education or to acquire it within 36 months from application. The aid has generally increased the professional competence of young farmers and their capacity to introduce innovations. For example, in Italy (Emilia-Romagna) 31 % of supported young farmers hold an agricultural degree, while only 25 % of all young farmers existing in the region hold such a degree. In Spain (Andalucía) 84 % of supported young farmers have some agricultural training, compared to only 26 % of all young farmers existing in the region and 12 % of supported young farmers apply organic farming methods, compared to only 4 % of all young farmers existing in the region.
53All four audited Member States encouraged young farmers to set up in less favoured areas (e.g. areas with natural constraints, with higher unemployment):
- in France and Italy (Emilia-Romagna) this was done by providing significantly higher amount of aid (around 20 000 euro more) to applicants setting up in less favoured areas;
- Italy (Puglia) effectively favoured young farmers setting up in less favoured areas both by awarding more points in selection criteria and by granting an additional amount of 5 000 euro to young farmers setting up in such areas. As a result, a higher proportion of young farmers located in rural areas with overall development problems (12 %) and intermediate rural area areas (10.6 %) was supported than those in rural areas under specialised intensive farming (9.9 %) and urban hubs (8 %)40;
- in Spain (Andalucía) this was done both by awarding more points in the selection criteria and by granting an additional amount (+10 %) to young farmers setting up in such areas;
- in Poland this was done through selection criteria by awarding additional points, in the 2007-2013 period, to applicants setting up in areas with higher unemployment.
Picture 1
Holding that received support to set up in a less favoured area

Source: ECA.
… although generational renewal was rarely addressed in the selection criteria
54Only in Spain (Andalucía) in the 2007-2013 period and in Poland in the 2014-2020 period was there a selection criterion directly encouraging generational renewal: in Spain (Andalucía) applicants setting up as a result of an early retirement received more points, while in Poland the higher the age difference between the transferor of the holding and the young farmer the more points were awarded to the project. However, in practice, such criteria almost never had a decisive impact on targeting the aid, mainly because minimum thresholds of points were too low or non-existent (see paragraph 55).
Weaknesses in selection systems often hindered prioritisation of best projects
55The selection systems should enable the comparative assessment and ranking of the project proposals to prioritize the most cost-effective projects. However, the selection criteria often had a limited impact in terms of targeting aid towards the best projects, as they were either introduced late in the 2007-2013 period or hardly ever applied to exclude low-quality projects. This was due to minimum thresholds of points for projects to be selected being too low or non-existent, and to an unbalanced distribution of the seven-year budget for the measure.
56For example, in Italy (Puglia), the whole 2007-2013 budget of the measure was used up, as almost all the applications submitted under the call for proposals organised in 2009 were funded. The threshold was so low that only eight projects out of 2 424 were rejected. Consequently, young farmers who set up in the following five years with potentially better projects could not be funded.
57Similarly, in Spain (Andalucía), the whole 2014-2020 budget of the measure was used up in the first two calls for proposals (2015 and 2016) and the minimum points threshold was only one point out of 20. This means that for the rest of the programming period young farmers with potentially better projects will not have the opportunity to be funded, unless the budget for the measure is increased.
58In Poland, the managing authority applied a ‘first come first served’ system with no selection criteria until 2011, when the budget was exhausted. Until 2014, when the budget for the measure was increased and selection criteria were introduced, no further call for proposals could be organised, preventing young farmers who set up in the intervening three-year period from being funded.
59Only in France and Italy (Emilia-Romagna) was the budget equally spread out through the programming periods with sufficiently high minimum points thresholds (although in France only for Midi-Pyrénées in 2014-2020 period). This made it possible to select a constant number of applications of sufficient quality to be funded every year.
Little evidence of improved viability
60The Pillar 2 measure for setting up of young farmers aims at enhancing farm viability by favouring the setting up of adequately skilled farmers in agriculture and generational renewal (see paragraph 29). Business plans are in principle useful tools to guide young farmers in developing viable holdings. They should also allow managing authorities to assess, at selection stage, the viability of the holdings and, later, monitor and evaluate the results.
61In none of the audited Member States was the initial estimated income of the holdings (before the project) used in the selection process to assess their potential to self-finance the investments. Moreover, business plans are useful tools but we found little evidence of improved viability (see Box 4).
Box 4
Little evidence of improved viability
France
Business plans were used to assess the likely viability of the holdings and support only young farmers setting up in holdings expected to generate an income – by the end of the project (normally the fourth year) – at least equal but not more than three times to the French minimum wage41. This criterion generally allowed aid to be channelled towards holdings that were both likely to be viable and in need of public aid. However, because of the significant delays in carrying out the checks at the end of the project, for most beneficiaries who started their projects in the period 2007-2010 there is as yet no evidence that they became viable. In Pays-Loire almost half of the 598 projects that were completed and checked by November 2016 failed to respect the business plans, while in Midi-Pyrénées only 3 % of checked projects failed to respect the business plans.
Poland
Business plans were not required to show an increase in the viability of the holdings but only to mantain the initial level of standard output (or to reach a minimum level of 4 800 euro, where the initial level was lower than that) in 2007-2013, or achieve a modest increase (+10 %) in 2014-2020. This requirement is an attempt to prompt young farmers to maintain or slightly increase their farm size and/or to choose more productive crops. However, it is not necessarily prompting young farmers to increase their income and viability, since the standard output does not consider the costs or, therefore, the income. It only measures the agricultural production potential of a holding on the basis of its size and type of crops/livestock.
Spain
Business plans were used to support, as a priority, young farmers setting up in holdings expected to generate sufficient workload for at least one annual work unit and an income per annual work unit between 35 % and 120 % of the Spanish reference income42. However, the estimated income was influenced by the cost estimates stated by the beneficiaries in their business plans, whose reliability was not checked by the managing authority when approving projects. Also the checks at the end of the project were not based on actual costs, income, equipment or employees.
In addition, business plans were not required to show an increase in the viability of the holdings and were not used to assess the need for public support. Three of the seven audited beneficiaries used the aid essentially for buying additional land or acquiring shares in a holding from parents or brothers, without demonstrating any increase in the viability of their holdings.
Only in Italy (Emilia-Romagna) we found evidence of improved viability of the supported holdings, as shown by the ex-post evaluation report (see Box 5).
Amount of aid linked to needs and modulated to trigger specific actions
63The following Table 4 provides an overview of the possible amounts of aid in the audited Member States in the 2007-2013 and 2014-2020 programming periods.
| 2007-2013 programming period | |||||
|---|---|---|---|---|---|
| Amount of aid (euro) | France | Italy (Emilia-Romagna) | Italy (Puglia) | Spain (Andalucía) | Poland1 |
| Average | 15 440 | 38 077 | 40 000 | 53 270 | 17 000 |
| Minimum | 8 000 | 15 000 | 40 000 | 24 000 | 12 000 |
| Maximum | 58 400 | 40 000 | 45 000 | 70 000 | 24 000 |
| Examples of modulation | Minimum amount increased to 16 500 euro for setting up in mountain areas | Introducing organic farming, contracting a loan, making over 60 000 euro of investments | +5 000 in less favoured areas | +10 % in less favoured areas | None |
| 2014-2020 programming period | |||||
|---|---|---|---|---|---|
| Amount of aid (euro) | France | Italy (Emilia-Romagna) | Italy (Puglia) | Spain (Andalucía) | Poland |
| Average | 20 282 in Midi-Pyrenees 12 747 in Pays-Loire | Not yet available | Not yet available | 60 331 | 24 000 |
| Minimum | 8 000 | 30 000 | 40 000 | 30 000 | 24 000 |
| Maximum | 58 000 | 50 000 | 45 000 | 70 000 | 24 000 |
| Examples of modulations | +30 % in Pays-Loire for setting up outside the family circle | + 20 000 in less favoured areas | +5 000 in less favoured areas | +25 000 if standard output above 50 000 euro | None |
1 As of 12.12.2014 it is 24 000 euro (PLN 100 000), while until 31.12.2011 it was 12 000 euro (PLN 50 000) and from 1.1.2012 to 12.12.2014 it was 17 000 euro (PLN 75 000).
Source: ECA based on Member States’ data.
64In France, Italy and Spain the amount of aid was generally linked and modulated in function of the specific needs and characteristics of the holdings (e.g. location, standard output) as well as of the actions included in the business plans (e.g. innovations, loans, investments) in 2007-2013.
65Modulations of the amount of aid proved to be a good tool to encourage young farmers to set up in more difficult conditions (e.g. in mountain areas, outside of the family circle, contracting a loan), introduce production quality systems like organic farming, water/energy saving technologies, undertake larger investments or run more productive holdings. However, for the 2014-2020 programming period the Commission required Member States not to link the amount of aid with the investments elements or their size.
Picture 2
Holding that received support to set up and introduced organic farming production methods

Source: ECA.
Poland set a fixed amount of aid (currently 24 000 euro) for any young farmer setting up, regardless of the characteristics of the holdings and content of the actions and targets set out in the business plan (e.g. location, size, investments, etc). This standardized approach increases the risk that the amount of aid might not be proportional to the needs and efforts of the young farmer setting up and does not incentivise specific actions.
Timing of aid generally appropriate
67In France, Italy and Poland the timing of the aid was generally appropriate since, in most cases, the young farmers received the aid within one year from setting-up, i.e. when it was needed to develop their holding. In fact, project applications were generally processed within a reasonable time frame (less than six months from the application date). Young farmers received the aid before implementing most of the actions set out in the business plan. So, the aid helped to mitigate the problem of access to capital and, sometimes, also to obtain a loan from banks.
68Only in Spain (Andalucía) the administrative processing times were long in 2007-2013 and on average applicants had to wait 17 months for project approval (well beyond the six-month limit the managing authority set in the calls for projects). As a result, two of the eight audited beneficiaries had made some investments before knowing if their projects would be approved. Moreover, the aid was always paid on the basis of proof of expenditure, so after the beneficiaries had made all the investments. Thus, the aid was generally provided too late in relation to young farmers’ needs in the setting up process.
Part III – Monitoring and evaluation of the measures
69To obtain performance information on the effectiveness and efficiency of EU spending:
- the Commission should establish a Common Monitoring and Evaluation Framework (CMEF) providing output, results and impact indicators allowing to assess the progress, effectiveness and efficiency of the policy against objectives (see Figure 6);
- the Member States should provide the Commission with all the information allowing the monitoring and evaluation of the measures, also by developing useful additional indicators. As far as possible, this information shall be based on established sources of data, such as the Farm Accountancy Data Network and Eurostat;
- performance evaluations should be carried out by independent contractors under the responsibility of the Commission (for Pillar 1 measures) and of the Member States (for Pillar 2 measures).
Figure 6
Hierarchy of indicators in the CMEF
Source: EC, Technical Handbook on the Monitoring and Evaluation Framework of the Common Agricultural Policy 2014-2020.
CMEF indicators do not allow assessing the performance of the measures in achieving their objectives
70In order to demonstrate the performance of the EU measures supporting young farmers in achieving their objectives (see paragraphs 26 to 30), Member States should collect data on the outputs and results achieved. Under the CMEF, Member States must collect information for the following output and result indicators as a minimum (see Table 5).
| Type of indicator | 2007-2013 Pillar 2 (measure 112 for setting up of young farmers) | 2014-2020 Pillar 2 (measure 6.1 for setting up of young farmers) | 2014-2020 Pillar 1 (payment to young farmers) |
|---|---|---|---|
| Total Public Expenditure (euro) | 5 281 543 934 | 10 440 973 292 | 2 621 619 765 |
| Output |
|
|
|
| Result |
|
| None |
| Impact1 |
|
|
1 At RDP level in 2007-2013 and related to CAP objective of viable food production in 2014-2020.
71As in previous ECA reports43, we found that the performance information collected via the CMEF indicators does not allow assessing the effectiveness and efficiency of the measures in achieving their objectives. This is mainly due to the fact that:
- for the 2007-2013 period, in all audited Member States except Italy (Emilia-Romagna, see paragraph 35), the only result indicator in the CMEF (Increase in gross value added in supported holdings) was based on unverifiable estimates and not on actual data collected from the supported holdings;
- for the 2014-2020 period there are no result indicators in the CMEF allowing to assess the improvement in the viability of the holdings, which is the ultimate objective to which such measures should contribute. The only result indicator relating to the Pillar 2 measure for the setting up of young farmers (Percentage of agricultural holdings with RDP-supported business development plan/investments for young farmers (out of total holdings)) is not a proper result indicator but rather an output indicator, as it does not measure the effect of the support in relation to its objectives (e.g. viability of the holdings, generation renewal, job creation, increase in educational and innovation level of young farmers, etc.);
- actual data on the structural and financial characteristics of the supported holdings (e.g. revenue, income, number of employees) is not usually collected. Also the estimates of income from the Farm Accountancy Data Network are not representative for supported young farmers or for the young farmers’ population44. It is therefore unknown for all audited Member States except Italy (Emilia-Romagna, see paragraph 75), whether the supported holdings are actually employing more people, becoming larger, more productive and more viable, and generating more income than non-supported holdings. It is also unknown whether holdings supported by the Pillar 1 payment for young farmers and the Pillar 2 setting-up measure are actually performing better in these respects than holdings supported only by one measure.
… however, some Member States developed useful indicators
72In addition to the compulsory indicators under the CMEF, Member States may set additional specific indicators. Table 6 provides an overview of the additional voluntary indicators set by some audited Member States in relation to the Pillar 2 setting-up measure.
| Type of indicator | Pillar 2 measure for the setting up of young farmers |
|---|---|
| Italy (Emilia-Romagna) | |
| Result |
|
| Impact |
|
| Poland | |
| Result |
|
| Impact |
|
| Spain (Andalucía) | |
| Output |
|
| Result |
|
Source: ECA elaboration based on the audited RDPs.
73These additional indicators set by Member States allow assessing the effectiveness of the measures in relation to specific objectives, such as job creation, gender balance, rejuvenation of farmers and innovation. For example, in Italy (Emilia-Romagna), thanks to the indicator ‘Number of supported young farmers introducing voluntary certification systems’ we know that 214 (13 %) out of the 1640 beneficiaries of the measure in 2007-2013 have introduced this type of innovation in their holdings. In Spain (Andalucía) thanks to the two additional output indicators, we know that the measure was less effective than expected in fostering rejuvenation of farmers (only 53 supported young farmers set up as a result of an early retirement, compared to a target of 92) and the setting-up of women (only 23 % of supported young famers were women, compared to a target of 45 % and a percentage of women under 44 years old in the farmers population in Andalucía of 32 %).
Evaluations do not generally provide valuable information on the performance of the measures, though one good practice was identified
74In the four audited Member States the mid-term and ex-post evaluations of the 2007-2013 programming period provided very little or unreliable information on the performance of measure 112 for the setting up of young farmers, except for Italy (Emilia-Romagna). For example:
- France had not yet provided (at end of February 201745) the 2007-2013 RDP ex-post evaluation report, which was due by 31.12.2016;
- Italy (Puglia) 2007-2013 RDP ex-post evaluation indicated that the average turnover of supported holdings increased, on average, by 15 500 euro from setting-up and that 73 % of the supported holdings hired new staff. However, such results are based on a web survey to which only 16 beneficiaries replied and the underlying declarations on turnover were not checked against any evidence;
- Poland 2007-2013 RDP mid-term evaluation indicated that the ‘Gross value added of the supported holdings increased, on average, by 35 % by the end of 2009’, without indicating a base year of comparison. In addition, the evaluation report indicated that this increase was largely due to the increase in the amount of grants and subsidies rather than to an increase in the value of agricultural production;
- Spain 2007-2013 RDP ex-post evaluation indicated that the ‘Gross value added of the supported holdings increased, on average, by 23.5 %’ but did not explain the estimation methodology or the source of data.
Only in Italy (Emilia-Romagna) the 2007-2013 RDP ex-post evaluation provides valuable information on the performance of the measure for setting up of young farmers (see Box 5).
Box 5
Example of an ex-post evaluation report showing the effectiveness of the measure for the setting up of young farmers
Italy (Emilia-Romagna)
The 2007-2013 RDP ex-post evaluation provides a counter-factual analysis, comparing a sample of 56 young farmers supported by measure 112 with two counter-factual samples:
- a sample of 122 farmers of all ages not-supported by the measure;
- a sample of 22 young farmers not-supported by the measure.
This analysis shows that young farmers supported by measure 112 always performed better than the other two counter-factual samples, in terms of standard output, gross added value, number of annual work units, farm size, labour productivity and land productivity.

The ex-post evaluation also shows positive results for the measure in terms of the sustainability of the supported holdings. In fact, 94.6 % of the 624 beneficiaries who set up in 2008-2009 were still in business six years later (compared to 94.3 % of farmers of all ages who set up in 2007-2013 in Emilia-Romagna). Among the supported young farmers, abandonment rates were significantly lower for holdings above 16 hectares than for smaller holdings (4.6 % vs 9.5 %) and for beneficiaries who set up in legal holdings rather than in individual holdings (3.7 % vs 6.5 %).
Limited evidence of facilitating young farmers’ setting-up
76In the four audited Member States we found limited evidence that the EU measures had facilitated the setting-up of young farmers by helping to overcome the initial entry barriers, such as access to land, capital, knowledge and sufficient income.
77The EU measures helped only to a little extent young farmers in accessing land. In fact, the Pillar 1 payment for young farmers was provided only to young farmers who already had land, while Pillar 2 was only to a little extent prompting young farmers to increase their farm size via eligibility and selection criteria (see paragraphs 60 to 61), although there was no evidence that it prompted an increase in farm viability. Only for Italy (Emilia-Romagna) was there some evidence that supported young farmers increased their farm size more than non-beneficiaries (see paragraph 75).
78In general terms, the total number of hectares held by young farmers has remained stable in the 2005-2013 period (see Figure 7). The reduction in the number of holdings held by young farmers has been offset by an increase in the average farm size.
Figure 7
Evolution of the number of holdings held by young farmers, the average size of their holdings and the total number of hectares held by young farmers in the 27 EU Member States

| million hectares | 2005 | 2007 | 2010 | 2013 |
|---|---|---|---|---|
| Total number of hectares held by young farmers | 57.7 | 54.8 | 55.2 | 51.9 |
| Total number of hectares held by farmers of all ages | 172.1 | 172.8 | 174.5 | 173.0 |
Source: ECA based on Eurostat, Farm Structure Survey 2005-2013.
79The EU measures directly helped young farmers access to capital, thanks to the provision of financial aid. However, there is no evidence – in case of the Pillar 1 payment to young farmers – and little evidence – in case of Pillar 2 measure for the setting up of young farmers – that EU aid has facilitated young farmers’ access to credit from commercial banks:
- In France and Italy (Puglia) the aid from Pillar 2 could also be provided also in the form of an interest-subsidy on a loan, however such form of aids had little success. In France many beneficiaries expressed their dissatisfaction with the fact that the loans they have obtained are non-negotiable and cannot be re-financed, obliging them to pay a fixed interest rate much higher than the current market interest rate. In Italy (Puglia), only 37 beneficiaries out of the 2 502 beneficiaries in the 2007-2013 period requested such aid, mainly because the managing authority required all investments included in the business plan to be completed before beneficiaries could request the interest subsidy;
- In Italy (Emilia-Romagna) and Poland the aid under the Pillar 2 setting-up measure was not provided in the form of an interest-subsidy on a loan, although in Italy (Emilia-Romagna) beneficiaries could receive a higher amount of aid when they obtained a loan for more than 30 000 euro (see Table 4);
- only in Spain (Andalucía), where the aid from Pillar 2 was also provided in the form of an interest-subsidy on a loan (to 567 beneficiaries out of the 738 beneficiaries in the 2007-2013 period) and the access to credit is particularly problematic for young farmers46, commercial banks became more prone to provide loans, as shown for seven out of the eight audited beneficiaries.
The EU measures, especially the Pillar 2 measure for the setting-up of young farmers, generally had a positive impact on young farmers’ knowledge levels, thanks to eligibility criteria which favoured the entry of more qualified farmers in the agricultural sector. However, this positive impact on young farmers’ knowledge levels was not ensured in Italy and Poland by the Pillar 1 payment to young farmers, as these Member States did not require applicants to have or acquire any particular skills or training.
No clear relationship between EU aid and generational renewal
81Generational renewal is a general issue that affects the entire population and labour force in the EU. As shown in Figure 8, the share of young people in the total population and in the labour force is decreasing more rapidly than in the farmers’ population.
Figure 8
Evolution of the share of young people in the total population, in the labour force and in the farmer population in the 27 EU Member States.

Source: ECA based on Eurostat data from Population Census (2005-2015), Labour Force Survey (2005-2015) and Farm Structure Survey (2005-2013).
It is generally not possible to establish a clear relationship between the EU aid provided and the evolution of the number of young farmers (see Figure 9). It is also difficult to know if and to what extent the EU aid has contributed to the increase in the average farm size (see paragraphs 77 and 78), or if this increase has led to a higher viability of the holdings.
Figure 9
Comparison of share of EAFRD expenditure for setting up of young farmers (measure 112) and variation in the number of farmers up to 44 years old in 2007-2013

Source: ECA based on Eurostat, Farm Structure Survey 2007-2013 and Commission data (at January 2017).
This is due to various reasons:
- the EU aid is generally provided to a small percentage of young farmers: only 7 % of all young farmers existing in 27 EU Member States47 received EU aid for setting up;
- there are several national policies supporting young farmers, which are rarely coordinated with the EU measures (see paragraphs 16 and 31 to 32).
- the monitoring and evaluation system does not produce adequate information on the achievement of the objectives, mainly because of the low quality of indicators provided by the common monitoring system (see paragraphs 70 to 71) and the limited or unreliable performance information provided by most evaluations (see paragraph 74);
- there are general factors other than EU measures influencing this relationship, such as the economic and social situation, the propensity of banks to provide loans, and the employment possibilities in sectors other than agriculture (see paragraph 16).
Conclusions and recommendations
84EU agriculture is facing a decreasing farming population. The overall number of farmers in the EU-27 has rapidly decreased in the last decade, falling from 14.5 million farmers in 2005 to 10.7 million farmers in 2013. Young farmers (up to 44 years old) fell from 3.3 million in 2005 to 2.3 million in 2013. As the reduction affected all age groups, the percentage of young farmers in the farming population remained relatively stable, slightly above 20 %. However, significant differences exist between Member States (see Annex II).
85In 2007-2020 the EU allocated 9.6 billion euro in specific support to young farmers to foster the competitiveness of agricultural holdings and generational renewal in agriculture. Together with Member States’ co-financing of Pillar 2 setting-up measure, the total public support amounts to 18.3 billion euro. Almost 200 000 young farmers received the EU aid for setting up in the 2007-2013 period. More than 70 % of the EU spending was provided under the Pillar 2 (EAFRD) measure for setting up of young farmers and the remaining 30 % is provided, in 2014-2020, under the Pillar 1 (EAGF) additional direct payment for young farmers.
86Against this backdrop, we examined the role of the EU in supporting young farmers and fostering generational renewal. The audit sought to answer the following question:
Is the EU support to young farmers well designed to contribute effectively towards improved generational renewal?
87The overall conclusion is that the EU support to young farmers is based on a poorly defined intervention logic, with no expected result and impact specified. It should be better targeted to foster effective generational renewal.
88As regards the intervention logic:
For Pillar 1 payment for young farmers we found that:
- It is not based on a needs assessment, its objective does not reflect the general objective of encouraging generational renewal, and Member States did not coordinate it with Pillar 2 setting-up measure or national measures (see paragraphs 19 to 33);
- In the absence of a needs assessment the aid is provided in a standardized form (annual payment per hectare), in an amount and in a timing where it is unclear which specific needs other than additional income are addressed (see paragraphs 39 to 51).
For Pillar 2 measure for setting up of young farmers we found that:
- Although it is generally based on a vague needs assessment, its objectives are partially SMART and reflect the general objective of encouraging generational renewal. There is good coordination between the Pillar 2 measures for setting-up and investments. However, there is little coordination with national financial instruments, such as loans at favourable conditions to buy land (see paragraphs 19 to 37);
- The aid is provided in a form addressing directly the young farmers’ needs of access to land, capital and knowledge. The amount of aid is generally linked to the needs and modulated to trigger specific actions, like introducing organic farming, water or saving initiatives, setting up in less favoured areas (see paragraphs 25 and 52 to 53).
Recommendation 1 – Improve the intervention logic by reinforcing needs assessment and defining SMART objectives
For the post-2020 CAP, the Commission should indicate (or require Member States to indicate, in line with the shared management provisions) clear intervention logic for the policy instruments addressing generational renewal in agriculture. The intervention logic should include:
- a sound assessment of young farmers’ needs investigating the underlying reasons why young people willing to become farmers face barriers in their setting up process and the degree of diffusion of such barriers across geographical areas, agricultural sectors or other specific holdings’ characteristics;
- an assessment of which needs could be addressed by EU policy instruments and which needs can be or are already better addressed by Member States’ policies as well as an analysis of which forms of support (e.g. direct payments, lump sum, financial instruments) are best suited to match the identified needs;
- a definition of SMART objectives, making explicit and quantifiable the expected results of the policy instruments in terms of expected generational renewal rate and contribution to the viability of the supported holdings; in particular it should be clear if the policy instruments should aim at supporting as many young farmers as possible or target specific type of young farmers (e.g. the most educated, those setting up in less favoured areas, those introducing energy or water savings technologies in the holdings, those increasing the profitability or productivity of the holdings, those employing more people).
As regards the targeting of the measures:
For Pillar 1 payment to young farmers we found that:
- The aid is provided in a standardized form regardless of the viability of the holdings, their location and, in most Member States, the skills and/or educational levels of beneficiaries. In case of joint control of legal holdings with other non-young farmers, the aid is sometimes provided to holdings in which young farmers could have only a minor role – in terms of decision making power – (see paragraphs 39 to 46).
For Pillar 2 measure for setting up of young farmers we found that:
- The aid is directed to more qualified farmers, who commit to implement a business plan guiding them in developing viable holdings and who are often encouraged through the project selection process to set up in less favoured areas. However, business plans were of variable quality and managing authorities often did not apply selection procedures to prioritise best projects. Selection criteria were introduced late in the 2007-2013 period, minimum thresholds were either too low or non-existent and the 7-years budget of the measure was used up in some Member States to fund nearly all applications submitted at the start of the programming period, implying that young farmers who set up later could not be funded (see paragraphs 52 to 61).
Recommendation 2 – Improve the targeting of the measures
When implementing the post-2020 CAP measures, the Member States should improve the targeting of the measures by:
- applying criteria to ensure the selection of the most cost-effective projects, such as projects delivering the highest increase in productivity or viability of the supported holdings, or the highest increase in employment in the areas with highest unemployment or in less favoured areas with lowest generational renewal;
- applying clear criteria for assessing the role of young farmers to be supported in case of joint control of legal holdings (e.g. by defining what percentage of voting rights or shares the beneficiary should have, what minimum percentage of her/his revenues should come from his activity in the supported holding) to direct the aid towards young farmers making farming in the supported holdings their main activity;
- applying sufficiently high minimum thresholds of points that projects should reach and adequately split the budget of the measures to provide equal availability of funds to young farmers setting up during the entire duration of the programming period;
- improve the use of business plans as a tool to assess both the need for public funding by assessing – at application stage – the likely viability of the holdings without the aid and – at the end of the projects – the impact of the aid on the viability of the holding or on other clearly specified objectives (e.g. employment, introduction of energy or water savings technologies).
As regards the results of the measures:
For Pillar 1 payment for young farmers we found that:
- The common monitoring and evaluation framework does not provide useful indicators to assess the effectiveness of this payment, as there is no result indicator for this payment and data on the income and viability of the supported holdings are not collected (see paragraph 70 to 71).
For Pillar 2 measure for setting up of young farmers we found that:
- There is little evidence that the measure has facilitated the setting up of young farmers and improved the generational renewal and the viability of the supported holdings, mainly because of the low quality of the indicators provided by the common monitoring and evaluation system. Only in Italy (Emilia-Romagna) we found evidence that beneficiaries of the setting up measure developed larger holdings, more productive, more profitable and employing more people than non-supported ones (see paragraphs 70 to 83).
Recommendation 3 – Improve the monitoring and evaluation system
When implementing the post-2020 CAP measures, the Commission and the Member States (in line with the shared management provisions) should improve the monitoring and evaluation system. In particular:
- the Commission should define output, result and impact indicators allowing to assess the progress, effectiveness and efficiency of the policy tools against objectives, by drawing on best practices, such as useful indicators developed by Member States in their monitoring systems (see paragraphs 72 and 73);
- the Member States should regularly collect actual data on the structural and financial characteristics of the supported holdings (e.g. revenues, income, number of employees, innovations introduced, farmers’ educational levels) allowing assessing the efficiency and effectiveness of the measures in achieving the desired policy objectives;
- the Commission and the Member States should require evaluations to provide useful information on the achievements of the projects and measures based on actual data on the evolution of the structural and financial characteristics of the supported holdings, by drawing on best practices (e.g. benchmarking, counter-factual analyses, surveys) such as those identified in this audit (see paragraph 75).
This Report was adopted by Chamber I, headed by Mr Phil WYNN OWEN, Member of the Court of Auditors, in Luxembourg at its meeting of 31 May 2017.
For the Court of Auditors

Klaus-Heiner LEHNE
President
Annexes
Annex I
Variation in the number of farmers up to 44 years old between 2007 and 2013 in Member States
| Member State | Number of farmers up to 44 years old | Variation in the number of farmers up to 44 years old between 2007 and 2013 | |
|---|---|---|---|
| 2007 | 2013 | ||
| Belgium | 13 580 | 7 240 | -6 340 |
| Bulgaria | 61 540 | 49 980 | -11 560 |
| Czech Republic | 10 660 | 5 080 | -5 580 |
| Denmark | 12 190 | 6 700 | -5 490 |
| Germany | 133 080 | 75 570 | -57 510 |
| Estonia | 5 120 | 4 670 | -450 |
| Ireland | 33 770 | 32 020 | -1 750 |
| Greece | 188 470 | 141 220 | -47 250 |
| Spain | 216 810 | 158 620 | -58 190 |
| France | 167 220 | 131 970 | -35 250 |
| Croatia | Data not available | ||
| Italy | 231 970 | 155 270 | -76 700 |
| Cyprus | 5 780 | 3 020 | -2 760 |
| Latvia | 27 090 | 15 990 | -11 100 |
| Lithuania | 48 990 | 33 460 | -15 530 |
| Luxembourg | 690 | 540 | -150 |
| Hungary | 139 150 | 103 330 | -35 820 |
| Malta | 1 680 | 1 570 | -110 |
| Netherlands | 21 080 | 13 090 | -7 990 |
| Austria | 67 480 | 49 680 | -17 800 |
| Poland | 808 330 | 512 690 | -295 640 |
| Portugal | 28 450 | 25 640 | -2 810 |
| Romania | 638 490 | 676 770 | 38 280 |
| Slovenia | 12 810 | 13 860 | 1 050 |
| Slovakia | 10 940 | 5 550 | -5 390 |
| Finland | 21 850 | 16 620 | -5 230 |
| Sweden | 16 980 | 11 510 | -5 470 |
| United Kingdom | 42 740 | 27 650 | -15 090 |
| EU-27 | 2 966 940 | 2 279 310 | -687 630 |
Source: Eurostat, Farm Structure Survey 2007 and 2013.
Annex II
Distribution of farmers per age group in Member States in 2007 and 2013
| Member State | <35 | 35-44 | 45-54 | 55-64 | 65+ | |||||
|---|---|---|---|---|---|---|---|---|---|---|
| 2007 | 2013 | 2007 | 2013 | 2007 | 2013 | 2007 | 2013 | 2007 | 2013 | |
| Belgium | 6.1 % | 4.0 % | 22.2 % | 15.2 % | 28.6 % | 32.9 % | 22.7 % | 26.8 % | 20.5 % | 21.2 % |
| Bulgaria | 3.1 % | 6.4 % | 9.4 % | 13.2 % | 17.5 % | 18.5 % | 25.1 % | 25.2 % | 45.0 % | 36.7 % |
| Czech Republic | 9.7 % | 4.6 % | 17.4 % | 14.8 % | 27.2 % | 23.8 % | 28.5 % | 33.9 % | 17.2 % | 23.0 % |
| Denmark | 5.9 % | 2.5 % | 21.4 % | 14.7 % | 29.1 % | 31.2 % | 23.9 % | 27.6 % | 19.6 % | 24.0 % |
| Germany | 7.7 % | 6.8 % | 28.2 % | 19.7 % | 33.9 % | 37.2 % | 22.6 % | 29.8 % | 7.5 % | 6.5 % |
| Estonia | 6.2 % | 7.5 % | 15.8 % | 16.8 % | 23.1 % | 23.4 % | 23.8 % | 21.8 % | 31.1 % | 30.4 % |
| Ireland | 8.1 % | 6.3 % | 18.3 % | 16.7 % | 24.6 % | 25.1 % | 25.5 % | 25.5 % | 23.5 % | 26.5 % |
| Greece | 6.9 % | 5.2 % | 15.1 % | 14.7 % | 21.6 % | 23.9 % | 20.2 % | 24.9 % | 36.3 % | 31.3 % |
| Spain | 5.2 % | 3.7 % | 15.6 % | 12.7 % | 23.3 % | 25.0 % | 24.5 % | 25.2 % | 31.4 % | 33.3 % |
| France | 8.1 % | 8.8 % | 23.6 % | 19.1 % | 31.5 % | 32.7 % | 23.9 % | 27.0 % | 12.9 % | 12.4 % |
| Croatia | data not available | |||||||||
| Italy | 3.1 % | 4.5 % | 10.7 % | 10.8 % | 19.4 % | 21.6 % | 23.9 % | 23.3 % | 42.9 % | 39.7 % |
| Cyprus | 2.4 % | 1.7 % | 12.0 % | 6.9 % | 26.7 % | 21.4 % | 29.1 % | 30.1 % | 29.8 % | 40.0 % |
| Latvia | 7.1 % | 5.0 % | 18.1 % | 14.5 % | 25.0 % | 26.3 % | 20.7 % | 24.1 % | 29.2 % | 30.1 % |
| Lithuania | 4.4 % | 5.6 % | 16.9 % | 13.9 % | 21.4 % | 25.6 % | 18.2 % | 20.9 % | 39.1 % | 34.0 % |
| Luxembourg | 7.4 % | 8.7 % | 22.5 % | 17.3 % | 33.8 % | 32.2 % | 22.5 % | 27.4 % | 13.9 % | 14.4 % |
| Hungary | 7.6 % | 6.1 % | 14.6 % | 14.9 % | 23.2 % | 19.4 % | 27.1 % | 29.2 % | 27.5 % | 30.3 % |
| Malta | 4.9 % | 3.8 % | 10.3 % | 12.9 % | 29.3 % | 24.8 % | 32.4 % | 33.4 % | 23.0 % | 25.1 % |
| Netherlands | 4.0 % | 3.1 % | 23.5 % | 16.3 % | 28.7 % | 32.7 % | 26.1 % | 26.9 % | 17.7 % | 21.0 % |
| Austria | 11.0 % | 10.9 % | 29.7 % | 24.4 % | 33.3 % | 36.5 % | 16.5 % | 19.6 % | 9.4 % | 8.6 % |
| Poland | 12.2 % | 12.1 % | 21.6 % | 23.7 % | 31.1 % | 30.2 % | 19.3 % | 24.3 % | 15.8 % | 9.6 % |
| Portugal | 2.2 % | 2.5 % | 8.2 % | 7.2 % | 17.6 % | 16.6 % | 25.4 % | 23.6 % | 46.7 % | 50.1 % |
| Romania | 4.4 % | 4.7 % | 11.9 % | 13.9 % | 17.0 % | 16.9 % | 22.6 % | 23.5 % | 44.2 % | 41.0 % |
| Slovenia | 4.0 % | 4.8 % | 13.0 % | 14.4 % | 24.6 % | 26.4 % | 23.5 % | 29.1 % | 34.9 % | 25.3 % |
| Slovakia | 3.8 % | 8.1 % | 12.0 % | 15.4 % | 25.2 % | 24.9 % | 27.3 % | 30.0 % | 31.7 % | 21.6 % |
| Finland | 9.2 % | 8.5 % | 22.8 % | 22.0 % | 32.0 % | 30.1 % | 29.8 % | 29.1 % | 6.2 % | 10.2 % |
| Sweden | 6.0 % | 4.4 % | 17.4 % | 12.8 % | 26.7 % | 24.8 % | 29.3 % | 28.0 % | 20.6 % | 30.0 % |
| United Kingdom | 3.9 % | 3.9 % | 15.0 % | 11.0 % | 25.0 % | 26.6 % | 28.6 % | 27.9 % | 27.6 % | 30.6 % |
| EU-27 | 6.3 % | 6.0 % | 15.5 % | 15.3 % | 22.8 % | 22.9 % | 22.7 % | 24.7 % | 32.7 % | 31.1 % |
Source: Eurostat, Farm Structure Survey 2007 and 2013.
Annex III
EU budget for young farmers per Member State
| Member State | 2007-2013 programming period (expenditure) | 2014-2020 programming period (allocated budget) | ||
|---|---|---|---|---|
| Number of young famers supported under Pillar 2 measure 112 | Pillar 2 measure 112 for setting up of young farmers (euro) | Pillar 2 measure 6.1 for setting up of young farmers (euro) | Pillar 1 direct payment for young farmers (euro) | |
| Belgium | 2 152 | 32 563 695 | 46 833 607 | 42 897 688 |
| Bulgaria | 5 808 | 92 325 533 | 68 861 719 | 18 576 263 |
| Cyprus | 320 | 4 504 895 | 7 000 000 | 1 891 663 |
| Czech Republic | 1 364 | 41 734 186 | 24 750 000 | 8 511 002 |
| Denmark | 3 811 130 | 44 088 268 | ||
| Estonia | 846 | 24 253 253 | 18 164 000 | 1 891 635 |
| Finland | 2 966 | 41 510 603 | 33 088 500 | 26 189 410 |
| France | 34 629 | 631 741 559 | 902 843 886 | 362 156 470 |
| Germany | 325 | 2 254 554 | 242 542 160 | |
| Greece | 19 128 | 246 270 288 | 276 800 000 | 187 750 920 |
| Hungary | 8 411 | 219 299 316 | 108 867 861 | 16 127 358 |
| Ireland | 862 | 6 504 938 | 121 258 400 | |
| Italy | 21 925 | 335 322 041 | 460 259 594 | 190 086 580 |
| Latvia | 407 | 11 168 738 | 9 452 635 | 15 515 660 |
| Lithuania | 2 668 | 77 645 851 | 55 000 000 | 31 296 288 |
| Luxemburg | 267 | 1 612 973 | 2 209 200 | 2 512 935 |
| Malta | 3 225 000 | 104 844 | ||
| Netherlands | 72 480 060 | |||
| Austria | 9 375 | 59 831 898 | 46 704 425 | 69 214 480 |
| Poland | 38 857 | 570 569 560 | 456 849 802 | 170 675 060 |
| Portugal | 8 595 | 226 807 119 | 194 263 175 | 58 237 760 |
| Romania | 12 770 | 260 504 741 | 400 355 600 | 102 773 360 |
| Slovakia | 22 302 000 | 7 796 253 | ||
| Slovenia | 2 652 | 41 500 643 | 48 520 000 | 9 516 155 |
| Spain | 17 603 | 305 951 740 | 542 330 984 | 486 689 740 |
| Sweden | 1 796 | 19 928 329 | 6 564 399 | 55 839 760 |
| United Kingdom | 102 | 883 508 | 27 832 582 | 250 504 493 |
Source: ECA based on Commission’s data.
Annex IV
Intervention logic of Pillar 1

Annex V
Member States’ implementation choices for Pillar 1 payment for young farmers
| Member State | Additional eligibility criteria | Payment to farmer | ||||||||
|---|---|---|---|---|---|---|---|---|---|---|
| As regards appropriate skills | As regards training requirements | Applied to all YF in control over the legal person | Calculated as 25 % of the | |||||||
| Average value of entitlements held by a farmer | BPS flat rate | Single area payment | National average payment per ha | |||||||
| Belgium | 1.89 | N | Y | N | N | |||||
| Belgium Flanders | N | Y | N | N | N | N | Y | 90 | N | |
| Belgium Wallonia | Y | Y | N | N | N | N | Y | 90 | N | |
| Bulgaria | 0.47 | N | Y | N | N | N | Y | N | 30 | N |
| Czech Republic | 0.20 | N | N | N | N | N | Y | N | 90 | N |
| Denmark | 2.00 | N | N | N | N | N | N | Y | 90 | N |
| Germany | 1.00 | N | N | N | N | Y | N | N | 90 | N |
| Estonia | 0.30 | N | N | N | N | N | Y | N | 39 | N |
| Ireland | 2.00 | N | Y | Y | N | N | N | Y | 50 | N |
| Greece | 2.00 | N | N | N | Y | N | N | N | 25 | N |
| Spain | 2.00 | Y | Y | Y | Y | N | N | N | 90 | N |
| France | 1.00 | Y | Y | N | N | N | N | Y | 34 | N |
| Croatia | 2.00 | N | Y | Y | N | Y | N | N | 25 | N |
| Italy | 1.00 | N | N | N | Y | N | N | N | 90 | N |
| Cyprus | 1.00 | N | N | N | N | N | N | Y | 90 | N |
| Latvia | 1.50 | N | N | N | N | N | Y | 90 | N | |
| Lithuania | 1.75 | N | N | N | N | N | N | Y | 90 | N |
| Luxembourg | 1.50 | Y | Y | Y | N | N | N | N | Y | |
| Hungary | 0.20 | N | N | N | N | N | N | Y | 90 | N |
| Malta | 0.40 | N | N | Y | N | N | N | 90 | N | |
| Netherlands | 2.00 | N | N | N | N | N | Y | 90 | N | |
| Austria | 2.00 | Y | N | N | N | N | N | Y | 40 | N |
| Poland | 1.00 | N | N | N | N | N | Y | 50 | ||
| Portugal | 2.00 | Y | Y | N | N | Y | N | N | 90 | N |
| Romania | 1.79 | N | N | N | N | N | Y | N | 60 | N |
| Slovenia | 1.00 | N | N | N | N | N | N | Y | 90 | N |
| Slovakia | 0.55 | Y | Y | Y | N | N | N | Y | 28 | N |
| Finland | 1.00 | N | N | N | N | N | Y | 90 | N | |
| Sweden | 2.00 | N | N | N | N | N | N | Y | 90 | N |
| United Kingdom | 1.63 | Y | N | N | N | |||||
| United Kingdom (England) | N | N | N | Y | N | N | N | 90 | N | |
| United Kingdom (Northern Ireland) | N | Y | Y | N | N | N | Y | 90 | N | |
| United Kingdom (Scotland) | N | N | N | Y | N | N | N | 90 | N | |
| United Kingdom (Wales) | N | N | N | N | Y | N | N | 25 | N | |
Glossary
Active farmer: The active farmer provision set in Article 9 of Regulation (EU) No 1307/20131 aims at preventing individuals and companies from receiving support from the CAP when their business is not agricultural or is only marginally so. The key element of the active farmer provision is a negative list of businesses/activities, which includes airports, waterworks, real estate services, railway services and permanent sport and recreational grounds. If Member States want to, they can apply a stricter definition of active farmer.
Agricultural holding: A single unit, in both technical and economic terms, operating under a single management, which undertakes agricultural activities within the economic territory of the European Union, either as its primary or secondary activity. Other supplementary (non-agricultural) products and services may also be provided by the holding.
CAP (Common Agricultural Policy): The set of legislation and practices adopted by the European Union to provide a common, unified policy on agriculture. The initial measures were introduced in 1962. Since then, the policy has been adapted and developed and has undergone a number of reforms.
CMEF (Common Monitoring and Evaluation Framework): EU-wide monitoring and evaluation framework for rural development in the 2007-2013 programming period. For the 2014-2020 programming period it covers both CAP pillars (EAFRD and EAGF).
Direct payments: Are granted directly to farmers to ensure them a safety net. They are mainly granted in the form of a basic income support, decoupled from production, stabilising their income stemming from sales on the markets, which are subject to volatility. They are provided by the European Agricultural Guarantee Fund, commonly referred to as ‘Pillar 1’ of the CAP.
EAFRD: European Agricultural Fund for Rural Development. It finances the EU’s contribution to rural development programmes and is commonly referred to as ‘Pillar 2’ of the CAP.
EAGF: European Agricultural Guarantee Fund. It primarily finances direct payments to farmers and measures regulating or supporting agricultural markets and is commonly referred to as ‘Pillar 1’ of the CAP.
Farm accountancy data network (FADN): An instrument for evaluating the income of commercial agricultural holdings and the impacts of the CAP. It is based on the accounting data of a sample of more than 80 000 agricultural holdings across all the EU Member States.
Farm structure survey (FSS): A survey carried out by all EU Member States. The FSS are conducted consistently throughout the EU using a common methodology and provide comparable and representative statistics across countries and time, at regional levels. The FSS is carried out every three or four years as a sample survey, and every ten years as a census.
Impact: Long-term changes in society that are, at least partly, attributable to the EU’s action.
Intervention logic: Sets out the relationship between the socio-economic needs to be addressed by the intervention and its objectives, inputs, processes, outputs, results and impacts.
Managing authority: The local, regional or national body appointed by the Member State to submit a Rural Development Programme to the Commission and then manage and implement it.
Output: The deliverables of the programme.
Paying Agency: The national or regional body responsible for assessing, calculating and paying out agricultural subsidies.
Payment entitlements: Introduced by the 2003 reform of the CAP to implement the single payment scheme. Payment entitlements were distributed to farmers based on historical data (at regional or individual farmer level). Following the 2003 reform, to qualify for a single payment, a farmer had to activate the payment entitlements that he or she held together with the same number of eligible agricultural hectares. The 2013 reform replaced these payment entitlements with newly-established payment entitlements under the basic payment scheme. By derogation, some Member States that fulfilled certain conditions may keep existing payment entitlements.
Pillar: The CAP consists of two funds, also referred to as ‘pillars’: ‘Pillar 1’ is used to refer to the EAGF, providing direct payments to farmers, while ‘Pillar 2’ is used to refer to EAFRD, financing rural development programmes.
Programming period: Multiannual framework planning and implementing EU policies such as the rural development policy. This audit concerns the 2007-2013 and 2014-2020 periods.
Result: The immediate effects of the programme on direct addresses or recipients.
Rural Development Programme (RDP): A programming document prepared by a Member State and approved by the Commission for planning and monitoring the implementation of the EU rural development policy at regional or national level.
Shared management: Method of implementing the EU budget whereby implementation tasks are delegated to the Member States2, while the Commission retains final responsibility (supervisory duties).
SMART objectives: Specific, measurable, achievable, relevant and timed objectives3.
Young farmer: Under Pillar 1, a person who is under 40 years old at the moment of submitting the application and is setting up for the first time in an agricultural holding as head of the holding, or has already set up such holding in the last five years prior to application, as defined in Article 50(2) of Regulation (EU) 1307/2013. Under Pillar 2, a person who is under 40 years old at the moment of submitting the application and is setting up for the first time in an agricultural holding as head of the holding and possess adequate occupational skills and competence, as defined in Article 2(n) of Regulation (EU) No 1305/20134. It is not possible to know the number of farmers up to 40 years old as Eurostat data does not split the age group 35-44 years into further sub-groups.
Endnotes
Glossary
1 Regulation (EU) No 1307/2013 of the European Parliament and of the Council of 17 December 2013 establishing rules for direct payments to farmers under support schemes within the framework of the common agricultural policy and repealing Council Regulation (EC) No 637/2008 and Council Regulation (EC) No 73/2009 (OJ L 347, 20.12.2013, p. 608).
2 Article 59 of Regulation (EU, Euratom) No 966/2012 of the European Parliament and of the Council of 25 October 2012 on the financial rules applicable to the general budget of the Union and repealing Council Regulation (EC, Euratom) No 1605/2002 (OJ L 298, 26.10.2012, p. 1).
3 Article 30(3) of Regulation (EU, Euratom) No 966/2012.
4 Regulation (EU) No 1305/2013 of the European Parliament and of the Council of 17 December 2013 on support for rural development by the European Agricultural Fund for Rural Development (EAFRD) and repealing Council Regulation (EC) No 1698/2005 (OJ L 347, 20.12.2013, p. 487)
Introduction
5 Croatia was not included in the statistics up to 2013.
6 Eurostat provides data for the following age groups: less than 35, 35-44, 45-54, 55-64, more than 65 years.
7 The Farm Structure Survey is carried out every three years by all Member States with a common methodology and provides therefore comparable and representative statistics over time across Member States. It is not possible to know the number of farmers up to 40 years old as Eurostat data does not split the age group 35-44 years old into further sub-groups.
8 European Parliament resolution of 5 June 2008 on the future for young farmers under the ongoing reform of the CAP (2007/2194(INI)).
9 European Parliament resolution of 23 June 2011 on the CAP towards 2020: meeting the food, natural resources and territorial challenges of the future (2011/2051(INI)).
10 EU Council, Presidency conclusions on strengthening of EU policies for young farmers, Agriculture and Fisheries Council meeting Brussels, 15 December 2014.
11 European Commission, ‘Young farmers and the CAP’, Luxembourg, Publications Office of the European Union, 2015.
12 Speech by Commissioner Phil Hogan at JOINT ENRD/CEJA Workshop on generational renewal – Brussels, 25 January 2017.
13 Council Directive 81/528/EEC of 30 June 1981 amending Directive 72/159/EEC on the modernization of farms (OJ L 197, 20.7.1981, p. 41) introducing, inter alia, specific measures aimed at young farmers under the age of 40.
14 Council Regulation (EC) No 1257/1999 of 17 May 1999 on support for rural development from the European Agricultural Guidance and Guarantee Fund (EAGGF) and amending and repealing certain Regulations (OJ L 160, 26.6.1999, p. 80).
15 See Regulation (EU) No 1307/2013, in particular Preamble (47): ‘The creation and development of new economic activity in the agricultural sector by young farmers is financially challenging and constitutes an element that should be considered in the allocation and targeting of direct payments. This development is essential for the competitiveness of the agricultural sector in the Union’.
Audit scope and approach
16 See European Parliament, ‘Report on the state of play of farmland concentration in the EU’ (2016/2141(INI)): in 2010 only 3 % of farms already controlled 50 % of agricultural land in the EU-27, ‘whereas EU policies and subsidies encourage concentration phenomena, as direct payments disproportionately benefit large farmers, and the use of these funds leads to a rise in market prices’.
17 ECORYS, LEI-Wageningen UR, Aequator Groen & Ruimte for Commission: ‘Young farmers’ needs’, September 2015. As part of the study, carried out in 2014-2015, an average of 78 interviews was conducted with farmers in each EU Member State. The results of these surveys and the needs of young farmers were discussed by focus groups in the individual Member States.
18 See European Parliament, ‘Study on possible effects on land markets on EU land of new direct payments’, 2013: ‘New Member States’ land sales and rental prices have increased strongly with the increase in SAPS since accession in 2004. The correlation between the direct payments and the land prices is very strong.’ and ‘There is significant capitalization of SPS in the EU-15’. See also Italian national Institute of Agricultural Economy,‘Young people and generational renewal in Italian agriculture’, 2013.
19 ECORYS, LEI-Wageningen UR, Aequator Groen & Ruimte for Commission: ‘Young farmers’ needs’, September 2015.
20 For France see Annual Report (2007) of the French Court of Auditors.
For Italy see Italian national Institute of Agricultural Economy, ‘Young people and generational renewal in Italian agriculture’, 2013.
For Spain see paragraph 68 of this report.
21 ECORYS, LEI-Wageningen UR, Aequator Groen & Ruimte for Commission: ‘Young farmers’ needs’, September 2015.
22 Eurostat, ‘Farm Structure Survey 2007-2013’.
Observations
23 Recital 47 of Regulation (EU) No 1307/2013: ‘The creation and development of new economic activity in the agricultural sector by young farmers is financially challenging and constitutes an element that should be considered in the allocation and targeting of direct payments’.
24 SEC(2011) 1153 final/2 of 20.10.2011 ‘Impact Assessment Common Agricultural Policy towards 2020’, Annex 3.
25 The Farm Net Added Value is an income indicator of the Farm Accountancy Data Network, which measures the amount available to pay for all fixed production factors of an agricultural holding (land, labour and capital).
26 European Commission, Agricultural Policy Perspective Brief, N°5 ‘Overview of CAP Reform 2014-2020’, December 2013.
27 Source: Ex-post evaluation of the 2007-2013 RDP Emilia-Romagna, see also paragraph 75.
28 For beneficiaries of both measures, only the share of the increase of annual gross added value related to the aid provided by the setting-up measure has been considered.
29 On average Member States devoted 1.33 % of their 2015 direct payment’s budget to this additional payment for young farmers. This refers to estimated financing needs, not actual expenditure.
30 Article 50(6) to 50(8) of Regulation 1307/2013. As an alternative, Member States may opt for an annual lump-sum payment irrespective of the size of a holding (only Luxembourg chose this option), as foreseen by Article 50(10) of Regulation 1307/2013.
31 Belgium, Bulgaria, Ireland, Spain, France, Croatia, Luxembourg, Austria, Portugal, Slovakia and United Kingdom (Northern Ireland).
32 Estonia, Cyprus, Lithuania and Finland opted to limit access to this payment to legal entities controlled solely by young farmers for the period 2016-2020 and Latvia for the period 2017-2020.
33 See Annex V for an overview.
34 Renta de referencia: Indicator of non-agricultural gross salaries for Spain. It is set out by Spanish national law No 19/1995. In 2016, its value was 28 397 euro.
35 As defined by Article 9 of Regulation (EU) 1307/2013. See definition in the Glossary.
36 This is the simplest and most common type of company in Italian agriculture. It is defined by Articles 2251-2290 of the Italian Civil Code.
37 Based on partial data provided by Member States to the Commission and the Court of Auditors: data from Croatia, France, Italy, Romania, Malta and the United Kingdom were still missing or incomplete at the end of February 2017.
38 According to the Farm Accountancy Data Network the average Farm Net Value Added (FNVA) in the E27 EU Member States in 2012 was around 30 000 euro, while the FNVA per Annual Work Unit was around 19 000 euro.
39 Istituto Nazionale di Economia Agraria, ‘I giovani e il ricambio generazionale nell’agricoltura italiana’, 2013, p. 45. This value is based on the survey conducted in the framework of the Farm Accountancy Data Network and may not be statistically representative of the population of farmers less than 40 years old in Italy.
40 Rural areas with overall development problems represent the most disadvantaged territories of the region, in which the difficult topography and the scarcity of infrastructure limits productive activities, and are characterised by a significantly lower GDP per capita than other areas.
41 Salaire minimum interprofessionnel de croissance (SMIC), net of social contributions. This is calculated by the French statistical office and equals to a gross monthly salary of 1 480 euro (at 1.1.2017) based on 151.67 working hours per month.
42 Renta de referencia: Indicator of non-agricultural gross salaries for Spain. It is set out by Spanish national law No 19/1995. In 2016, its value was 28 397 euro.
43 See Special Reports Nos 8/2012, 1/2013, 6/2013, 12/2013, 25/2015 (http://eca.europa.eu).
44 The FADN sample was set up to observe incomes of commercial agricultural holdings. It can provide useful information about the business performance of agricultural holdings per agricultural sector and size class. However, it was not designed to be representative of specific groups such as CAP beneficiaries or young farmers. Therefore, sufficiently representative information is not available on the income of young farmers or on the effects of specific EU support measures, such as the measure for setting up of young farmers. For further information see Special Report No 1/2016 paragraphs 48 to 50 (http://eca.europa.eu).
45 France provided the ex-post evaluation report at the end of March 2017, after the closure of this audit.
46 According to the ECORYS, LEI-Wageningen UR, Aequator Groen & Ruimte for Commission: ‘Young farmers’ needs in Spain’, September 2015, 56 % of young farmers in Spain perceived access to credit as problematic, compared to 33 % of young farmers in the 28 EU Member States.
47 Based on average number of farmers in the age group 15-44 years old in the 2007-2013 period.
Reply of the Commission
1 Letters to DK (Ares(2015)162942 of 15/01/2015), NL (Ares(2015)1173220 - 17/03/2015), EE (Ares(2016)6004433 - 19/10/2016) which have been made available in due time for consultation by Member State authorities via CircaBC.
2 Expert workshop ‘Payment for Young Farmers – exchange of Member States’ experiences of implementation and control’ organised on 23 September 2015 (documentation available to Member States in CircaBC).
| Event | Date |
|---|---|
| Adoption of the Audit Planning Memorandum/Start of audit | 16.3.2016 |
| Official sending of draft report to Commission (or other auditee) | 30.3.2017 |
| Adoption of the final report after the adversarial procedure | 31.5.2017 |
| Commission’s (or other auditee’s) official replies received in all languages | 28.6.2017 |
Audit team
The ECA’s special reports set out the results of its performance and compliance audits of specific budgetary areas or management topics. The ECA selects and designs these audit tasks to be of maximum impact by considering the risks to performance or compliance, the level of income or spending involved, forthcoming developments and political and public interest.
This report was adopted by Audit Chamber I — headed by ECA Member Phil Wynn Owen — which specialises in sustainable use of natural resources. The audit was led by ECA Member Janusz Wojciechowski, supported by Kinga Wisniewska-Danek, head of private office; Katarzyna Radecka-Moroz, private office attaché; Helder Faria Viegas, principal manager; Lorenzo Pirelli, head of task, Malgorzata Frydel, deputy head of task. The audit team consisted of Antonio Caruda Ruiz, Anzela Poliulianaite, Carlos Sanchez Rivero, Frédéric Soblet, Matteo Tartaggia and Diana Voinea. Secreterial assistance was provided by Frederique Hussenet, Monika Schmidt and Terje Teppan-Niesen.

Contact
EUROPEAN COURT OF AUDITORS
12, rue Alcide De Gasperi
1615 Luxembourg
LUXEMBOURG
More information on the European Union is available on the internet (http://europa.eu).
EU support to young farmers should be better targeted to foster effective generational renewal
(pursuant to Article 287(4), second subparagraph, TFEU)
Luxembourg: Publications Office of the European Union, 2017
| 978-92-872-7751-0 | 1977-5679 | 10.2865/36234 | QJ-AB-17-010-EN-N | |
| HTML | 978-92-872-7788-6 | 1977-5679 | 10.2865/958566 | QJ-AB-17-010-EN-Q |
© European Union, 2017
Reproduction is authorised provided the source is acknowledged.
HOW TO OBTAIN EU PUBLICATIONS
Free publications:
- one copy:
- via EU Bookshop (http://bookshop.europa.eu);
- more than one copy or posters/maps:
- from the European Union’s representations (http://ec.europa.eu/represent_en.htm);
- from the delegations in non-EU countries (http://eeas.europa.eu/delegations/index_en.htm);
- by contacting the Europe Direct service (http://europa.eu/europedirect/index_en.htm) or
- calling 00 800 6 7 8 9 10 11 (freephone number from anywhere in the EU) (*).
Priced publications:
- via EU Bookshop (http://bookshop.europa.eu).