
Interreg cooperation: The potential of the European Union’s cross-border regions has not yet been fully unlocked
About the report:Cross-border cooperation aims to tackle common challenges identified jointly by the Member States in the border regions, and to exploit the untapped growth potential. Many such regions generally perform less well economically than other regions within a Member State.
We found that the cooperation programmes we examined had clear strategies for addressing the challenges facing the cross-border regions they covered. However, weaknesses in implementation and insufficiencies in monitoring information limited the potential of programmes to unlock the potential of these regions.
We address a number of recommendations to programme authorities and the Commission to better focus the cooperation programmes, and to prioritise and support projects based on merit. Also, to define indicators that capture the cross-border effect of the projects.
ECA special report pursuant to Article 287(4), second subparagraph, TFEU.
 |
Executive summary
ICross‑border cooperation is one of the two goals of Cohesion policy. It aims to tackle common challenges identified jointly by the Member States in the border regions, and to exploit their untapped growth potential. Many such regions generally perform less well economically than other regions within a Member State.
IIInterreg programmes address cross‑border challenges. The 2014-2020 programme period was its fifth and had a budget of €10.1 billion. A significant part of this concerned internal borders with an allocation of €6.3 billion, financing some 24 000 projects through 53 cooperation programmes. This covered 59 % of the EU’s land area and 48 % of its population.
IIIThrough this audit, we assessed whether the Commission and the Member States had addressed the challenges of the cross‑border regions in the internal borders cooperation programmes funded through Interreg effectively. The publication of this report will be useful in the implementation of the 2021-2027 period. It can also inform the co-legislators’ ongoing discussions about a potential mechanism to tackle legal and administrative obstacles in cross‑border regions.
IVWe found that all but one of the cooperation programmes we examined had analysed the needs of the regions concerned. However, the financial resources allocated to these programmes meant that cross‑border challenges could only be partially addressed. The scarcity of resources requires funding to be directed where it is likely to add most value.
VWith a few exceptions, for the programmes we examined, there were clear links between objectives proposed, inputs and activities planned and the intended results and impact. Cooperation programmes differ from mainstream EU programmes in the requirement for projects to have a cross‑border identity and the participation of multiple, trans-national partners. However, the frequent absence of a clear demarcation between cooperation and mainstream programmes meant that cooperation programmes could finance the same kind of operations as the mainstream programmes.
VIIn addition, we identified several weaknesses in the implementation of the programmes and their monitoring:
- for half of the projects we examined, cooperation among partners was limited to presenting a common project proposal to secure financing for interventions. Those projects lacked a common identity as a cross‑border project;
- the project selection procedures did not always lead to the best projects being selected;
- the indicators used did not generally capture the cross‑border effect, hampering the monitoring of programme implementation in comparison to its objectives; and
- statistical data limitations affect the evaluation of the co-funded projects.
Programme authorities made efforts to limit the impact of the COVID‑19 crisis on projects by extending their deadline for completion. Authorities also made use of the flexibility and simplification measures offered by the EU to mitigate the COVID‑19 effect, especially in relation to the possibility to submit key documents later.
VIIIFinally, the delay in adopting the 2021-2027 legal basis, together with the need to close work for the 2014-2020 programme period, prevented the smooth start of the new programme period at Member State level.
IXAs a result of our audit, we recommend:
- to focus the cooperation programmes better so that the projects complement those of the mainstream programmes;
- to prioritise and award support to projects by ranking them based on merit; and
- to use indicators that aim to capture the cross‑border effect.
Introduction
Challenges for EU cross‑border regions
01Under the Treaty on the Functioning of the European Union, the EU aims to reduce disparities in wealth and development between its regions, with specific reference to, among others things, cross‑border regions1. In this context, it supports European Territorial Cooperation (ETC) programmes, known as ‘Interreg’ programmes, through its cohesion policy by providing funding from the European Regional Development Fund (ERDF). For 30 years, Interreg has been supporting joint actions between Member States or between Member States and countries outside the EU.
02Interreg’s overarching aim is to participate in the support of a harmonious development of the EU territory2, with a view to leveraging cooperation, generating opportunities for development while fostering solidarity between citizens of different nations through confronting challenges together. Alongside ‘Investment in Growth and Jobs’, Interreg’s objective is one of the two goals of the Cohesion policy, which can ‘support the sharing of facilities and human resources, and all types of infrastructure across borders in all regions’3.
03Cross‑border cooperation aims to tackle common challenges identified jointly in the border regions, and to exploit the untapped growth potential. Among the most important challenges are: ‘poor accessibility, especially in relation to information and communication technologies connectivity and transport infrastructure, declining local industries, inappropriate business environment, lack of networks among local and regional administrations, low levels of research and innovation, environmental pollution, risk prevention, and negative attitudes towards neighbouring country citizens’4.
04Figure 1 summarises the most important elements related to the challenges of the EU cross‑border regions as well as their estimated impact. If 20 % of the existing obstacles in cross‑border cooperation were removed, these regions would gain 2 % in GDP, and over 1 million additional jobs5.
Figure 1
The challenges for EU cross‑border regions and their estimated impact

Source: ECA, using data from several studies commissioned by the Commission6.
Interreg A: the biggest strand of Interreg
05The period 2014-2020 was the fifth programme period in which Interreg has been in operation. Its budget in this period was €10.1 billion, some 2.75 % of the total cohesion policy budget7. In this period, Interreg comprised three strands of cooperation8 (see Box 1).
Box 1
The three strands of cooperation for Interreg V 2014-2020
Cross‑border cooperation (Interreg V-A): Programmes between adjacent regions (see Annex I for a list of the internal border programmes). Many programmes are bilateral, but some consist of up to five participating Member States. Operations selected should involve beneficiaries from at least two participating countries, at least one of which must be from a Member State9. Eligible zones are at the NUTS 3 level in terms of population10, and may also cover NUTS 3 regions in Norway, Switzerland, Liechtenstein, Andorra, Monaco and San Marino11.
Transnational cooperation (Interreg V-B): Programmes that cover larger areas of co-operation (see Annex II), and focus on transnational issues such as flood management, transport and communication corridors, international business, research links and urban development. Eligible zones are at the NUTS 2 level regions.
Interregional cooperation (Interreg V-C): Four exchange programmes between all Member States: on spatial planning (ESPON), integrated urban development (URBACT), capitalisation of cohesion policy activities (Interreg Europe) and technical support to all Interreg programmes (INTERACT).
Figure 2 presents the evolution of Interreg from 1989 to 2020 in terms of funding and Member States involved, with more detail for the 2014-2020 period. Interreg V‑A, with 88 cooperation programmes and a budget of almost €7.4 billion, is the biggest strand, representing 73 % of the total Interreg budget. The main element of Interreg V‑A is cross‑border cooperation for internal borders, excluding outermost regions, with 53 cooperation programmes and a budget of €6.3 billion.
Figure 2
The evolution of Interreg from 1989 to 2020 and the budget for the 2014-2020 period

Source: ECA.
For the period 2021-2027, the total Interreg budget has decreased to €8 billion, following a reduction in both the total cohesion policy budget and the share allocated to Interreg12, the latter from 2.75 % to 2.4 %. For this period, there will be an additional, fourth, strand dedicated to outermost regions13. Interreg VI-A, cross‑border cooperation, will continue to represent the biggest part of Interreg funding, with €5.8 billion for the period14.
08The internal border regions eligible for Interreg A co-financing are the NUTS 3 regions of the EU’s internal and certain external land borders15; and the regions along maritime borders separated by a maximum of 150 kilometers16. Member States have a saying on the Commission’s decision on eligible regions17. For all regions, Interreg support is additional to the mainstream, national or regional, ERDF programmes.
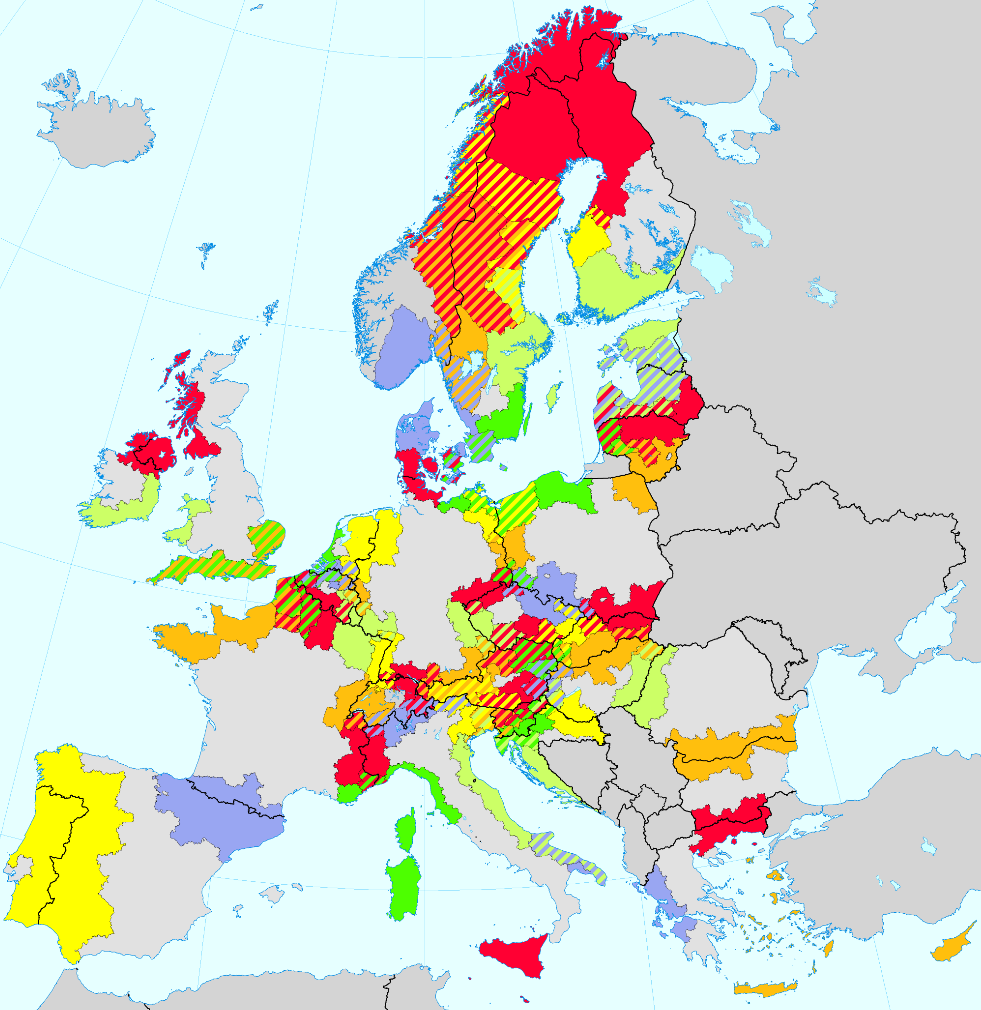
09Figure 3 shows the gradual increase in Interreg A eligible areas. This is mainly because of the enlargement of the EU, and the possibility of the Member States since the 2007-2013 period to allocate part of their Interreg budget to regions outside those covered by the cooperation programmes, initially adjacent regions18 and later all regions19. For the 2014-2020 period, the area for Interreg V‑A covers 66 % of the EU territory and 51 % of the population. For internal borders regions alone, the equivalent figures are 59 % and 48 % respectively.
10According to the Commission, Interreg V‑A regions host almost 2 million cross‑border commuters, of which 1.3 million cross the border to work and the rest to study. For example, 450 000 people living in France work in a neighbouring country; the equivalent figures for Germany and Poland are 270 000 and 140 000 respectively. Many border regions generally perform less well economically than other regions within a Member State. Access to public services such as hospitals and universities and navigation between different legal and administrative systems is often complex and costly20.
Figure 3
The evolution of Interreg A for both internal and external border regions from 1989 to 2020

Source: European Commission, DG REGIO.
Governance of Interreg and areas of funding for Interreg V‑A for internal borders 2014-2020
11Similar to mainstream ERDF programmes, cooperation programmes are implemented under shared management. In this context, the role of the Commission lies in approving the programmes prepared by the Member States and facilitating their implementation, and in the monitoring and evaluation of programmes.
12For each cooperation programme, a managing, a certifying and an audit authority are designated. Specifically for Interreg, a joint secretariat21 is established to act as information centre, assist candidates in applying and assess project applications; together with the managing authority, the joint secretariat constitute the main programme authorities of the cooperation programmes. Ultimately, the monitoring committee of the programme selects the operations to be co-financed.
13The programming process for the cooperation programmes follows closely the arrangements in place for the mainstream programmes. The legislation includes detailed requirements for programme content. It aims to facilitate a consistent intervention logic, i.e. clear links between objectives proposed, inputs and activities planned, and the intended results and impact. The ultimate goal is the effective and efficient implementation of the funds22:
- programming should be around 11 defined thematic objectives23, and at least 80 % of the funds should be concentrated on a maximum of four thematic objectives24;
- a priority axis should correspond, preferably, to one thematic objective; investment priorities and specific objectives should be defined within each priority axis25; and
- a justification for the choice of thematic objectives, investment priorities and financial allocations has to be provided, based on an analysis of regional and national needs26.
Each spring, managing authorities submit annual implementation reports to the Commission for each cooperation programme27. These reports include data on the progress of the common output indicators28, on the programmes’ specific output and result indicators, and on milestones, as well as financial data.
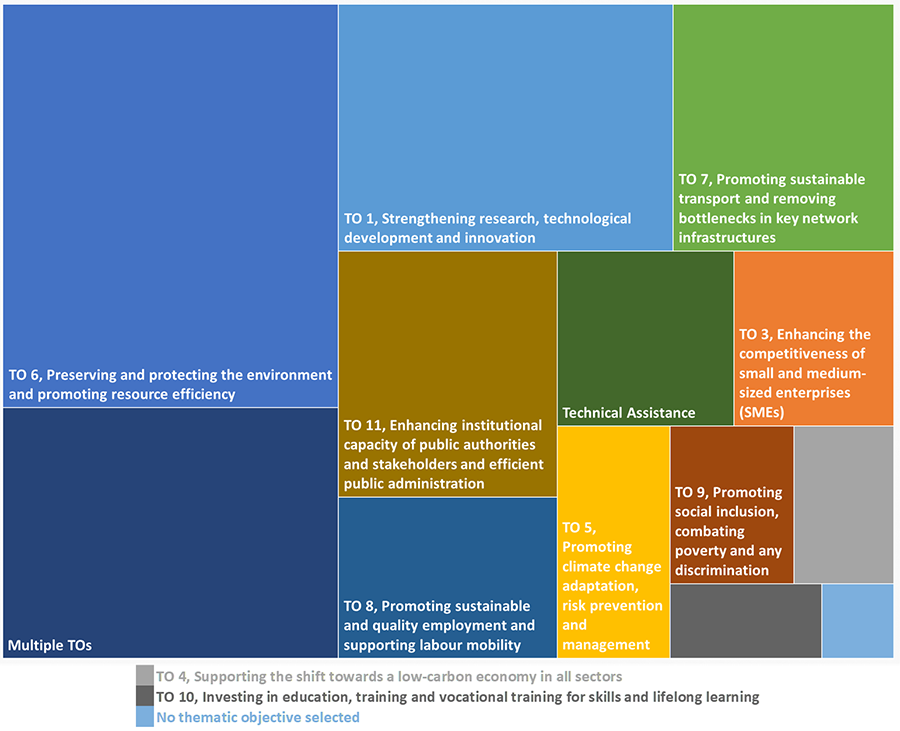
15Figure 4 and Annex III illustrate the spread of thematic objectives targeted by 2014-2020 funding for Interreg V‑A for internal borders. The objectives related to ‘Preserving and protecting the environment and promoting resource efficiency’, and ‘Strengthening research, technological development and innovation’, had received the most funding by the end of 2020.
Figure 4
Thematic Objectives (TO) of Interreg V‑A for internal borders
Source: ESI funds open data platform, allocations by the end of 2020.
As presented in Annex IV, the types of projects that received most funding, excluding technical assistance, related to culture and heritage, adaptation to climate change, institutional capacity, technology transfer to SMEs, improvement of roads, biodiversity and nature protection, tourism in natural areas, healthcare and social services, and research and innovation in public centres.
17As of end December 2020, programme authorities of the cooperation programmes had committed 102 % of the available funding for 2014-2020, whereas the rate for mainstream ERDF supported programmes was 110 %, and had selected some 24 000 projects to co-finance. Programme authorities may commit more than the allocated budget of the programme to ensure that all available funds are used at the end of the programme period.
Preparing for 2021-2027 period
18During the 2007-2013 programme period, Interreg provided funding of €5.6 billion. According to the ex post evaluation29, projects yielded outputs and results that were in line with the specific Interreg objectives and were oriented towards the main priorities of the Lisbon Strategy.
19The main weaknesses noted by the evaluation were that:
- the programmes remained very broad and aimed primarily at developing cooperation and linkages as their ultimate goal rather than as a means of leveraging a wider economic integration;
- most programmes had adopted a ‘bottom-up’ approach when deciding which projects to support. This made it difficult to pursue a coherent strategy to promote the development and socio-economic and territorial integration of the regions concerned, even though most individual projects made a contribution;
- there was very limited coordination between Interreg and the mainstream programmes.
For the preparation of the 2014-2020 partnership agreements and programmes, the Commission developed position papers for each Member State, setting out the most relevant priorities for European Structural and Investment (ESI) funds with a very short section on territorial cooperation.
21For the 2021-2027 period, the Commission presented border orientation papers, designed to contribute to the preparation of Member States’ cooperation programmes. These are detailed papers, specific to cross‑border regions.
22Finally, for the 2021-2027 period, the legislation30 specifies that:
- for internal land borders, programme authorities should allocate maximum 60 % of funding to four of the seven policy objectives (five from the CPR and two from the ETC Regulation), of which two should be: a ‘greener, low carbon Europe’ and ‘a more social Europe’;
- for maritime borders, this 60 % is allocated to three of the policy objectives, of which ‘greener, low carbon Europe’ is compulsory; and
- up to 20 % and 5 % respectively may be allocated to the Interreg specific objectives ‘a better cooperation governance’ and ‘a safer and more secure Europe’.
COVID‑19 measures for ESI funds
23The COVID‑19 pandemic hit Member States’ cross‑border regions significantly, putting the socio-economic structures around and within the EU borders under pressure. The measures taken in relation to providing flexibility for the use of the ESI funds to mitigate the effects of the pandemic through the Coronavirus Response Investment Initiative31 (CRII) and the Coronavirus Response Investment Initiative Plus32 (CRII+) initiatives also apply to the cooperation programmes.
24Figure 5 shows the most important of these measures, all of which require the programmes to be amended. All but one, the ability to transfer resources between categories of regions for the year 2020, are relevant to the cooperation programmes. Programme authorities may use more than one of these measures.
Figure 5
Most significant COVID‑19 measures for ESI funds

Source: ECA, based on Article 2 of the CRII+ and Article 2 of the CRII Regulations.
Audit scope and approach
25The focus of our audit was upon whether the Commission and the Member States had addressed the challenges of cross‑border regions in the Interreg V‑A internal border cooperation programmes effectively (see Annex I). To do this we examined whether:
- the programme authorities analysed and prioritised cross‑border challenges in terms of importance in order to concentrate the cooperation programmes where they would have most impact, given the scarcity of the resources available;
- the cooperation programmes were designed with a coherent intervention logic, and in synergy with the mainstream programmes of the adjacent regions, including an evaluation system that was able to measure the cross‑border effect; and
- the Commission’s guidance was helpful for the cross‑border regions to identify their challenges, providing input and assistance, especially in terms of mitigating the effects of the COVID‑19 crisis, and for the smooth start of the new 2021-2027 programme period.
Our findings and conclusions relate to Interreg V‑A for internal borders cooperation programmes in the 2014-2020 programme period, and we expect that our recommendations will be useful in the preparation and implementation of the 2021-2027 period. Our report can also inform the co-legislators’ ongoing discussions about a potential mechanism to tackle legal and administrative obstacles in cross‑border regions33.
27At EU level, we examined the work of the Commission directorate-general for Regional and Urban Policy (DG REGIO).
28Our approach resulted in a very high coverage of cooperation programmes. At Member States’ level, we examined 23 cooperation programmes (listed in Annex V) in which all 28 Member States were involved at least once. These 23 programmes represent 43 % of the EU funding for Interreg V‑A for internal borders, and 27 % of the whole budget for Interreg 2014-2020 period.
29For the 23 cooperation programmes, we conducted ten simple desk reviews, ten extended desk reviews, and three visits on the spot. Details, including the difference between these types of reviews, are in Annex V.
30In addition, for all 23 cooperation programmes, we selected two mainstream programmes, also listed in Annex V, from the adjacent regions in order to compare their focus and assess the level of synergy in terms of addressing cross‑border challenges. The main criteria for selection of the two programmes were the population size, the level of financial support, the size of the area covered, and, most importantly, the extent of shared investment priorities. In total, we examined 39 mainstream programmes as in seven cases the same mainstream programme was used for more than once.
31For the cooperation programmes we examined on the spot, we visited 12 projects that received EU support. The basis for selection of those projects was materiality and diversity in types of co-financed actions. We also examined another four projects through desk review for the cooperation programme of Romania – Bulgaria. Initially, we intended to visit this programme on the spot, but COVID‑19 travel restrictions ruled this out. As a result, we were unable physically to inspect the outcome of the projects ourselves.
32The 16 projects we examined implemented actions in the following areas of support: cultural heritage, tourism, SMEs and entrepreneurship, labour market and employment, risk management and cooperation between emergency services, education and training, institutional cooperation, health and social inclusion and multimodal transport.
33Finally, for all 53 internal border cooperation programmes, we examined the extent to which programme authorities made use of the flexibility and simplification possibilities offered by the CRII and CRII+ initiatives. For the three cooperation programmes we examined on the spot and the programme of Romania – Bulgaria that we intended to visit, we assessed the implications of COVID‑19 crisis in the implementation of projects.
Observations
Comprehensive analysis underpinned the cross‑border programmes, but not all challenges could be addressed
34We reviewed the programme documents for 23 cooperation programmes in order to assess whether the strategic planning for the 2014-2020 programme period was based on an analysis of the cross‑border challenges faced by these regions. We also examined how feasible it was for these challenges to be addressed by the cooperation programmes, given the scarcity of financial resources.
All 23 cooperation programmes examined included an analysis of the challenges of the cross‑border regions
35A cooperation programme should be based on an analysis of the needs within the programme area as a whole34. For this, it is necessary to adapt the content requirements of the programmes to the cross‑border regions’ specific needs35.
36All cooperation programmes we examined presented the needs of the regions based on an analysis of either the strengths, weaknesses, opportunities and threats (SWOT analysis), or of the social and economic characteristics of the cross‑border regions (socioeconomic analysis). However, in the case of the Sweden – Finland - Norway cooperation programme, the SWOT analysis was not sufficiently developed to support strategic decisions: it did not fully analyse the threats, mixed strengths with opportunities, listed some challenges without any background information, and used outdated data of more than a decade old.
37Figure 6 groups in seven categories the most important challenges highlighted by the cooperation programmes. Most of these challenges are faced equally by the mainstream programmes which cover the same geographical areas. The weaknesses in administrative cooperation and language barriers, however, are specifically cross‑border related.
Figure 6
The most important challenges facing cross‑border regions
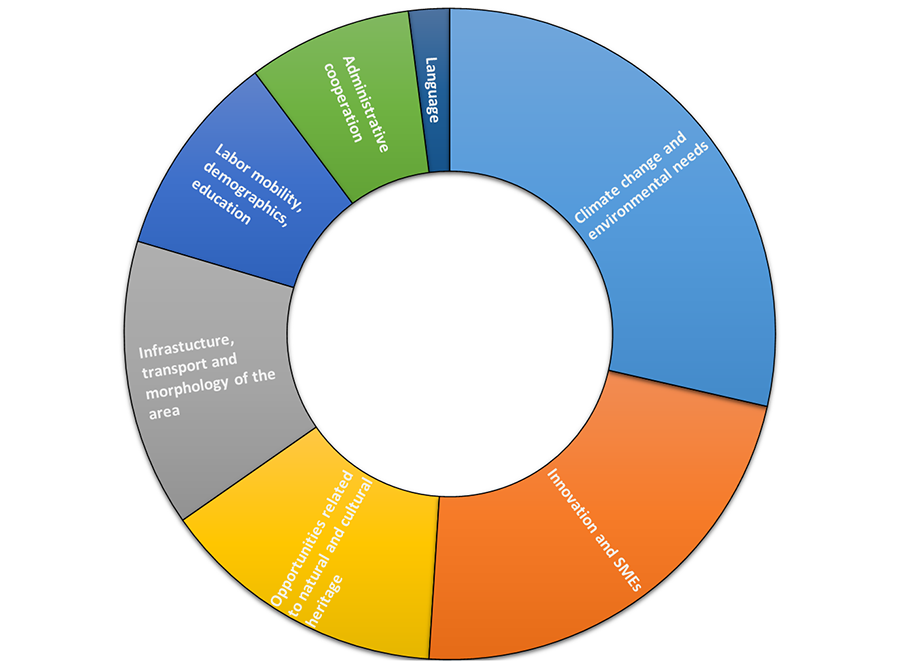
Source: ECA, based on the 23 cooperation programmes listed in Annex V.
Challenges cannot be addressed by the cooperation programmes alone, thus need prioritisation
38In practice, the financial resources allocated to these programmes meant that cross‑border challenges could only be partially addressed. The average budget for each of the 53 cooperation programmes for internal borders amounted to €162 million, ranging from €19 million for Slovenia – Hungary to €485 million for Spain – Portugal (POCTEP) (see Annex I). However, tackling many cross‑border challenges requires significant financing. For example, big rail or road infrastructure projects that facilitate transport, commerce and citizens’ movement usually involve several billions of euros.
39In contrast, mainstream programmes are generally endowed with much bigger budgets. In the 39 mainstream programmes we examined, the budget of the regional programmes ranged from €231 million to €7 billion, with an average of €2 billion; the average budget for the national programmes was more than twice as high, ranging from €700 million to almost €9 billion (see Annex V).
40We identified cases where programme authorities allocated a small sum to a priority axis or an investment priority with the result that the funding could have only a limited effect on the cross‑border region. For example, the programme authorities of the cooperation programme Estonia – Latvia allocated less than €1 million to the priority axis of labour market integration and improvement of the conditions for accessing jobs across the border. It is not clear whether such relatively small amounts of support can have any significant effect.
41Figure 7 illustrates the difference in budgetary allocation between the 23 cooperation programmes and the mainstream programmes examined of the adjacent regions.
Figure 7
Budget comparison of cooperation programmes with the mainstream programmes examined of the adjacent regions

Source: ECA, based on the examined cooperation and mainstream programmes listed in Annex V.
The scarcity of financial resources means that funding needs to be directed where it is likely to add most value. However, we found that most of the programme authorities did not prioritise the identified needs, and thus risked not selecting the investment priorities likely to have most impact.
43Our examination showed that the resolution of many important challenges facing cross‑border regions could not be settled by the programme authorities, but required decisions at national level and subsequent incorporation in national legislation. For example, cooperation between national authorities on healthcare or security issues requires bilateral or trilateral agreements between the Member States, as illustrated by the example in Box 2.
Box 2
The healthcare challenges of the Greater Region
The Greater Region cooperation programme comprises five regions from three EU Member States (France, Belgium and Germany) together with the country of Luxembourg. It is a densely populated area of 65 401 km2 with 11.4 million inhabitants.
The SWOT analysis for the preparation of the 2014-2020 programme highlighted as one of the region’s challenges the ‘unwillingness and regulatory difficulties to let information flow, particularly in the field of health’. The differences between the four healthcare systems hinder access to cross‑border healthcare services, and this can be fatal in an emergency when a nearby hospital across the border can provide treatment more quickly. In addition, the lack of a coordinated cross‑border health insurance system discourages patients to look for treatment across the border in case they cannot afford paying the cost of care in advance before their insurance reimburses them.
Programme authorities selected an investment priority relating to health and social infrastructure for funding36. They set as a result indicator target the achievement of six cross‑border healthcare access agreements by the end of 2023. By end 2019, 14 such agreements had been signed.
A coherent strategy for addressing the challenges often did not lead to focused implementation
44We assessed the most important strategic elements of the cooperation programmes and how these were translated into action through calls for proposals and in the selection of projects.
In almost all cases the strategic programme documents reflected legal requirements and were coherent with needs analyses
45The CPR sets out the need for a strong ‘intervention logic’37, i.e. a clear link between the programme’s objectives and its expected results. As several EU funds are providing support in the same geographical area effective coordination between these funds, and national funding instruments is important38. For Interreg, beneficiaries from at least two participating countries39 should be involved in operations.
46We therefore examined:
- the strength of the intervention logic leading from the challenges identified through to other elements of project selection process, including the selection of priority axis, thematic and specific objectives, investment priorities, outputs and results as well as targets therefore;
- whether programme authorities set out arrangements for coordinating funding with other sources; and
- the importance attributed to the cross‑border element in selecting projects.
With a few exceptions sound intervention logic underpinned the programmes we examined
47In almost all cases we confirmed that there was a sound intervention logic between the analysis of the challenges and the programme authorities’ selection of priority axes, thematic and specific objectives and the investment priorities; this logic extended to the calls for proposals. In the one case where the SWOT analysis was not sufficiently developed to support strategic decisions (see paragraph 36), this had an impact on the coherence of the intervention logic of the programme.
48Programme authorities also complied with the requirement to concentrate mainly on up to four thematic objectives. In some cases authorities decided to focus programmes even further, on specific business segments. An example is the South Baltic programme, comprising regions from Poland, Denmark, Germany, Lithuania and Sweden, which aims to increase the ‘blue’ (sea) and ‘green’ (environmental) growth potential of the South Baltic area, even if several other challenges were highlighted in this region.
49There were, however, few cooperation programmes that supported the funding of projects in areas not previously identified in the SWOT or the socioeconomic analysis. For example, for the Slovakia – Czechia programme, the authorities decided to invest in operations designed to increase the quality of cross‑border cooperation between local and regional governments. While this is one of the major issues facing cross-border regions in general, the lack of institutional capacity had not been included in the socio-economic analysis for this programme.
50In the case of the Central Baltic cooperation programme, the programme authority decided to focus on opportunities available to cross‑border regions rather than the challenges facing them. The programme authorities invested in operations intended to maintain or increase jobs, support SMEs, and enhance the touristic attractiveness of the region. In this case, the intervention logic of the cooperation programme was clear and complied with the other legal requirements. This means, however, that the challenges of the cross‑border regions were not addressed, as was confirmed by our examination in one of the four projects of this cooperation programme.
Programmes included information on coordination with other sources of funding and a procedure for evaluation of the cross‑border character was in place
51We found that in all cases the cooperation programmes presented information on mechanisms for coordinating funding with other sources of EU or national funding, such as the ESI funds. For example, they contained detailed information on the participation of key personnel from different authorities in meetings where synergies among the funds were explored, and the procedure for preventing two different sources funding the same operation.
52Finally, we found that in all cases selection procedures ensured the cross‑border identity of the project, including the intentions of partners from both sides of the border to be actively involved.
In practice, we identified several weaknesses in the implementation of the strategy and its monitoring
53We assessed the implementation of programmes’ strategies through calls for proposals, the selection of projects and how this is monitored and coordinated with other funding mechanisms in the same geographical areas. We identified several weaknesses in their implementation and monitoring related to the demarcation between cooperation and mainstream programmes, the cross‑border character of the project, the procedure for selecting projects, the indicators used and the quality and availability of statistical data.
Frequent absence of a clear demarcation between cooperation and mainstream programmes
54The 66 % of the total land area of EU is eligible for Interreg internal and external borders funding, and for 17 Member States over 80 % of their territory is eligible (Box 3 and Figure 8).
Box 3
Increase in eligible Interreg regions for internal and external borders
For the programme period 2014-2020, the eligible land area of the Member States for Interreg funding for both internal and external cooperation programmes has increased significantly so that currently:
- for 17 Member States, over 80 % of the land area is eligible for cross‑border funding (Belgium, Czechia, Denmark, Estonia, Croatia, Cyprus, Latvia, Lithuania, Luxembourg, Hungary, Malta, Austria, Portugal, Slovenia, Slovakia, Finland and Sweden);
- for three Member States, over 60 % of the land is eligible for cross‑border funding (Bulgaria, the Netherlands and Poland); and
- for the remaining seven Member States, over 40 % of the land is eligible for cross‑border funding (Germany, Ireland, Greece, Spain, France, Italy and Romania).
Figure 8
Eligible land area of the Member States for funding for internal and external borders cooperation programmes

Source: ECA, based on data from Eurostat.
Mainstream and cooperation programmes co-finance EU projects in same geographical areas (see paragraph 08). We compared the focus of each of the 23 cooperation programmes in our sample with that of two mainstream programmes from the adjacent regions (see paragraph 30). We focused on the investment priorities that the programmes had in common which is possible according to the relevant regulations. For these common priorities, we compared the areas of support and types of operations that the programmes were intended to co-finance, and assessed whether there was a clear demarcation between the programmes and whether there was evidence of complementarity.
56We found that in 14 cases there was no clear demarcation between the areas of support and types of operations to be co-financed. This means that the mainstream programmes could finance the same kind of operations as the cooperation programmes, the difference being that projects funded by the latter required a cross‑border identity and the participation of two partners from both sides of the border. We found these cases mainly in areas of support like the environment, culture, tourism, competitiveness and job creation.
57The South Baltic provides a good example of clearly differentiated types of projects: it financed the construction of a cycle path through one of the mainstream programmes, and activity zones along this path through the cooperation programme. This sort of approach requires good cooperation among the programme authorities during the programming stage.
58To maximise the added value where different support programmes fund the same investment priority, it is important to coordinate the areas of support and to differentiate the types of projects co-financed. During the 2014-2020 period, the legal requirement for ETC was to focus 80 % of funding on a maximum of four of the eleven thematic objectives (see paragraphs 13). However, for the 2021-2027 period, there is less thematic concentration as, for example, programme authorities of the internal land borders cooperation programmes can allocate funds to all seven (the five general and the two Interreg-specific) policy objectives (see paragraph 22).
59The overlap of Interreg and mainstream ERDF eligible areas (see paragraph 54), together with the reduction in Interreg budget (see paragraph 07), and the broadening of the programmes’ focus for the 2021-2027 period (see paragraph 22), make the need for a clear demarcation between the mainstream and the cooperation programmes more pressing. A clearer demarcation has the potential to increase synergies, reduce the likelihood of double funding, and increase the added value of the projects. Programmes’ broadness and the limited coordination between the cooperation and the mainstream programmes were also highlighted in the ex post evaluation of the 2007-2013 period (see paragraph 19).
The cross‑border character of some projects was questionable
60Cooperation projects should involve beneficiaries from at least two participating countries, even though the legislation allows a project to be implemented in a single Member State if ‘its cross‑border or transnational impacts and benefits are identified’40.
61For the 16 projects in our sample, we assessed:
- whether they addressed at least one of the cross‑border challenges;
- whether there were projects implemented in a single Member State;
- whether the benefits of each partner contribution and those of the collective cross‑border project contribution were visible in all participating Member States; and
- if those cross‑border benefits justified the funding of the operation through the cooperation programme.
We confirmed that all but one projects (see paragraph 50) addressed at least one of the cross‑border challenges. All projects were implemented in at least two participating Member States and their benefits were equally visible. However, for eight projects cooperation among partners was limited to presenting a common project proposal to secure financing for interventions. These projects lacked a common identity as a cross‑border project. We found that this weakness was present in all four projects we examined in the area of tourism, one of the main areas of support for Interreg 2014-2020 (see paragraph 17).
63Box 4 provides examples of projects with a weak and strong cross‑border character from the same programme.
Box 4
Making the distinction between projects with questionable and clear cross‑border character of the Czechia – Poland programme
Revitalising the pavilions of a zoo and the facilities of a touristic attraction: two touristic attractions, one in each country around 75 km apart, applied for funding in order to modernize their facilities, and to design a joint marketing campaign. However, the websites of each did not advertise the other’s partner establishment, and the common ticketing system was not implemented, thus, there was no cross‑border character underpinning the project.
Cross‑border cooperation of police units: all eight police units in the two regions of the cooperation programme applied for funding to increase coordination in combating drug-related crime. Project activities included: the purchase of equipment for revealing drugs (such as spectrometers), common police patrols, joint trainings for officers, including language training, and information campaigns to teachers and parents on drug substances and equipment used. This project brought the eight police units in closer cooperation, and had a genuine cross‑border character.
Several weaknesses in project selection meant that the best projects were not always selected
64Calls for proposals and project selection are key phases in the programme implementation process, especially because of the amount of resources available to cooperation programmes (see paragraph 38), and since Interreg’s contracting rate has not been of major concern in recent years (see paragraph 17). This reinforces the need to select projects through merit to reach the objectives of the cooperation programme and to address the most pressing needs of the cross‑border regions.
65For the 10 cooperation programmes we examined through an extended desk review and the three programmes we visited on the spot, we therefore examined how the programme authorities:
- communicated to the public the areas and types of projects which could be supported by the cooperation programmes, to attract project proposals in line with the aims of the programmes;
- assessed the project proposals; and
- selected the projects that best addressed the region’s challenges.
For these cooperation programmes, the programming documents followed the legal requirements41 and included basic information about the programme: description of type of actions for support under each investment priority, their expected contribution to specific objectives, the guiding principles for the selection of operations, the identification of the main target groups, types of beneficiaries, etc. However, we identified weaknesses in all three phases of project selection.
67For five of the 13 cooperation programmes, potential projects were identified through a ‘bottom-up’ approach, under which candidate beneficiaries submitted project applications with limited direction by programme authorities on how projects should address directly the needs of the region (see Box 5). This issue, but to a greater extend, was also highlighted in the ex post evaluation of the 2007-2013 period (see paragraph 19).
Box 5
Two options for attracting projects
For selecting projects, programme authorities predominantly invite applicants to submit applications for funding through open calls for project proposals. These calls are to address the priority axes, thematic objectives, specific objectives, and investment priorities of the programme. The goal of every selection process should be to choose those projects that best address the challenges addressed by the programme.
An idea for a project can come either:
‘bottom-up’ (broad scope calls), i.e. from the potential beneficiary itself, which then tries to tailor the project proposal to the requirements of the call; or
‘top-down’ (focused scope calls), where the programme authorities provided direction on the expected focus of the potential projects.
For ten of the programmes, authorities assessed project applications using a points system in which a minimum threshold had to be achieved for the project to stand a chance of being selected. This not only contributes to making the selection process transparent, but also makes the subsequent work of the monitoring committee – whose role is to decide on which projects to co-finance – easier. For the other three programmes, and in the absence of a point system, programme authorities based the selection on a qualitative assessment, which does not allow a clear prioritisation of projects.
69For three programmes, the programme authorities provided the monitoring committee with a list of projects ranked by merit. For the other ten cooperation programmes, however, even where a points system had been used, programme authorities did not rank projects when sending them to the monitoring committee. Box 6 presents a good and weak practice example for selecting projects.
Box 6
Selection procedure for Interreg: Good and weak practice examples
The programme authorities of the Czechia – Poland cooperation programme applied the following selection procedure, designed to select projects that best address the challenges identified in the cooperation programme in a transparent manner:
- participating regions develop a list of experts in each area of support covered by the programme;
- each project is assessed by four external experts, two from each Member State; two are from the regions where the project partners are based and two from other regions covered by the programme;
- the cross‑border effect is assessed by the two external experts from the regions of the project partners and one staff member from the joint secretariat;
- the cross‑border cooperation is evaluated by two staff members of the joint secretariat, one from each Member State;
- to be included in the list of potential projects for co-financing, projects must achieve an overall minimum threshold of 70 % of the total score, including a minimum of 70 % in some specific areas; and
- the joint secretariat ranks the projects in terms of points gained and submits them to the monitoring committee for selection.
In contrast, the programme authorities of the United Kingdom (Wales) – Ireland programme defined a vague selection procedure, which was carried out on a continuous basis, without competitive calls. The programme authorities did not score the project applications, but assessed their ‘adequacy’ against a few qualitative criteria. A project proposal was rejected as ‘inadequate’ when ‘The applicant has provided incomplete or insufficient responses against many of the listed evidence requirements thereby demonstrating an unacceptable level of risk’. As a result, under this system, it was not possible to rank the projects based on their merit and priority. There was no assurance that authorities would be able to select transparently the best projects.
Indicators did not generally capture the cross‑border effect and limited statistical regional data were available, hampering monitoring and evaluation
70In order to strengthen the result orientation of programmes, for each priority axis authorities were required to define the expected results for the specific objectives and the output and result indicators, as well as a baseline and a target value for the whole programme period42. The ETC Regulation includes a list of common output indicators that programme authorities may choose to use43. Targets may be expressed either in quantitative or in qualitative terms, the latter only for the result indicators44. Programme authorities need to collect robust statistical data in order to reliably monitor these targets.
71For all 23 cooperation programmes, we examined whether the specific objectives addressing the needs identified in the cross‑border regions were based on SMART criteria i.e. specific, measurable, attainable, relevant and timely.
72In addition, we examined whether the output and result indicators set for each programme were:
- relevant to the specific objectives of the programme;
- capable of measuring the effect of the supported operations; and
- achievable by the end of the programme period. To this end, we also used the conclusions of the last available annual implementation reports.
We found that, in general, the specific objectives of the programmes were based on SMART criteria. They followed the intervention logic of the programme, were linked to the priority axes, thematic objectives and investment priorities selected and bridged the link between the strategy and the supported actions and operations.
74We also found that the common and programme-specific output indicators and programme-specific result indicators were generally measurable, and that in all cases baseline and target values were set. The use of the common output indicators facilitates the aggregation of data for ESI funds.
75Seven of the programmes authorities measured certain result indicators through a qualitative assessment, i.e. a survey, as allowed by the legislation. We found that in three cases, programme authorities surveyed the same beneficiaries and other stakeholders which had received funding from these programme authorities. This may lead to the perception that results are not collected in an objective manner, as beneficiaries might have provided more positive feedback as it would otherwise have been the case, had the arm-length principle been respected.
76In all of the cooperation programmes we examined, except for that of South Baltic, we also found issues related to relevance and achievability of the indicators, both for the common output indicators and the programme-specific output and result indicators.
77In terms of relevance, many of the indicators, either the common output or the programme-specific, could not capture the cross‑border effect of the Interreg operations. Also, we identified cases where the indicators set did not measure the effect of the supported operations on the specific objective, or where the effect could not be attributed directly and exclusively to a project. A common example of the latter is that many programmes used ‘increase of hotel stays in the region’ as a result indicator for a cultural/touristic operation, although the number of hotel stays in a region depends on several socioeconomic factors, in addition to an Interreg project.
78In terms of achievability, we found examples of two extremes: in some cases the targets were not realistic and, most probably, will not be achieved by the end of the programme period, indicating that programme authorities:
- either did not launch enough calls for interest addressing the relevant specific objectives of the programme; or
- did not direct beneficiaries to apply for projects that would address the objectives of the programme (see Box 5); or
- did not assess initially correct the target.
In other cases, targets were not ambitious enough and had already been achieved in the early years of the programme period, indicating that programme authorities contracted more projects than they needed. This shows that the effect of previous calls for project proposals was not taken into account when new calls were launched.
79Regional data are required for relevant and robust indicator figures. For the 23 cooperation programmes in our sample, we found there to be limited data available. We also found a case where the programme authority had no available data to calculate the effect of a specific objective. The Commission confirmed that there were limitations in the availability of cross‑border regional statistics. Differences in data collection methods between Member States, and insufficient cross‑border statistical coordination were the most common issues.
The Commission’s guidance has improved, but delay in adopting the legal framework affected implementation
80We examined the guidance provided by the Commission to programme authorities in terms of defining their cross‑border challenges for both the 2014-2020 and 2021-2027 periods. We also assessed the extent to which COVID‑19 measures were used in the implementation of the 2014-2020 cooperation programmes, and the level of preparation for the 2021-2027 period.
The Commission offered more guidance and support for the 2021-2027 period
81For the 2014-2020 period, the Commission provided guidance to each Member State on what it saw as the priorities for funding, through a 2012 position paper on the ‘Development of the partnership agreement’.
82In almost all cases, the guidance for the 2014-2020 period was limited to a few paragraphs of general content, and headlines on areas of potential spending for the cross‑border regions. They contained very few specific messages on cross‑border cooperation that could have been used to inform the development of programmes.
83The 2021-2027 period is the sixth programme period for Interreg. We examined whether the Commission has translated its accumulated knowledge, built up over previous periods, into concrete actions to guide Member States in programming and implementing their cooperation programmes.
84The Commission took a more active role for the preparation of the 2021-2027 period, and led a series of initiatives to assist Member States in the identification of the cross‑border challenges. These included:
- the cross‑border review initiative, comprising two years of intensive research and dialogue with border stakeholders, and national and regional authorities. The review included studies of the legal and administrative obstacles that prevail at EU Member State borders;
- the creation of the border focal point service within DG REGIO that provides support to Member States in addressing legal and administrative cross‑border issues; and
- the preparation of border orientation papers specific to each border which present Commission’s views on the key challenges, opportunities, scenarios for future cooperation and the need for clear demarcation with the remaining programmes of the regions.
The border orientation papers in particular were a valuable contribution to better targeting cross‑border challenges, they set out key characteristics of the cross‑border regions and outline options and orientations for programming. Even in cases where programme authorities did not fully support their content, they played an important role in preparing the ground and starting the discussion on cross‑border needs.
Cross‑border programme authorities made use of simplification possibilities offered during the COVID‑19 crisis
86Soon after the outbreak of the COVID‑19 pandemic, the Commission proposed measures to ease the legal requirements for the ESI funds, especially for the year 2020 (see paragraphs 23 and 24 and Figure 5).
87We examined the uptake of these measures by the 53 cross‑border cooperation programmes (see paragraph 33). We also examined the implications of the pandemic in terms of implementation for the three cooperation programmes we visited on the spot and the Romania – Bulgaria programme that we had planned to visit on the spot.
88By the end of February 2021, there were 241 COVID‑19 related programme amendments in 186 programmes from 24 Member States, including the Interreg programmes. Of them, 202 were amendments requiring adoption by the Commission. The remaining 39 were simplified amendments adopted by the Member States, or the programme authorities in the case of Interreg, and notified to the Commission. Regarding Interreg programmes, 33 programme authorities made use of COVID‑19 measures requiring a programme amendment. The measure used the most was the possibility to delay the submission of the annual implementation report. The last report was submitted in September instead of May 2020, i.e. with four months delay. According to the Commission, the main reason for mainly using this measure was the high rate of contracting, see paragraph 17. In addition, seven programme authorities made simplified amendments that needed just a notification to the Commission and did not require an amendment to the programme.
89In terms of impact on implementation, the three programme authorities we visited on the spot and the cooperation programme of Romania – Bulgaria that we intended to visit, reported that the crisis hit every project differently, depending on timing and type of activities planned, as illustrated by the example in Box 7. Projects dependent on travel generally needed more substantial amendments or had to take alternative action by substituting, for example, meetings in situ by teleconferences. However, the four programme authorities reported that beneficiaries had to stop or suspend less than 1 % of approved projects.
Box 7
The impact of COVID‑19
The Central Baltic cooperation programme comprises from regions from Finland, Estonia, Latvia and Sweden. According to the managing authority of the programme, at the time of COVID‑19 outbreak:
- projects that were at an early implementation stage, could easily adjust their timing schedule and content of actions;
- half of those in the midst of implementation, have applied either to extend or to amend the implementation of their work plans; and
- the majority of projects at the very end of the process faced difficulties in completing their activities. In most of these cases, the beneficiaries requested an extension of the project’s deadline.
The 2021-2027 period started before the legal framework had been approved
90Finally, we examined the preparation of the 2021‑2027 programme documents for all the cooperation programmes we examined. We followed up the implementation of an ECA recommendation concerning the timely preparation of the cohesion policy legislative proposals by the Commission45, and we compared the length of time taken adopt the legal framework with the previous two programme periods.
91All but two of the 23 programme authorities stated that the discussions for the next programme period only started shortly before the 2020 summer break. According to the programme authorities, the late start in the development of the programme was due to lack of certainty pending the adoption of the legal basis. This delay in adopting the legal basis, together with the need to close work for one programme period at the same time as starting the new one46, prevented the smooth start of the multiannual programme period at Member State level.
92The Commission proposals for the new CPR, ERDF, and ETC Regulations were published in May 2018, well before the start of the programme period and in line with our previous recommendation. However, the negotiations between the European Parliament and Council lasted longer than expected. By the end of April 2021, the cohesion policy legislative package, including the ETC Regulation, was not yet adopted, i.e. 4 months after the start of the 2021-2027 programme period. For comparison, the legal base was adopted a month before the start of the 2014-2020 period, and, for the 2007-2013 period, five months before.
Conclusions and recommendations
93In this audit, we looked at whether the Commission and the Member States had addressed the challenges of the cross-border regions in the internal borders cooperation programmes funded through Interreg effectively. Overall, we found that the cooperation programmes we examined had clear strategies for addressing the challenges facing the cross‑border regions they covered. However, weaknesses in implementation and inefficiencies in monitoring information limited the potential of programmes to unlock the capacity of these regions. Part of the recommendations below are addressed to the programme authorities examined, but, in view of the broad coverage, we consider that they also apply to other programme authorities. The programme authorities have provided us with their reactions to these recommendations, see Annex VI.
94Cooperation programmes cannot address all cross‑border challenges because of their limited budget and of the requirement for some challenges to be dealt with between Member States at national level. We found that programme authorities, even if they had analysed challenges, did not prioritise them in order to focus on those most pressing for the cross‑border area (see paragraphs 36‑43).
95In terms of strategy, the intervention logic of the cooperation programmes was strong, and there was a link between the challenges, priority axes, thematic and specific objectives and calls for project proposals. The programme documents also set out the procedures to be followed for coordinating the cooperation programmes with other funds. The selection procedures as described in the programme documents gave prominence to the cross‑border identity of the projects to co-finance, and reflected the intention of partners from different countries/regions to be actively involved (see paragraphs 47‑50).
96However, we found that in 14 cases of the 23 cooperation programmes in our sample, there was no clear demarcation in the areas of support and the types of operations to be co-financed between the cooperation and the mainstream programmes, leading to a situation where both sources of funding could finance the same kind of operations. There is a risk that the required focus on real needs is weakened by the overlap of the areas eligible for both Interreg and ERDF mainstream funding. The need to increase the added value of the EU interventions is particularly important as the budget for Interreg will shrink for the 2021-2027 period and there is less thematic concentration than in the 2014-2020 period (see paragraphs 56‑59).
97We also found projects with limited evidence of their cross‑border character, as cooperation among partners was limited to presenting a common project proposal to secure financing for interventions (see paragraph 62).
Recommendation 1 – Better focus the cooperation programmes- Programme authorities of the cooperation programmes examined should:
- ensure that the programme documents stipulate that they focus on different types of projects for the investment priorities they support in comparison to the mainstream programmes of the adjacent regions; and
- coordinate the support whenever they intervene in the same areas of support with the mainstream programmes of the adjacent regions.
- The Commission, based on the above two recommendations, should, when adopting the cooperation and the mainstream programmes, require that the projects co-financed are complementary.
Timeframe: by December 2022
98Most programme authorities did not rank the projects in terms of merit to ensure that only the best proposals for funding were considered, a significant omission when funds are scarce. In addition, some cooperation programmes did not have a minimum threshold that a project proposal had to reach to be selected, particularly important in terms of guaranteeing its cross‑border character and contribution to addressing the most pressing challenges of the region (see paragraphs 66‑69).
Recommendation 2 – Prioritise and award support to projects based on merit using scoresIn order that the projects that best address the challenges of the cross‑border regions and the objectives of the cooperation programmes are selected, programme authorities examined should:
- use a system of merit as part of the project appraisal process; and
- only propose projects for funding that have achieved a minimum threshold, including a minimum threshold for the cross‑border character of the project.
Timeframe: by December 2022
99The specific objectives were based on SMART criteria and output and result indicators were generally measurable. However, there were weaknesses in the relevance and achievability of the output and result indicators: some indicators did not reflect the aims of the specific objective that the project addressed; and some did not strike the right balance between being achievable but ambitious. In most cases, programme authorities used indicators, which did not capture the cross‑border effect (see paragraphs 73‑78).
Recommendation 3 – Use indicators that aim to capture the effect of cross‑border projectsThe Commission should, when assessing the cooperation programmes during their approval process:
- work closely with programme authorities to promote the selection of the common output and result indicators that are relevant to the types of actions the programmes will implement and thus capable of measuring the achievements and effects of the cross‑border projects; and
- for those cases where common indicators cannot be used, work with the programme authorities to assess the suitability of the specific output and result indicators in measuring the achievements and effects of the cross-border projects using the available Commission guidance.
Timeframe: by December 2022
100There were several weaknesses in the data we examined underlying the regional statistics that are used for measuring indicators. Data were either not available or not sufficiently coordinated between Member States to capture the cross‑border effect of the supported operations in a reliable way (see paragraph 79).
101The Commission’s guidance to the programme authorities improved over the last two programme periods. The border orientation papers for the 2021-2027 period provided a more targeted analysis, including suggestions, than the 2014-2020 position papers (see paragraphs 82‑85).
102Cooperation programme authorities made use of the measures available under by the CRII and CRII+ initiatives to mitigate the effects of the COVID‑19 outbreak. Very few cross‑border projects have been suspended or cancelled as a result of the pandemic, mainly because a high level of projects had already been contracted through Interreg. However, the effect of the crisis was visible and programme authorities made efforts to support the implementation of the contracted projects (see paragraphs 88‑89).
103For the 2021-2027 period, the Commission made its legislative proposals in good time, but the co-legislators did not adopt them until after the start of the programme period. This delay has seriously affected the preparation of cooperation programmes, and prevented a smooth start for the new programme period (see paragraphs 91‑92).
This Report was adopted by Chamber II, headed by Ms Iliana Ivanova, Member of the Court of Auditors, in Luxembourg on 19 May 2021.
For the Court of Auditors

Klaus-Heiner Lehne
President
Annexes
Annex I – List of Interreg V‑A for internal borders cooperation programmes for the 2014-2020 period
In total, the Commission approved 53 cross‑border cooperation programmes for internal borders for the 2014-2020 period. Figure 9 presents these programmes in a map. Hatched areas are part of two or more programme areas simultaneously.
Figure 9
Interreg V‑A for internal borders: The 53 cooperation programmes
Source: European Commission.
The table below lists the 53 cooperation programmes, along with the total budget, and the EU contribution. In bold are indicated the cooperation programmes that we examined.
| Name | CCI |
Total OP budget (in euros) |
Total EU contribution (in euros) |
|
| 1 | Belgium – Germany – The Netherlands (Euregio Maas-Rijn) | 2014TC16RFCB001 | 140 434 645 | 96 000 250 |
| 2 | Austria – Czech Republic | 2014TC16RFCB002 | 115 076 396 | 97 814 933 |
| 3 | Slovakia – Austria | 2014TC16RFCB003 | 89 285 509 | 75 892 681 |
| 4 | Austria – Germany/Bavaria | 2014TC16RFCB004 | 64 332 186 | 54 478 064 |
| 5 | Spain – Portugal (POCTEP) | 2014TC16RFCB005 | 484 687 353 | 365 769 686 |
| 6 | Spain – France – Andorra (POCTEFA) | 2014TC16RFCB006 | 288 964 102 | 189 341 397 |
| 7 | Hungary – Croatia | 2014TC16RFCB008 | 73 900 028 | 60 824 406 |
| 8 | Germany/Bavaria – Czech Republic | 2014TC16RFCB009 | 121 617 825 | 103 375 149 |
| 9 | Austria – Hungary | 2014TC16RFCB010 | 95 870 327 | 78 847 880 |
| 10 | Germany/Brandenburg – Poland | 2014TC16RFCB011 | 117 826 565 | 100 152 579 |
| 11 | Poland – Slovakia | 2014TC16RFCB012 | 210 114 137 | 178 597 014 |
| 12 | Poland – Denmark – Germany –Lithuania – Sweden (South Baltic) | 2014TC16RFCB013 | 100 614 276 | 82 978 784 |
| 13 | Finland – Estonia – Latvia – Sweden (Central Baltic) | 2014TC16RFCB014 | 170 544 922 | 132 628 689 |
| 14 | Slovakia – Hungary | 2014TC16RFCB015 | 183 304 695 | 155 808 987 |
| 15 | Sweden – Norway | 2014TC16RFCB016 | 94 399 930 | 47 199 965 |
| 16 | Germany/Saxony – Czech Republic | 2014TC16RFCB017 | 189 274 570 | 157 967 067 |
| 17 | Poland – Germany/Saxony | 2014TC16RFCB018 | 82 353 025 | 70 000 069 |
| 18 | Germany/Mecklenburg‑Vorpommern – Brandenburg – Poland | 2014TC16RFCB019 | 157 647 549 | 134 000 414 |
| 19 | Greece – Italy | 2014TC16RFCB020 | 123 176 901 | 104 700 362 |
| 20 | Romania – Bulgaria | 2014TC16RFCB021 | 258 504 126 | 215 745 513 |
| 21 | Greece – Bulgaria | 2014TC16RFCB022 | 130 262 835 | 110 723 408 |
| 22 | Germany – The Netherlands | 2014TC16RFCB023 | 443 059 158 | 222 159 360 |
| 23 | Germany – Austria – Switzerland – Liechtenstein (Alpenrhein – Bodensee – Hochrhein) | 2014TC16RFCB024 | 56 554 900 | 39 588 430 |
| 24 | Czech Republic – Poland | 2014TC16RFCB025 | 266 143 190 | 226 221 710 |
| 25 | Sweden – Denmark – Norway (Öresund – Kattegat – Skagerrak) | 2014TC16RFCB026 | 271 376 522 | 135 688 261 |
| 26 | Latvia – Lithuania | 2014TC16RFCB027 | 82 255 348 | 69 621 072 |
| 27 | Sweden – Finland – Norway (Botnia – Atlantica) | 2014TC16RFCB028 | 61 284 055 | 36 334 420 |
| 28 | Slovenia – Croatia | 2014TC16RFCB029 | 55 690 913 | 46 114 193 |
| 29 | Slovakia – Czech Republic | 2014TC16RFCB030 | 106 046 429 | 90 139 463 |
| 30 | Lithuania – Poland | 2014TC16RFCB031 | 70 769 277 | 60 153 883 |
| 31 | Sweden – Finland – Norway (Nord) | 2014TC16RFCB032 | 94 617 296 | 60 413 727 |
| 32 | Italy – France (Maritime) | 2014TC16RFCB033 | 199 649 897 | 169 702 411 |
| 33 | France – Italy (ALCOTRA) | 2014TC16RFCB034 | 233 972 102 | 198 876 285 |
| 34 | Italy – Switzerland | 2014TC16RFCB035 | 118 281 056 | 100 221 466 |
| 35 | Italy – Slovenia | 2014TC16RFCB036 | 92 588 182 | 77 929 954 |
| 36 | Italy – Malta | 2014TC16RFCB037 | 51 708 438 | 43 952 171 |
| 37 | France – Belgium – The Netherlands – United Kingdom (Les Deux Mers / Two seas / Twee Zeeën) | 2014TC16RFCB038 | 392 143 504 | 256 648 702 |
| 38 | France – Germany – Switzerland (Rhin supérieur / Oberrhein) | 2014TC16RFCB039 | 210 615 695 | 109 704 965 |
| 39 | France – United Kingdom (Manche / Channel) | 2014TC16RFCB040 | 315 264 678 | 223 046 948 |
| 40 | France – Switzerland | 2014TC16RFCB041 | 102 823 622 | 65 890 505 |
| 41 | Italy – Croatia | 2014TC16RFCB042 | 236 890 849 | 201 357 220 |
| 42 | Belgium – France (France – Wallonie – Vlaanderen) | 2014TC16RFCB044 | 283 295 074 | 169 977 045 |
| 43 | France – Belgium – Germany – Luxembourg (Grande Région / Großregion) | 2014TC16RFCB045 | 234 606 265 | 139 802 646 |
| 44 | Belgium – The Netherlands (Vlaanderen – Nederland) | 2014TC16RFCB046 | 305 151 170 | 152 575 585 |
| 45 | United Kingdom – Ireland (Ireland – Northern Ireland – Scotland) | 2014TC16RFCB047 | 282 761 998 | 240 347 696 |
| 46 | United Kingdom/Wales – Ireland | 2014TC16RFCB048 | 98 998 059 | 79 198 450 |
| 47 | Romania – Hungary | 2014TC16RFCB049 | 231 861 763 | 189 138 672 |
| 48 | Estonia – Latvia | 2014TC16RFCB050 | 46 728 715 | 38 933 803 |
| 49 | Italy – Austria | 2014TC16RFCB052 | 98 380 352 | 82 238 866 |
| 50 | Slovenia – Hungary | 2014TC16RFCB053 | 18 641 195 | 14 795 015 |
| 51 | Slovenia – Austria | 2014TC16RFCB054 | 57 213 193 | 47 988 355 |
| 52 | Greece – Cyprus | 2014TC16RFCB055 | 64 560 486 | 54 876 411 |
| 53 | Germany – Denmark | 2014TC16RFCB056 | 121 306 000 | 89 634 975 |
| All cross‑border cooperation for internal borders programmes | 8 597 431 283 | 6 346 119 962 | ||
| The cross‑border cooperation for internal borders programmes that we examined | 3 508 658 525 | 2 708 476 109 | ||
Source: ECA, based on the cooperation programmes for the 2014-2020 period.
Annex II – List of Interreg V-B transnational cooperation programmes for the 2014-2020 period
For the 2014-2020 programme period, Interreg V-B covers 15 cooperation programmes of a total value of €2.1 billion.
These are: North sea, North-west Europe, Northern periphery and Arctic, Baltic Sea, Danube area, Atlantic area, Alpine space, Central Europe, Adriatic – Ionian, Balkan –Mediterranean, South-west Europe, Mediterranean area, Caribbean area, Amazonia, and Indian Ocean area. The countries involved in each cooperation programme are shown in Figure 10.
Figure 10
Interreg V-B: The 15 transnational cooperation programmes

Source: European Commission, https://ec.europa.eu/regional_policy/en/policy/cooperation/european-territorial/trans-national/.
On top of the funding through Interreg B strand, the European Council has endorsed four macro-regional strategies47:
- the EU strategy for the Baltic Sea region (2009);
- the EU strategy for the Danube region (2010);
- the EU strategy for the Adriatic and Ionian region (2014); and
- the EU strategy for the Alpine region (2015).
The four macro-regional strategies concern 19 EU Member States and eight non-EU countries, as shown in Figure 11.
Figure 11
Interreg V-B: The four macro-transnational regions

Source: European Commission, https://ec.europa.eu/regional_policy/en/policy/cooperation/.
Annex III – List of thematic objectives for Interreg V‑A for internal borders for the 2014-2020 period
Data as of 31.12.2020
| TO | Name |
Total EU contribution (in euros) |
% |
| TO 1 | Strengthening research, technological development and innovation | 872 076 167 | 13.7 % |
| TO 2 | Enhancing access to, and use and quality of information and communication technologies (ICT) | 0 | 0 % |
| TO 3 | Enhancing the competitiveness of small and medium-sized enterprises (SMEs) | 300 110 731 | 4.7 % |
| TO 4 | Supporting the shift towards a low-carbon economy in all sectors | 161 017 673 | 2.5 % |
| TO 5 | Promoting climate change adaptation, risk prevention and management | 279 299 676 | 4.4 % |
| TO 6 | Preserving and protecting the environment and promoting resource efficiency | 1 478 698 158 | 23.2 % |
| TO 7 | Promoting sustainable transport and removing bottlenecks in key network infrastructures | 593 085 445 | 9.3 % |
| TO 8 | Promoting sustainable and quality employment and supporting labour mobility | 375 390 004 | 5.9 % |
| TO 9 | Promoting social inclusion, combating poverty and any discrimination | 216 707 527 | 3.4 % |
| TO 10 | Investing in education, training and vocational training for skills and lifelong learning | 116 666 051 | 1.8 % |
| TO 11 | Enhancing institutional capacity of public authorities and stakeholders and efficient public administration | 569 531 414 | 9.0 % |
| Multiple TOs | 940 330 421 | 14.8 % | |
| Technical Assistance | 319 783 299 | 5.0 % | |
| No thematic objective selected (blanc) | 123 423 396 | 1.9 % | |
| TOTAL | 6 346 119 962 | 100 % |
Source: ESI funds open data platform.
Annex IV – List of the 10 most used intervention codes for Interreg V‑A for internal borders for the 2014-2020 period
Data as of 31.12.2020
| Code | Description |
Total EU contribution (in euros) |
% (on the total) |
| 94 | Protection, development and promotion of public cultural and heritage assets | 444 477 809 | 7 % |
| 87 | Adaptation to climate change measures and prevention of climate related risks e.g. erosion, fires, storms and drought, including awareness raising, civil protection and disaster management systems and infrastructures’ | 355 767 156 | 6 % |
| 34 | Other reconstructed or improved road (motorway, national, regional or local) | 310 554 407 | 5 % |
| 119 | Investment in institutional capacity and in the efficiency of public administrations and public services at the national, regional and local levels with a view to reforms, better regulation and good governance | 303 568 412 | 5 % |
| 121 | Technical Assistance: Preparation, implementation, monitoring and inspection | 295 745 460 | 5 % |
| 62 | Technology transfer and university-enterprise cooperation primarily benefiting SMEs | 272 901 928 | 4 % |
| 85 | Protection and enhancement of biodiversity, nature protection and green infrastructure | 271 919 799 | 4 % |
| 91 | Development and promotion of the tourism potential of natural areas | 254 307 765 | 4 % |
| 60 | Research and innovation activities in public research centres and centres of competence including networking | 223 236 862 | 4 % |
| 112 | Enhancing access to affordable, sustainable and high-quality services, including health care and social services of general interest | 205 317 652 | 3 % |
| Total of the 10 most used intervention codes | 2 937 797 250 | 46 % | |
| All the rest | 3 408 322 712 | 54 % | |
| TOTAL | 6 346 119 962 | 100 % |
Source: ESI funds open data platform.
Annex V – List of the examined cooperation programmes, type of examination performed and mainstream programmes selected for comparison
The table below lists the 23 cooperation programmes, along with the total budget, the EU contribution and the length of examination we performed for each one:
- in a simple desk review (ten programmes in total), we examined the: cross‑border challenges; SWOT and/or socioeconomic analysis; intervention logic; focus of the programme in comparison to two mainstreams from the adjacent regions; indicators; process for assessing the cross‑border character of the projects; process for coordinating with other ESI funds; position and border orientation papers; and preparation stage for the 2021-2027 period;
- in an extended desk review (ten programmes in total), we additionally examined the: calls for proposals; selection process of projects; and approach followed for attracting project proposals (‘top-down’ or ‘bottom-up’); and
- in an examination on the spot (three programmes in total), we additionally examined: a sample of four projects, and their cross‑border character.
| Name | CCI |
Total OP budget (in euros) |
Total EU contribution (in euros) |
Type of ECA examination | |
| 1 | Belgium – Germany – The Netherlands (Euregio Maas-Rijn) | 2014TC16RFCB001 | 140 434 645 | 96 000 250 | simple desk review |
|
Mainstream 1 Belgium: OP Flanders (regional) |
2014BE16RFOP002 | 435 508 941 | 175 592 099 | ||
|
Mainstream 2 Germany: OP North Rhine-Westphalia (regional) |
2014DE16RFOP009 | 2 423 462 022 | 1 211 731 011 | ||
| 2 | Austria – Germany/Bavaria | 2014TC16RFCB004 | 64 332 186 | 54 478 064 | simple desk review |
|
Mainstream 1 Austria: OP Investments in Growth and Employment (national) |
2014AT16RFOP001 | 2 037 475 362 | 536 262 079 | ||
|
Mainstream 2 Germany: OP Bayern 2014-2020 EFRE (regional) |
2014DE16RFOP002 | 1 478 842 432 | 494 704 308 | ||
| 3 | Spain – Portugal (POCTEP) | 2014TC16RFCB005 | 484 687 353 | 365 769 686 | simple desk review |
|
Mainstream 1 Spain: OP Andalucía 2014-2020 (regional) |
2014ES16RFOP003 | 3 951 571 669 | 3 200 907 333 | ||
|
Mainstream 2 Portugal: OP Norte 2014-2020 (regional) |
2014PT16M2OP001 | 4 209 657 730 | 3 378 770 731 | ||
| 4 | Spain – France – Andorra (POCTEFA) | 2014TC16RFCB006 | 288 964 102 | 189 341 397 | simple desk review |
|
Mainstream 1 Spain: Cataluña (regional) |
2014ES16RFOP011 | 1 671 234 350 | 835 617 175 | ||
|
Mainstream 2 France: Languedoc-Roussillon (regional) |
2014FR16M0OP006 | 754 041 639 | 431 686 793 | ||
| 5 | Germany/Bavaria – Czech Republic | 2014TC16RFCB009 | 121 617 825 | 103 375 149 | extended desk review |
|
Mainstream 1 Germany: OP Bayern 2014-2020 (regional) |
2014DE16RFOP002 | 1 478 842 432 | 494 704 308 | ||
|
Mainstream 2 Czechia: Integrated ROP Growth 2014-2020 (national) |
2014CZ16RFOP002 | 5 575 445 155 | 4 763 230 350 | ||
| 6 | Austria – Hungary | 2014TC16RFCB010 | 95 870 327 | 78 847 880 | extended desk review |
|
Mainstream 1 Austria: OP Investments in Growth and Employment (national) |
2014AT16RFOP001 | 2 037 475 362 | 536 262 079 | ||
|
Mainstream 2 Hungary: OP Economic Development and Innovation 2014-2020 (national) |
2014HU16M0OP001 | 8 813 195 514 | 7 733 969 530 | ||
| 7 | Poland – Lithuania – Denmark – Germany –Sweden (South Baltic) | 2014TC16RFCB013 | 100 614 276 | 82 978 784 | extended desk review |
|
Mainstream 1 Poland: Regional OP Pomorskie 2014-2020 (regional) |
2014PL16M2OP011 | 2 193 896 122 | 1 864 811 698 | ||
|
Mainstream 2 Lithuania: OP for EU Structural Funds Investments for 2014-2020 (national) |
2014LT16MAOP001 | 7 887 798 523 | 6 709 396 130 | ||
| 8 | Finland – Estonia – Latvia – Sweden (Central Baltic) | 2014TC16RFCB014 | 170 544 922 | 132 628 689 | examination on the spot |
|
Mainstream 1 Finland: Sustainable growth and jobs for Finland 2014-2020 (national) |
2014FI16M2OP001 | 2 570 429 202 | 1 285 214 601 | ||
|
Mainstream 2 Estonia: Estonia’s Investment for Growth and Jobs 2014-2020 (national) |
2014EE16M3OP001 | 4 891 748 878 | 3 499 202 664 | ||
| 9 | Slovakia – Hungary | 2014TC16RFCB015 | 183 304 695 | 155 808 987 | simple desk review |
|
Mainstream 1 Slovakia: Integrated Regional OP 2014‑2020 (national) |
2014SK16RFOP002 | 2 059 278 976 | 1 699 941 778 | ||
|
Mainstream 2 Hungary: Economic Development and Innovation 2014-2020 (national) |
2014HU16M0OP001 | 8 813 195 514 | 7 733 969 530 | ||
| 10 | Sweden – Norway | 2014TC16RFCB016 | 94 399 930 | 47 199 965 | simple desk review |
|
Mainstream 1 Sweden: OP Mellersta Norrland (regional) |
2014SE16RFOP007 | 289 910 518 | 144 955 259 | ||
| 11 | Germany/Saxony – Czechia | 2014TC16RFCB017 | 189 274 570 | 157 967 067 | extended desk review |
|
Mainstream 1 Germany: OP Sachsen 2014–2020 (regional) |
2014DE16RFOP012 | 2 341 365 486 | 1 873 092 389 | ||
|
Mainstream 2 Czechia: Czechia: Integrated ROP Growth 2014-2020 (national) |
2014CZ16RFOP002 | 5 575 445 155 | 4 763 230 350 | ||
| 12 | Romania – Bulgaria | 2014TC16RFCB021 | 258 504 126 | 215 745 513 | extended desk review48 |
|
Mainstream 1 Romania: Romanian Regional OP (national) |
2014RO16RFOP002 | 8 384 288 100 | 6 860 000 000 | ||
|
Mainstream 2 Bulgaria: Bulgarian regional OP Regions in Growth (national) |
2014BG16RFOP001 | 1 543 182 113 | 1 311 704 793 | ||
| 13 | Germany – Austria – Switzerland – Liechtenstein (Alpenrhein – Bodensee – Hochrhein) | 2014TC16RFCB024 | 56 554 900 | 39 588 430 | extended desk review |
|
Mainstream 1 Germany: ROP Baden-Württemberg Innovation and Energy 2014-2020 (regional) |
2014DE16RFOP001 | 493 170 076 | 246 585 038 | ||
|
Mainstream 2 Austria: ERDF OP Growth and Employment Austria 2014-2020 (national) |
2014AT16RFOP001 | 2 073 339 826 | 536 262 079 | ||
| 14 | Czechia – Poland | 2014TC16RFCB025 | 266 143 190 | 226 221 710 | examination on the spot |
|
Mainstream 1 Czechia: Integrated Regional OP 2014 – 2020 (national) |
2014CZ16RFOP002 | 5 575 445 155 | 4 763 230 350 | ||
|
Mainstream 2 Poland: Regional OP Dolnośląskie 2014 – 2020 (regional) |
2014PL16M2OP001 | 2 659 054 816 | 2 252 546 589 | ||
| 15 | Sweden – Finland – Norway (Botnia – Atlantica) | 2014TC16RFCB028 | 61 284 055 | 36 334 420 | simple desk review |
|
Mainstream 1 Sweden: OP Upper Norrland (regional) |
2014SE16RFOP008 | 421 646 628 | 210 823 314 | ||
|
Mainstream 2 Finland: Sustainable growth and jobs 2014-2020 (national) |
2014FI16M2OP001 | 2 570 429 202 | 1 285 214 601 | ||
| 16 | Slovakia – Czechia | 2014TC16RFCB030 | 106 046 429 | 90 139 463 | extended desk review |
|
Mainstream 1 Slovakia: OP Integrated Infrastructure 2014-2020 (national) |
2014SK16M1OP001 | 4 646 130 079 | 3 949 210 563 | ||
|
Mainstream 2 Czechia: Integrated Regional OP 2014-2020 (national) |
2014CZ16RFOP002 | 5 575 445 155 | 4 763 230 350 | ||
| 17 | Italy – Slovenia | 2014TC16RFCB036 | 92 588 182 | 77 929 954 | extended desk review |
|
Mainstream 1 Italy: ROP Friuli Venezia Giulia (regional) |
2014IT16RFOP009 | 230 779 184 | 115 389 592 | ||
|
Mainstream 2 Slovenia: OP for the Implementation of the EU Cohesion Policy (national) |
2014SI16MAOP001 | 3 818 118 670 | 3 067 924 925 | ||
| 18 | Italy – Malta | 2014TC16RFCB037 | 51 708 438 | 43 952 171 | extended desk review |
|
Mainstream 1 Italy: ROP Sicilia ERDF 2014-2020 (regional) |
2014IT16RFOP016 | 4 273 038 791 | 3 418 431 018 | ||
|
Mainstream 2 Malta: OP Malta - Fostering a competitive and sustainable economy to meet our challenges 2014-2020 (national) |
2014MT16M1OP001 | 709 109 686 | 580 096 106 | ||
| 19 | Italy – Croatia | 2014TC16RFCB042 | 236 890 849 | 201 357 220 | simple desk review |
|
Mainstream 1 Italy: Apulia Regional OP 2014-2020 (regional) |
2014IT16M2OP002 | 7 120 958 992 | 3 560 479 496 | ||
|
Mainstream 2 Croatia: OP Competitiveness and Cohesion 2014-2020 (national) |
2014HR16M1OP001 | 8 036 770 938 | 6 831 255 232 | ||
| 20 | France – Belgium – Germany – Luxembourg (Greater Region) | 2014TC16RFCB045 | 234 606 265 | 139 802 646 | examination on the spot |
|
Mainstream 1 France: OP ERDF/ESF Lorraine and Vosges 2014-2020 (regional) |
2014FR16M0OP015 | 689 879 511 | 409 839 615 | ||
|
Mainstream 2 Belgium: OP Wallonia-2020.EU (regional) |
2014BE16RFOP003 | 1 700 524 237 | 681 639 700 | ||
| 21 | United Kingdom/Wales – Ireland | 2014TC16RFCB048 | 98 998 059 | 79 198 450 | extended desk review |
|
Mainstream 1 United Kingdom: ERDF West Wales and The Valleys (regional) |
2014UK16RFOP005 | 1 829 859 998 | 1 206 110 065 | ||
|
Mainstream 2 Ireland: Southern & Eastern ROP (regional) |
2014IE16RFOP002 | 500 132 354 | 250 066 177 | ||
| 22 | Estonia – Latvia | 2014TC16RFCB050 | 46 728 715 | 38 933 803 | simple desk review |
|
Mainstream 1 Estonia: Operational Program for Cohesion Policy Funds 2014-2020 (national) |
2014EE16M3OP001 | 4 655 679 786 | 3 499 202 664 | ||
|
Mainstream 2 Latvia: Growth and employment 2014-2020 (national) |
2014LV16MAOP001 | 5 192 801 940 | 4 418 233 214 | ||
| 23 | Greece – Cyprus | 2014TC16RFCB055 | 64 560 486 | 54 876 411 | simple desk review |
|
Mainstream 1 Greece: Crete OP (regional) |
2014GR16M2OP011 | 449 652 852 | 359 722 280 | ||
|
Mainstream 2 Cyprus: OP Competitiveness and sustainable development (national) |
2014CY16M1OP001 | 699 726 575 | 594 767 585 |
Source: ECA, based on data from the cooperation and mainstream programmes for the 2014-2020 period.
Annex VI – Reaction by programme authorities to recommendations 1a and 2
Some of our recommendations are addressed to the programme authorities, responsible for implementing them. We have therefore requested their reaction to our recommendations. The replies we have received, as well as the reasons why some of the authorities did not (or only partially) accept our recommendations, are summarised below.
Table 1 – Recommendation 1a: Better focus the cooperation programme
| Reaction by programme authorities | |
| Accepted | 14 |
| Partially accepted | 5 |
| Not accepted | 4 |
|
The main reasons for ‘partially’ or ‘not accepting’ this recommendation is that these programme authorities consider that the relevant Interreg programmes are already well-focused and sufficiently coordinated with the mainstream programmes of the adjacent regions as:
|
|
Table 2 – Recommendation 2: Prioritise and award support to projects based on merit using scores
| Reaction by programme authorities | |
| Accepted | 14 |
| Partially accepted | 6 |
| Not accepted | 3 |
| The main reason for ‘partially’ or ‘not accepting’ this recommendation is because programme authorities consider it as already implemented. | |
Acronyms and abbreviations
CPR: Common Provisions Regulation
CRII: Coronavirus Response Investment Initiative
CRII+: Coronavirus Response Investment Initiative Plus
DG REGIO: Directorate-General for Regional and Urban Policy
ERDF: European Regional Development Fund
ESF: European Social Fund
ESI funds: European Structural and Investment funds
ETC: European Territorial Cooperation
GDP: Gross Domestic Product
Interreg: Acronym by which the EU’s interregional cooperation programme is generally known
NUTS: Nomenclature of Territorial Units for Statistics
SMART: Specific, Measurable, Attainable, Relevant, Timely
SWOT: Strengths, weaknesses, opportunities and threats
TO: Thematic Objective
Glossary
Coronavirus Response Investment Initiative: Package of measures to allow flexible use of the European Structural and Investment Funds in response to the COVID‑19 outbreak.
European Regional Development Fund: An EU fund that strengthens economic and social cohesion in the EU by financing investments that reduce imbalances between regions.
European Structural and Investment funds: The five main EU funds which together support economic development across the EU: the European Regional Development Fund, the European Social Fund, the Cohesion Fund, the European Agricultural Fund for Rural Development, and the European Maritime and Fisheries Fund.
European Territorial Cooperation: Framework for interregional, cross‑border and transnational cooperation guiding policy exchanges and the implementation of joint action.
Intervention logic: The links between a proposal’s objectives, the planned inputs and activities and the intended results and impact.
Investment priority: Sub-division of a priority axis.
Joint secretariat: Office that assists the managing authority and monitoring committee of a European territorial cooperation programme, as well as informing beneficiaries about potential funding opportunities and supporting project implementation.
Managing authority: The national, regional or local authority (public or private) designated by a Member State to manage an EU-funded programme.
Monitoring committee: A body that oversees the implementation of an operational programme, comprising representatives of Member State authorities and the Commission as observer.
Priority axis: A key objective of an operational programme, divided into one or more investment priorities.
Thematic objective: The intended overall result of an investment priority, broken down into specific objectives for implementation purposes.
Audit team
The ECA’s special reports set out the results of its audits of EU policies and programmes, or of management-related topics from specific budgetary areas. The ECA selects and designs these audit tasks to be of maximum impact by considering the risks to performance or compliance, the level of income or spending involved, forthcoming developments and political and public interest.
This performance audit was carried out by Audit Chamber II Investment for cohesion, growth and inclusion spending areas, headed by ECA Member Iliana Ivanova. The audit was led by ECA Member Ladislav Balko, supported by Branislav Urbanič, Head of Private Office and Zuzana Franková, Private Office Attaché; Niels‑Erik Brokopp, Principal Manager; Chrysoula Latopoulou, Head of Task; Dennis Wernerus, Deputy Head of Task; Thierry Lavigne, Katarzyna Solarek, Ana Popescu, Aleksandar Latinov, Angelika Zych, Aino Nyholm, Nils Odins and Francisco Carretero Llorente, Auditors. James Verity provided linguistic support.

Endnotes
1 Article 174 TFEU.
2 Whereas 4 of Regulation (EU) 1299/2013 of 17 December 2013 on specific provisions for the support from the European Regional Development Fund to the European territorial cooperation goal (The ETC Regulation) (OJ L 347, 20.12.2013, p. 259).
3 Article 3(2) of Regulation (EU) 1301/2013 of 17 December 2013 on the European Regional Development Fund and on specific provisions concerning the Investment for growth and jobs goal and repealing Regulation (EC) 1080/2006 (The ERDF Regulation) (OJ L 347, 20.12.2013, p. 293).
4 Whereas 5 of the ETC Regulation.
5 COM(2017) 534 final, Communication from the Commission on boosting growth and cohesion in EU border regions, of 20.9.2017, p. 6.
6 ‘Collecting solid evidence to assess the needs to be addressed by Interreg cross-border cooperation programmes’ SWECO, t33, Politecnico di Milano and Nordregio for DG REGIO, November 2016, pp. 64-91.
‘Easing legal and administrative obstacles in EU border regions’ by Metis GmbH, Panteia BV, AEIDL – Association Européenne pour l'Information sur le Développement Local, CASE – Center for Social and Economic Research for DG REGIO, March 2017.
‘Quantification of the effects of legal and administrative border obstacles in land border regions’, Politecnico di Milano for DG REGIO, May 2017.
7 Article 4(1) of the ETC Regulation.
8 Article 2 of the ETC Regulation.
9 Article 12(2) of the ETC Regulation.
10 Article 3(2) of Regulation (EC) 1059/2003 of 26 May 2003 on the establishment of a common classification of territorial units for statistics (NUTS) (OJ L 154, 21.6.2003, p. 3) subdivided the economic territory of the Member States into smaller regions in order to enable the collection, compilation and dissemination of regional statistics. Article 3(2) of this Regulation, classified the regions of the Member States in three categories using population thresholds. The level 1 regions (NUTS 1), are inhabited by 3 to 7 million people; those regions are further split to level 2 (NUTS 2), which are inhabited by 800 000 to 3 million people. Ultimately, level 2 regions are split to level 3 regions (NUTS 3), which are inhabited by 150 000 to 800 000 people.
11 Article 3(2) of the ETC Regulation.
12 Article 104(7) of the compromise text with a view to agreement on the new CPR Regulation, of 25.2.2021.
13 Article 3 of the ‘Confirmation of the final compromise text with a view to agreement on the Regulation on specific provisions for the European territorial cooperation goal (Interreg) supported by the European Regional Development Fund and external financing instruments (The new ETC Regulation), of 11.12.2020.
14 Article 9(2) of the ‘Compromise text with a view to agreement’ on the new ETC Regulation.
15 Section II(8) of Notice C(90) 1562/3 to the Member States, laying down guidelines for operational programmes which Member States are invited to establish in the framework of a Community initiative concerning border areas (Interreg) (OJ C 215, 30.8.1990, p. 4).
16 Article 7(1) of Council Regulation (EC) 1083/2006 of 11 July 2006 laying down general provisions on the European Regional Development Fund, the European Social Fund and the Cohesion Fund and repealing Regulation (EC) 1260/1999 (OJ L 210, 31.7.2006, p. 38).
17 Article 3(1) of the ETC Regulation.
18 Article 21(1) of Regulation (EC) 1080/2006 of 5 July 2006 on the European Regional Development Fund and repealing Regulation (EC) 1783/1999 (OJ L 210, 31.7.2006, p. 10).
19 Article 20(2)(b) of the ETC Regulation.
20 COM(2017) 534 final, pp. 2-4.
21 Whereas 33 and Article 23(2) of the ETC Regulation.
22 Whereas 88 of the CPR Regulation.
23 Article 9 of the CPR Regulation.
24 Article 6(1) of the ETC Regulation.
25 Article 8(1) of the ETC Regulation.
26 Article 96(1) and (2)(a)(b) of the CPR Regulation and Article 8(1) and (2) of the ETC Regulation.
27 Article 14 of the ETC Regulation.
28 Article 16 and the Annex of the ETC Regulation.
29 ETC, Work Package 11, ‘Ex post evaluation of Cohesion Policy programmes 2007-2013, focusing on the ERDF and the Cohesion Fund’, ADE contract with DG REGIO, July 2016.
30 Article 15 of the ‘Compromise text with a view to agreement’ on the new ETC Regulation.
31 Regulation (EU) 2020/460 of 30 March 2020 amending Regulations (EU) 1301/2013, (EU) 1303/2013 and (EU) 508/2014 as regards specific measures to mobilise investments in the healthcare systems of Member States and in other sectors of their economies in response to the COVID-19 outbreak (Coronavirus Response Investment Initiative) (The CRII Regulation) (OJ L 99, 31.3.2020, p. 5).
32 Regulation (EU) 2020/558 of 23 April 2020 amending Regulations (EU) 1301/2013 and (EU) 1303/2013 as regards specific measures to provide exceptional flexibility for the use of the European Structural and Investments Funds in response to the COVID-19 outbreak (The CRII+ Regulation) (OJ L 130, 24.4.2020, p. 1).
33 COM(2018) 373 final, Proposal for a Regulation on a mechanism to resolve legal and administrative obstacles in a cross-border context, of 29.5.2018.
34 Article 8(2)(a) of the ETC Regulation.
35 Whereas 19 of the ETC Regulation.
36 Annex XI, of the CPR Regulation, investment priority 9a.
37 Whereas 88 of the CPR Regulation.
38 Article 8(5)(a) of the ETC Regulation.
39 Article 12(2) of the ETC Regulation.
40 Article 12(2) of the ETC Regulation.
41 Article 8(2)(b) of the ETC Regulation.
42 Article 8(2)(b) of the ETC Regulation.
43 Annex of the ETC Regulation.
44 Article 16(3) of the ETC Regulation.
45 ECA special report 02/2017, The Commission’s negotiation of 2014-2020 partnership agreements and programmes in Cohesion: spending more targeted on Europe 2020 priorities, but increasingly complex arrangements to measure performance, recommendation 1, p. 79.
46 ECA special report 17/2018, Commission’s and Member States’ actions in the last years of the 2007-2013 programmes tackled low absorption but had insufficient focus on results, paragraph 84, p. 44.
47 COM(2019) 21 final, ‘Report from the Commission on the implementation of EU macroregional strategies’, of 29.1.2019.
48 Initially, we were planning to examine this cooperation programme on the spot. Instead, and because of the COVID‑19 travel restrictions, we had to change the type of examination to an extended desk review.
Timeline
| Event | Date |
| Adoption of Audit Planning Memorandum (APM) / Start of audit | 25.9.2019 |
| Official sending of draft report to Commission (or other auditee) |
26.3.2021 |
| Adoption of the final report after the adversarial procedure | 19.5.2021 |
| Commission’s (or other auditee’s) official replies received in all languages | 7.6.2021 |
Contact
EUROPEAN COURT OF AUDITORS
12, rue Alcide De Gasperi
1615
Luxembourg
LUXEMBOURG
Tel. +352 4398-1
Enquiries: eca.europa.eu/en/Pages/ContactForm.aspx
Website: eca.europa.eu
Twitter: @EUAuditors
More information on the European Union is available on the internet (http://europa.eu).
Luxembourg: Publications Office of the European Union, 2021
| ISBN 978-92-847-6409-9 | ISSN 1977-5679 | doi:10.2865/068335 | QJ-AB-21-016-EN-N | |
| HTML | ISBN 978-92-847-6428-0 | ISSN 1977-5679 | doi:10.2865/174733 | QJ-AB-21-016-EN-Q |
COPYRIGHT
© European Union, 2021.
The reuse policy of the European Court of Auditors (ECA) is implemented by Decision of the European Court of Auditors No 6-2019 on the open data policy and the reuse of documents.
Unless otherwise indicated (e.g. in individual copyright notices), the ECA’s content owned by the EU is licensed under the Creative Commons Attribution 4.0 International (CC BY 4.0) licence. This means that reuse is allowed, provided appropriate credit is given and changes are indicated. The reuser must not distort the original meaning or message of the documents. The ECA shall not be liable for any consequences of reuse.
You are required to clear additional rights if a specific content depicts identifiable private individuals, e.g. in pictures of the ECA’s staff or includes third-party works. Where permission is obtained, such permission shall cancel and replace the above-mentioned general permission and shall clearly indicate any restrictions on use.
To use or reproduce content that is not owned by the EU, you may need to seek permission directly from the copyright holders.
Figure 5: Icons made by Pixel perfect from https://flaticon.com.
Software or documents covered by industrial property rights, such as patents, trade marks, registered designs, logos and names, are excluded from the ECA’s reuse policy and are not licensed to you.
The European Union’s family of institutional Web Sites, within the europa.eu domain, provides links to third-party sites. Since the ECA has no control over them, you are encouraged to review their privacy and copyright policies.
Use of European Court of Auditors’ logo
The European Court of Auditors logo must not be used without the European Court of Auditors’ prior consent.
GETTING IN TOUCH WITH THE EU
In person
All over the European Union there are hundreds of
Europe Direct Information Centres. You can find the address of the centre nearest
you at: https://europa.eu/european-union/contact_en
On the phone or by e-mail
Europe Direct is a service that your
questions about the European Union. You can contact this service
- by freephone: 00 800 6 7 8 9 10 11 (certain operators may charge for these calls),
- at the following standard number: +32 22999696 or
- by electronic mail via: https://europa.eu/european-union/contact_en
FINDING INFORMATION ABOUT THE EU
Online
Information about the European Union in all the official
languages of the EU is available on the Europa website at: https://europa.eu/european-union/index_en
EU Publications
You can download or order free and priced EU
publications at: https://op.europa.eu/en/web/general-publications/publications. Multiple
copies of free publications may be obtained by contacting Europe Direct or your
local information centre (see https://europa.eu/european-union/contact_en)
EU law and related documents
For access to legal information
from the EU, including all EU law since 1952 in all the official language versions,
go to EUR-Lex at: http://eur-lex.europa.eu/homepage.html?locale=en
Open data from the EU
The EU Open Data Portal (https://data.europa.eu/euodp/en/home) provides access to datasets from the
EU. Data can be downloaded and reused for free, both for commercial and
non-commercial purposes.