Recent trends in working time and their determinants
This section provides an overview of the main recent trends in hours worked and their determinants in the EU. .First, it describes the trends in hours worked overall in the EU and its Member States by type of employment (full-time, part-time, self-employed, employee). Then it presents the results of the analysis of the demographic determinants of hours worked (age, gender, level of education). To conclude, it analyses the institutional determinants of working time that contribute to explaining differences in hours worked between Member States.
Recent trends in EU and Member States
Since 2008, the average number of hours worked per worker has been steadily decreasing in the EU and in the majority of Member States. This decline occurred in both average weekly and average annual hours worked. The average number of self-reported weekly hours worked per employed person (aged between 20 and 64 years) decreased in the EU from 38.3 hours in 2008 to 37.5 hours in 2022 (-2 %); the decline was particularly marked for self-employed people, whose average number of weekly hours worked decreased from 45.7 in 2008 to 42.9 in 2022 (-6 %). The average annual hours per worker receded from 1 651 to 1 566 hours in the EU (-5.15 %) between 2008 and 2022. This drop is larger than the one in weekly hours worked per worker, as annual hours are influenced not only by the length of the working week but also by the length of holidays and leave days for illness or other reasons.
Graph 3.2: EU average working week cumulative changes – decomposition on changes in working time and employment composition
Additional information about graph 3.2
The figure shows the cumulative impact of the determinants of the decrease in average weekly hours in the EU, from 2009 to 2022. Between 2009 and 2015, reductions in the length of the full-time working week and compositional changes between full-time and part-time employment, driven by the increasing share of part-time workers, contributed to the overall reduction in average weekly working hours in the EU to a similar extent. The length of the self-employed working week has also decreased in those years, but it has contributed to a lesser extent to the overall decrease in average weekly hours. After 2016, the contribution of the above-mentioned components to the total decrease changed. The reduction in the average weekly working time of full-time employees and self-employed workers became the dominant component of the reduction in average weekly working time at the EU level. This has become even more the case since 2020, due to the significant drop in hours worked during the pandemic. The compositional changes between full-time and part-time employment, driven by the increasing share of part-time workers, kept contributing to the reduction in average weekly working hours but to a lesser extent than before.
Note
See Appendix 4 for the methodology of the decomposition.
Source
Own calculations using Eurostat LFS.
The decline in average weekly working hours between 2008 and 2022 became increasingly driven by the reduction in weekly hours worked by full-time employees and self-employed people.Changes in average weekly hours can be decomposed into changes due to the composition of the workforce and due to changes in the working time within each employment relationship (Appendix 4). Graph 3.2 shows the cumulative impact of the determinants of changes in average weekly hours in the EU . Between 2009 and 2015, reductions in the length of the full-time working week and compositional changes in employment (driven by the increasing share of part-time workers) contributed to the reduction in average weekly working hours in the EU to a similar extent. After 2016, the trend shifted, the reduction in the average weekly working time of full-time employees and self-employed people became the dominant component of the reduction in average weekly working time at the EU level. This has become even more the case since 2020, due to the significant drop in hours worked during the pandemic. .
The differences between EU countries in the determinants of the average length of the working week are considerable.(Graph 3.A4.1 in Appendix 4). In Greece, Spain, Italy, Cyprus and the Netherlands, between 2009 and 2015, changes in working time were driven to a large extent by a shift towards part-time employment. After 2016, this trend slowed down for Greece, Spain and Cyprus, and it even reversed in the Netherlands, where the rise in full-time employment relative to part-time employment contributed positively to the length of the working week between 2019 and 2022. In Germany and the Netherlands, the average weekly working time in part-time arrangements has increased significantly since 2010. In Belgium, Czechia, France and Cyprus the decline in the length of self-employed people’s working week has been a significant contributor to the decline in average weekly hours. In France, the Netherlands, Romania and Slovakia, the increase in the share of self-employed people has had a positive impact on the duration of the working week .
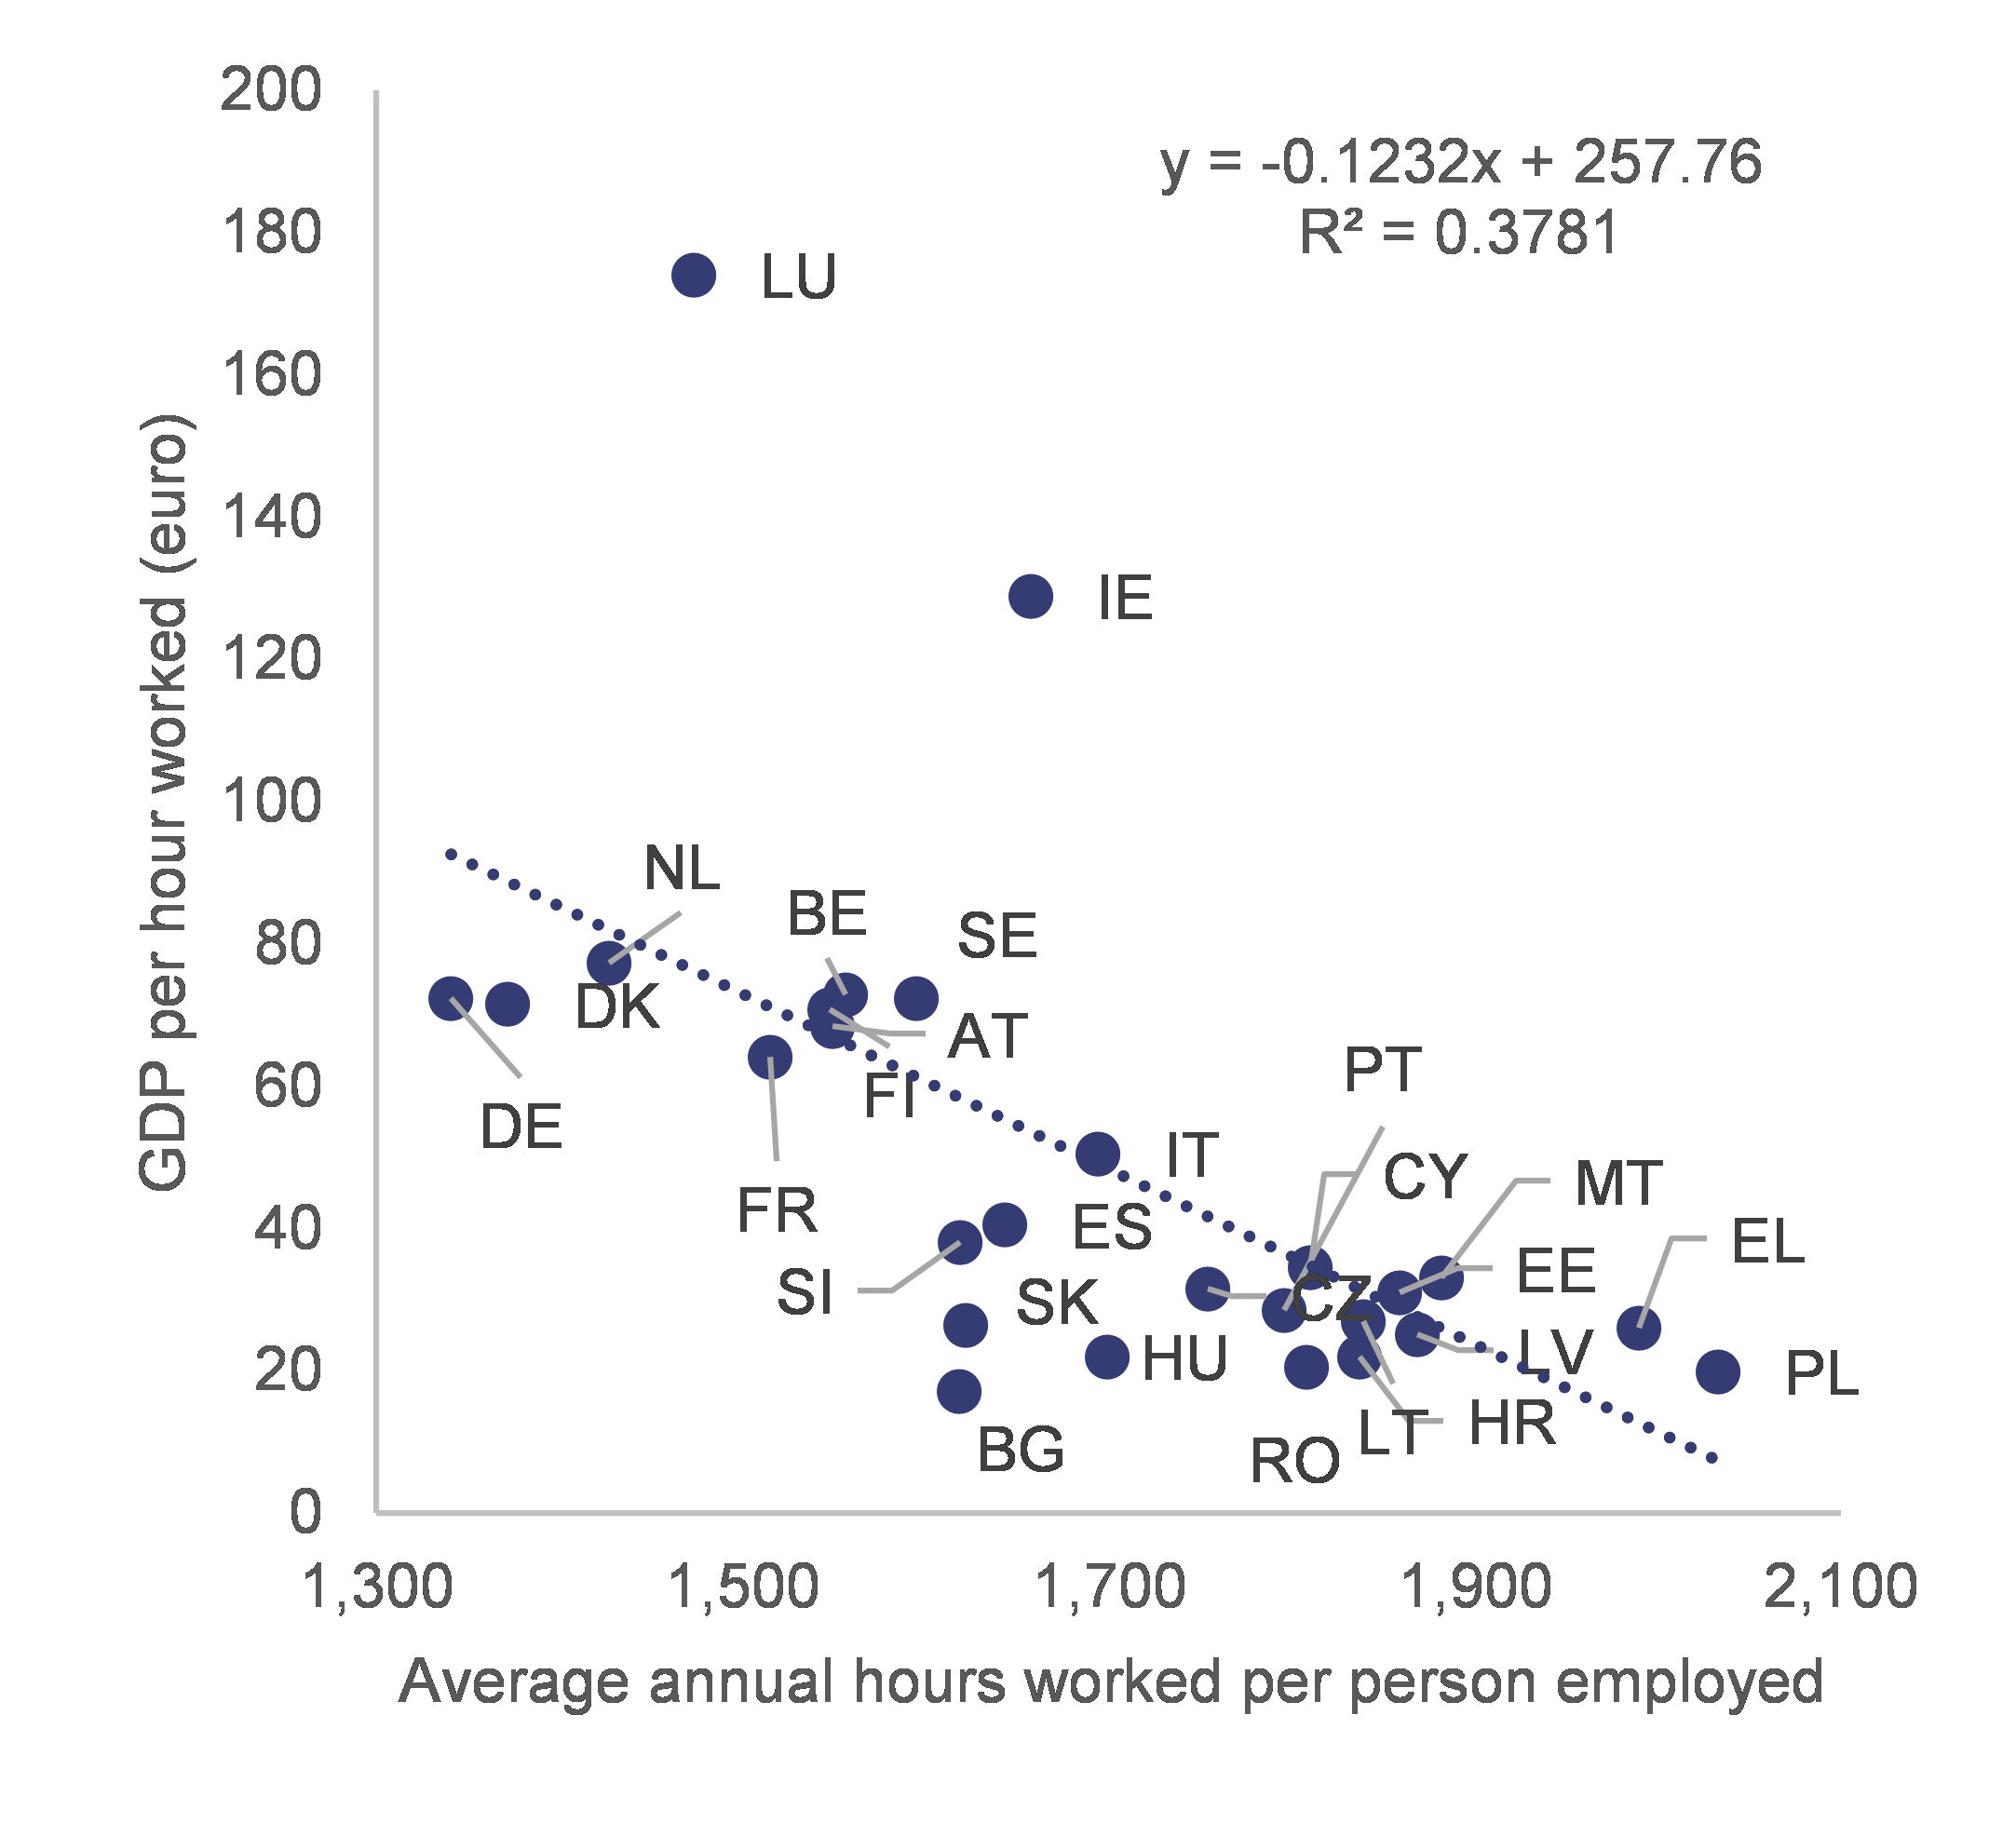
Graph 3.3: Average number of annual hours worked per person employed and GDP per hour worked, EU Member States
Additional information about graph 3.3
The chart shows the relationship between GDP per hour worked (expressed in euro) and the average number of annual hours worked per person employed in all Member States.
The GDP per hour worked is shown on the y-axis, while the average number of annual hours worked per person employed are displayed on the x-axis. Each Member State is represented by a dot, whose position in the chart is determined by the 2022 value of the GDP per hour worked and the average annual hours worked per person employed of that specific Member State. At the centre left of the chart there are countries such as Germany, Luxembourg and the Netherlands which are characterised by low average annual hours worked and high GDP per hour worked, while on the bottom right part of the chart there are countries such as Croatia, Greece, Latvia, Lithuania and Malta, which are characterised by high average annual hours worked and low GDP per hour worked.
GDP per hour worked has been regressed on the average annual hours worked per person employed to understand the sign of the correlation between these two variables. The coefficients of this regression (which has a R-squared of 37%) are shown in the top right part of the chart: the coefficient of the explanatory variable is equal to -0.1232. To conclude, the observed negative correlation between the level of economic development and hours worked is represented in the chart through a dotted declining line which goes from the centre left to the bottom right of the chart passing through the dots that represent Member States.
Source
AMECO and Eurostat.
The level of economic development of a country is negatively correlated with the average weekly hours worked.Richer countries are characterised by higher labour productivity (proxied by GDP per hour worked as shown in Graph 3.3), which in turn allows workers to spend less time working and more time on leisure (e.g., see Giattino and Ortiz-Ospina, 2020 and Morley and Sanoussi, 2009). This could be driven by the income effect, leading to an increase in the preference for leisure with increased economic development. However, the cross-country differences in average weekly working hours are also influenced by the share of self-employed, part-time and full-time workers. The average weekly hours worked were above the EU average in eastern European Member States as well as in Spain, Greece and Portugal from 2008 to 2020. On the other hand, the Member States recording average weekly hours worked below the EU average during the same period were Belgium, Denmark, Germany, Ireland, France, Italy, the Netherlands and Finland (Graph 3.A3.1 in Appendix 3).
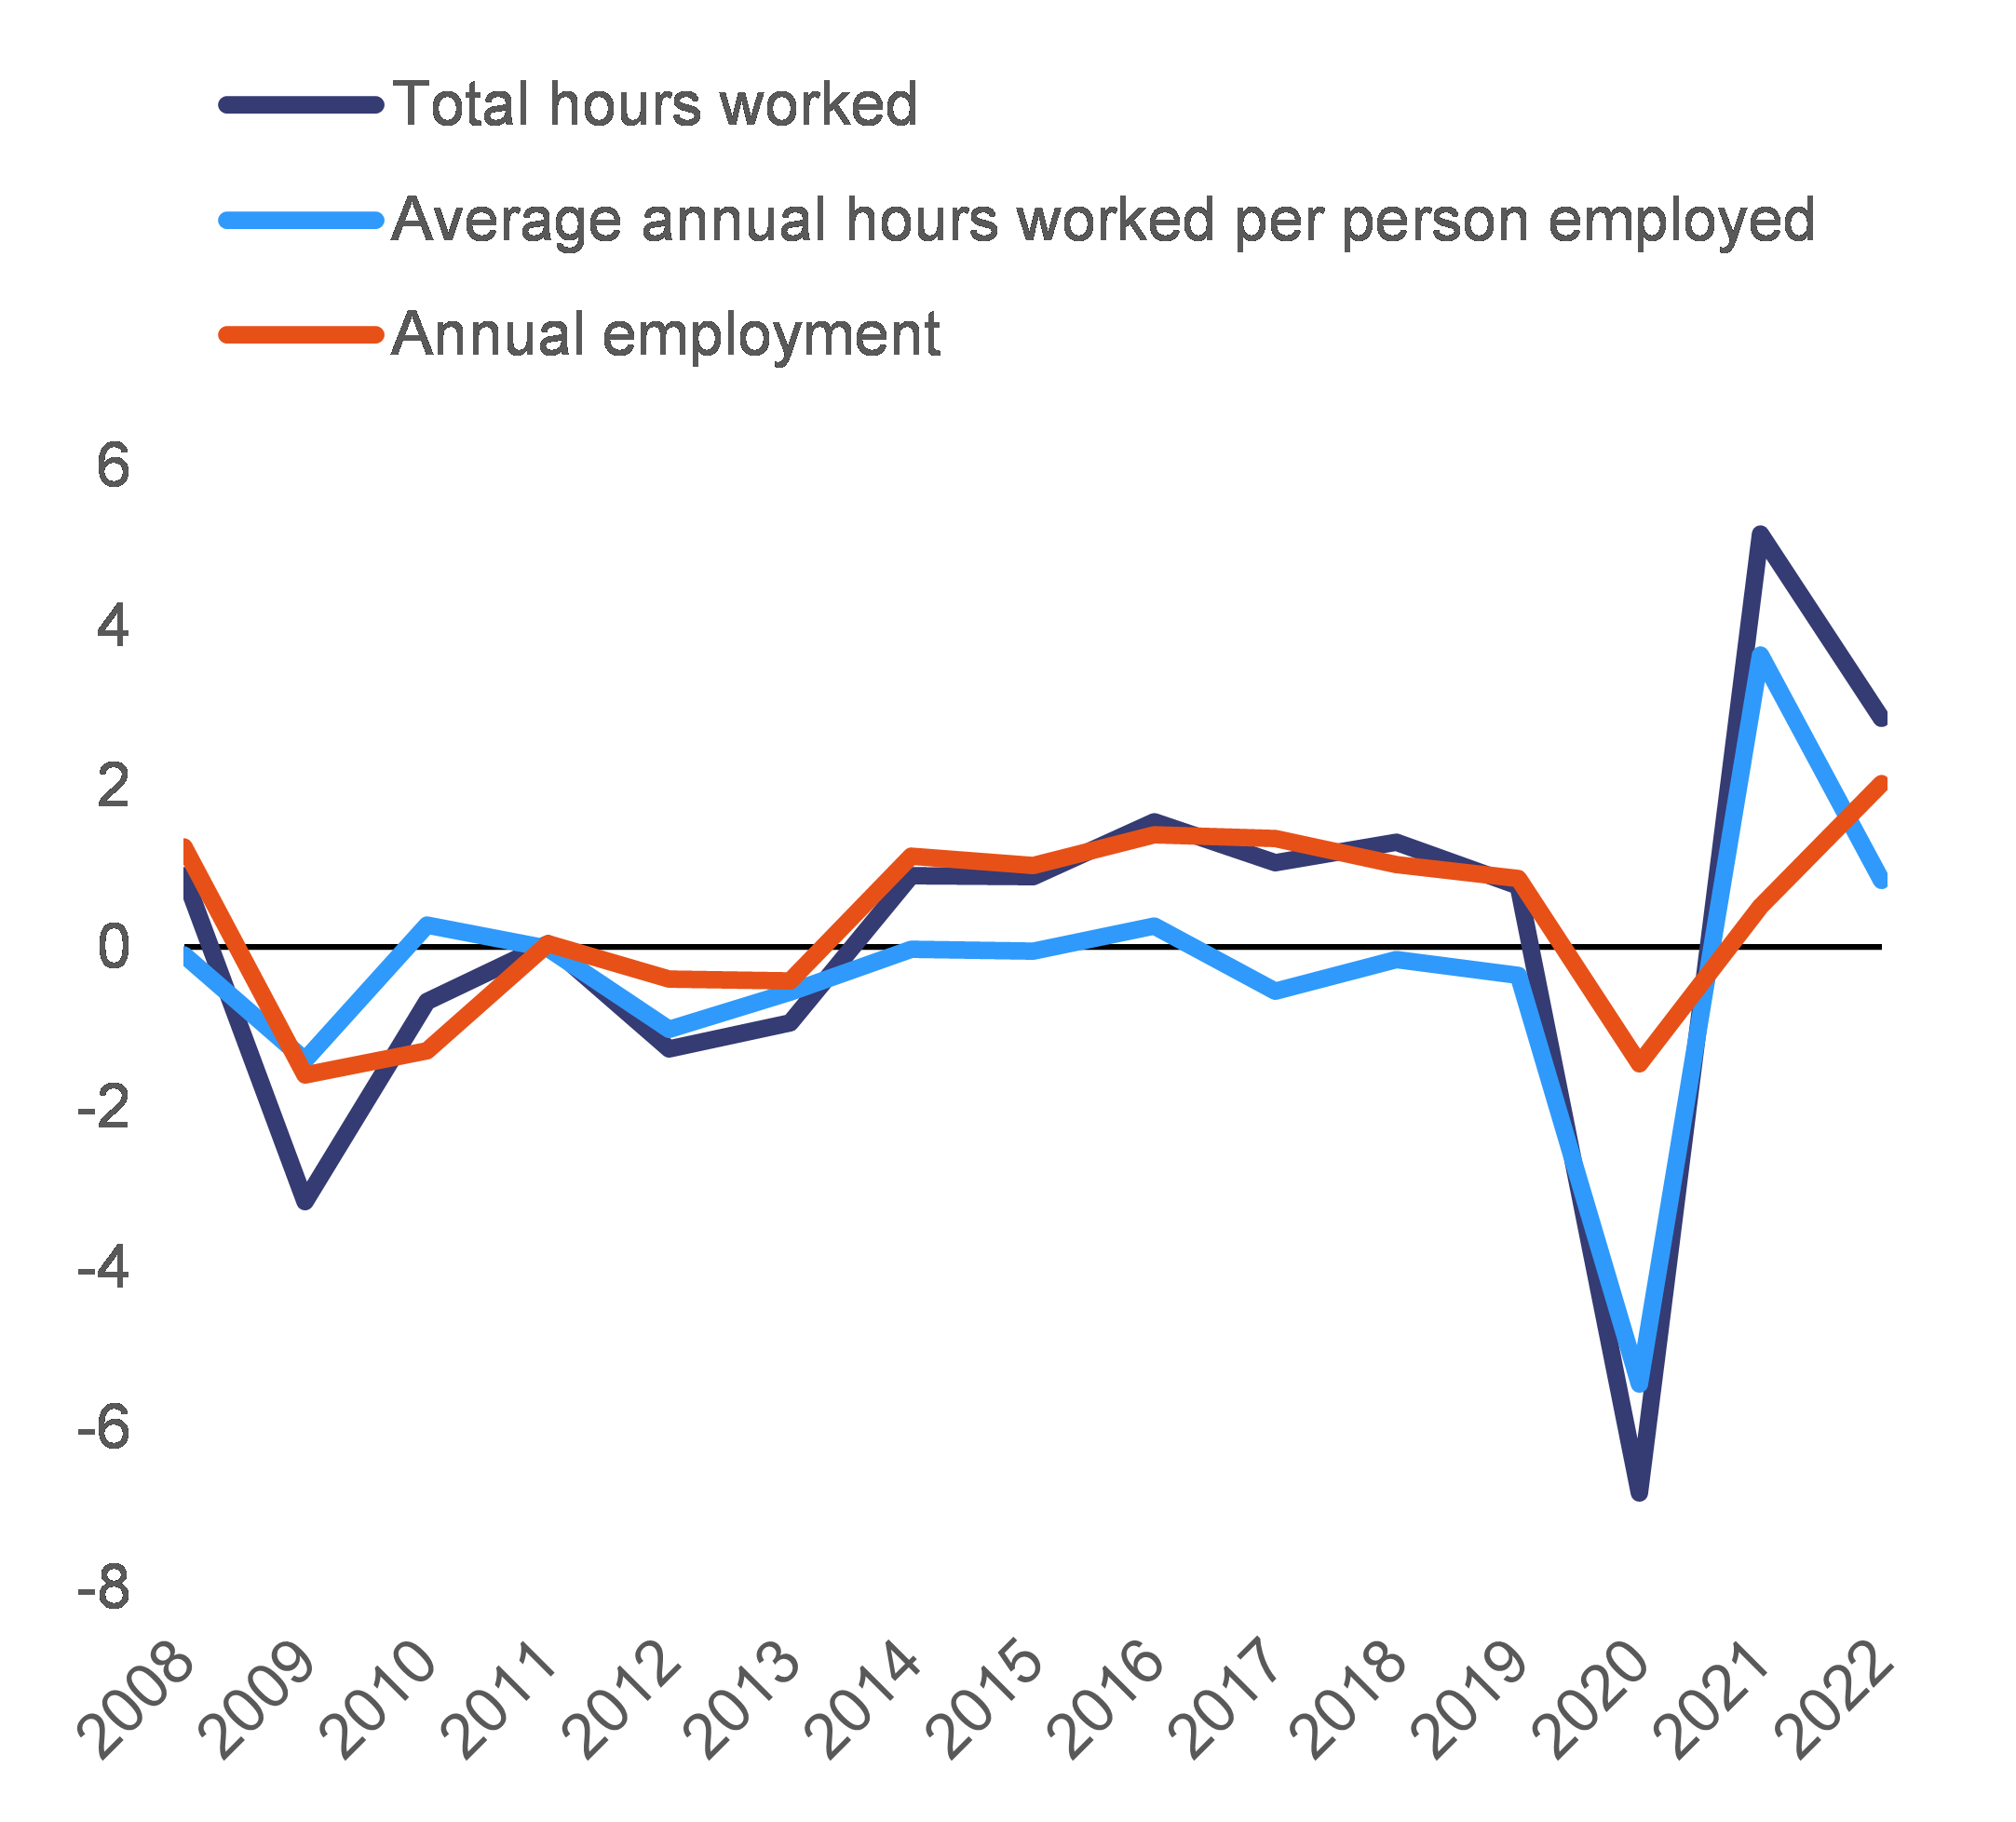
On aggregate, the growth rate of employment and working hours reacted similarly to the business cycle until 2019.In 2020, employment decreased by only 1.5 % while the annual hours worked per worker dropped by 5.5 % from their 2019 level (Graph 3.4). This divergence was driven by the increasing use of short-time work schemes and similar job retention measures in the COVID-19 pandemic.
Graph 3.4: Annual employment, total hours worked and hours worked by person, percentage change over previous year
Additional information about graph 3.4
The chart shows the evolution of total hours worked, average annual hours worked per person employed and annual employment in the European Union from 2008 to 2022. All variables are expressed in percentage change over previous year.
The growth rate of employment and hours worked followed similar trends until 2019, reacting in the same way to the business cycle: it was negative during the financial crisis and the sovereign debt crisis and then it became positive and around 2% each year (this figure refers specifically to the growth rate of annual employment and total hours worked), during the recovery, from the end of 2013 to 2019. In 2020, during the pandemic, employment and hours reacted differently to the shock: employment decreased by 1.5 % while the annual hours worked per worker dropped by 5.5 % from their 2019 level. This divergence is due to the introduction of short-time work schemes and similar job retention measures during the COVID-19 pandemic. The magnitude of the recovery’s impact on employment and hours worked has been as well different: hours worked rebounded considerably to grow almost by 6% in 2021, while employment rebounded more slowly and it restarted to grow (by almost 2%) only in 2022.
Source
AMECO and Eurostat.
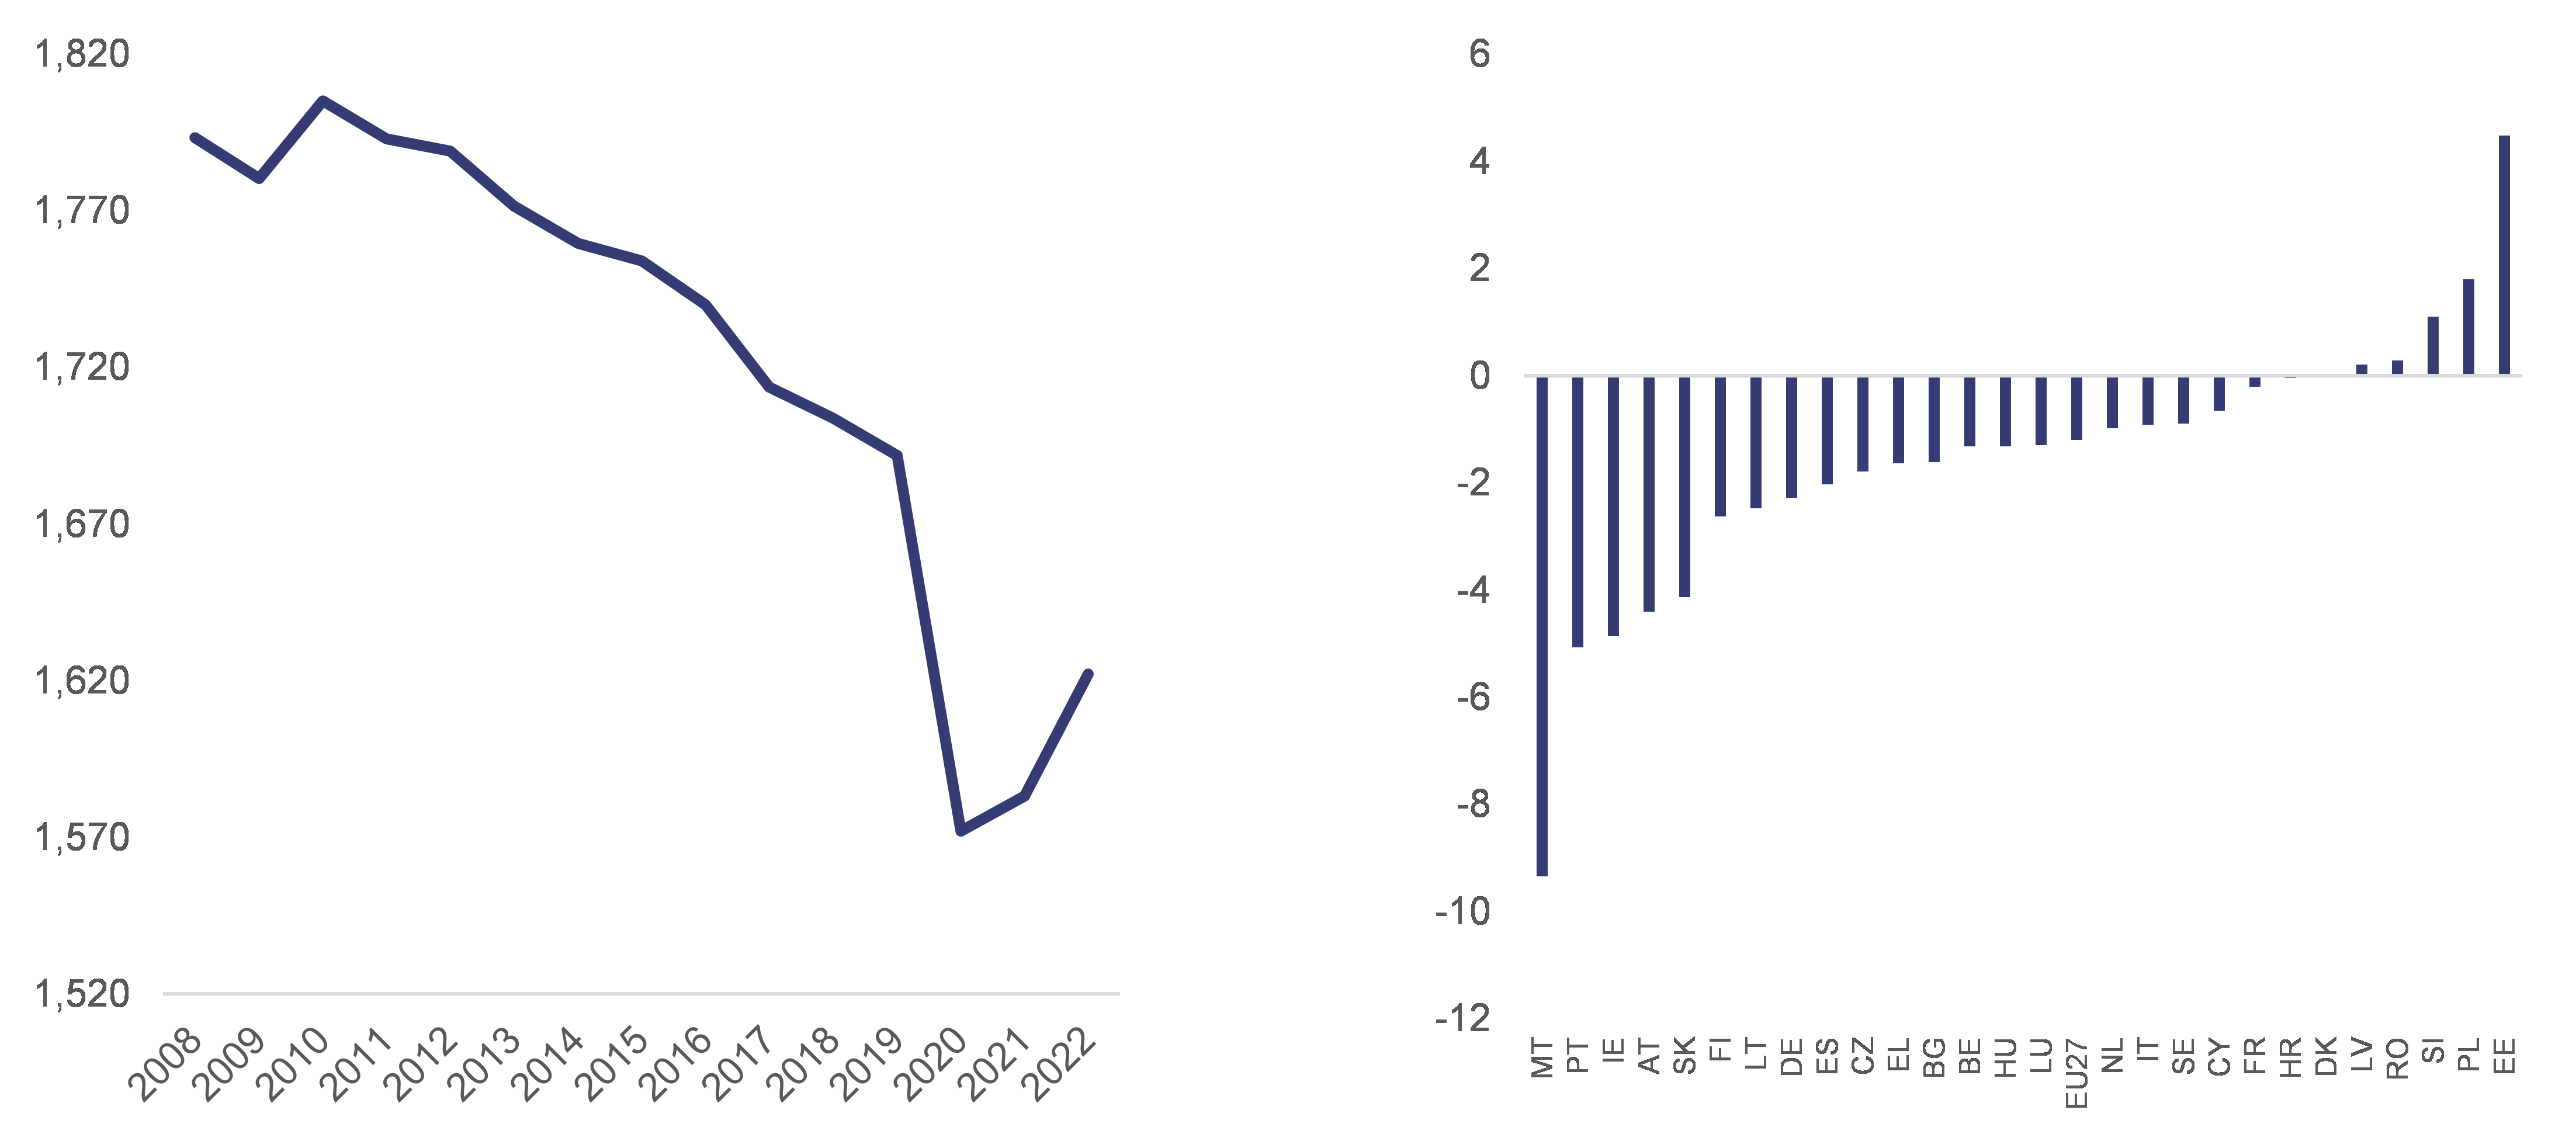
The decline in hours worked per worker tends to accelerate during recessions, and hours tend not to fully revert to pre-crisis levels during recoveries.(see Chapter 1.). During the COVID-19 pandemic, the drop in hours worked was particularly steep across the EU (Graph 3.5 (a)) due to the widespread use of short-time work schemes and similar job-retention measures, which mitigated the drop in unemployment by favouring a reduction in working hours. In most Member States, average annual hours worked per person remained below their 2019 levels in 2023 (Graph 3.5 (b)). It is only in a few EU countries, such as Estonia and Poland, that average hours worked in 2022 were above their 2019 levels (by 4.4 % and 1.8 %, respectively). Hours worked may not revert to their pre-crisis levels due to the introduction of more efficient and productive technologies in the aftermath of recessions. At the same time, during the pandemic, telework became more widespread, and it is associated with longer average weekly working hours across the EU.
Graph 3.5: Average annual hours (a) worked per person employed in the EU and (b) as a percentage change from 2019 to 2022, EU Member States
Additional information about graph 3.5
The chart is made by two panels. The left panel shows the evolution of the average annual hours worked per person employed in the European Union from 2008 to 2022. Average annual hours worked were 1.780 in 2008 and, since then, they have decreased to equal 1.622 in 2022. The long-term decline of hours worked tends to accelerate during crises: indeed, average annual hours worked dropped by 0.7% during the financial crisis and by 7% during the pandemic. The decline was much more marked during the pandemic compared to previous crises because of the introduction of short-time work schemes and similar job-retention measures, which mitigated the drop in unemployment by favouring a reduction in working hours. Finally, this panel also highlights that hours worked do not completely revert to pre-crisis level during recoveries (for instance in 2019 the average annual hours worked in EU were 1.692, while in 2022 they were 1.622). On the latter there is some heterogeneity across Member States: the right panel shows the percentage change of average annual hours worked per person employed between 2019 and 2022 for all Member States. The values are represented in columns and ordered from the lowest to the highest. On the left of the chart there are Malta, Ireland, Austria, and Slovakia, in which the average annual hours worked in 2022 were still lower than the ones worked in 2019, respectively by -9.3%, -5%, -4.8%, -4.3% and -4.1%. On the right of the chart, there are Latvia, Romania, Slovenia, Poland and Estonia, in which the average annual hours worked in 2022 were higher than the ones worked in 2019, respectively by 0.2%, 0.28%, 1%, 1.8% and 4.4%. In the remaining Member States the average hours worked in 2022 were lower than the ones worked in 2019 by less than 3%.
Source
AMECO.
Demographic determinants of hours worked
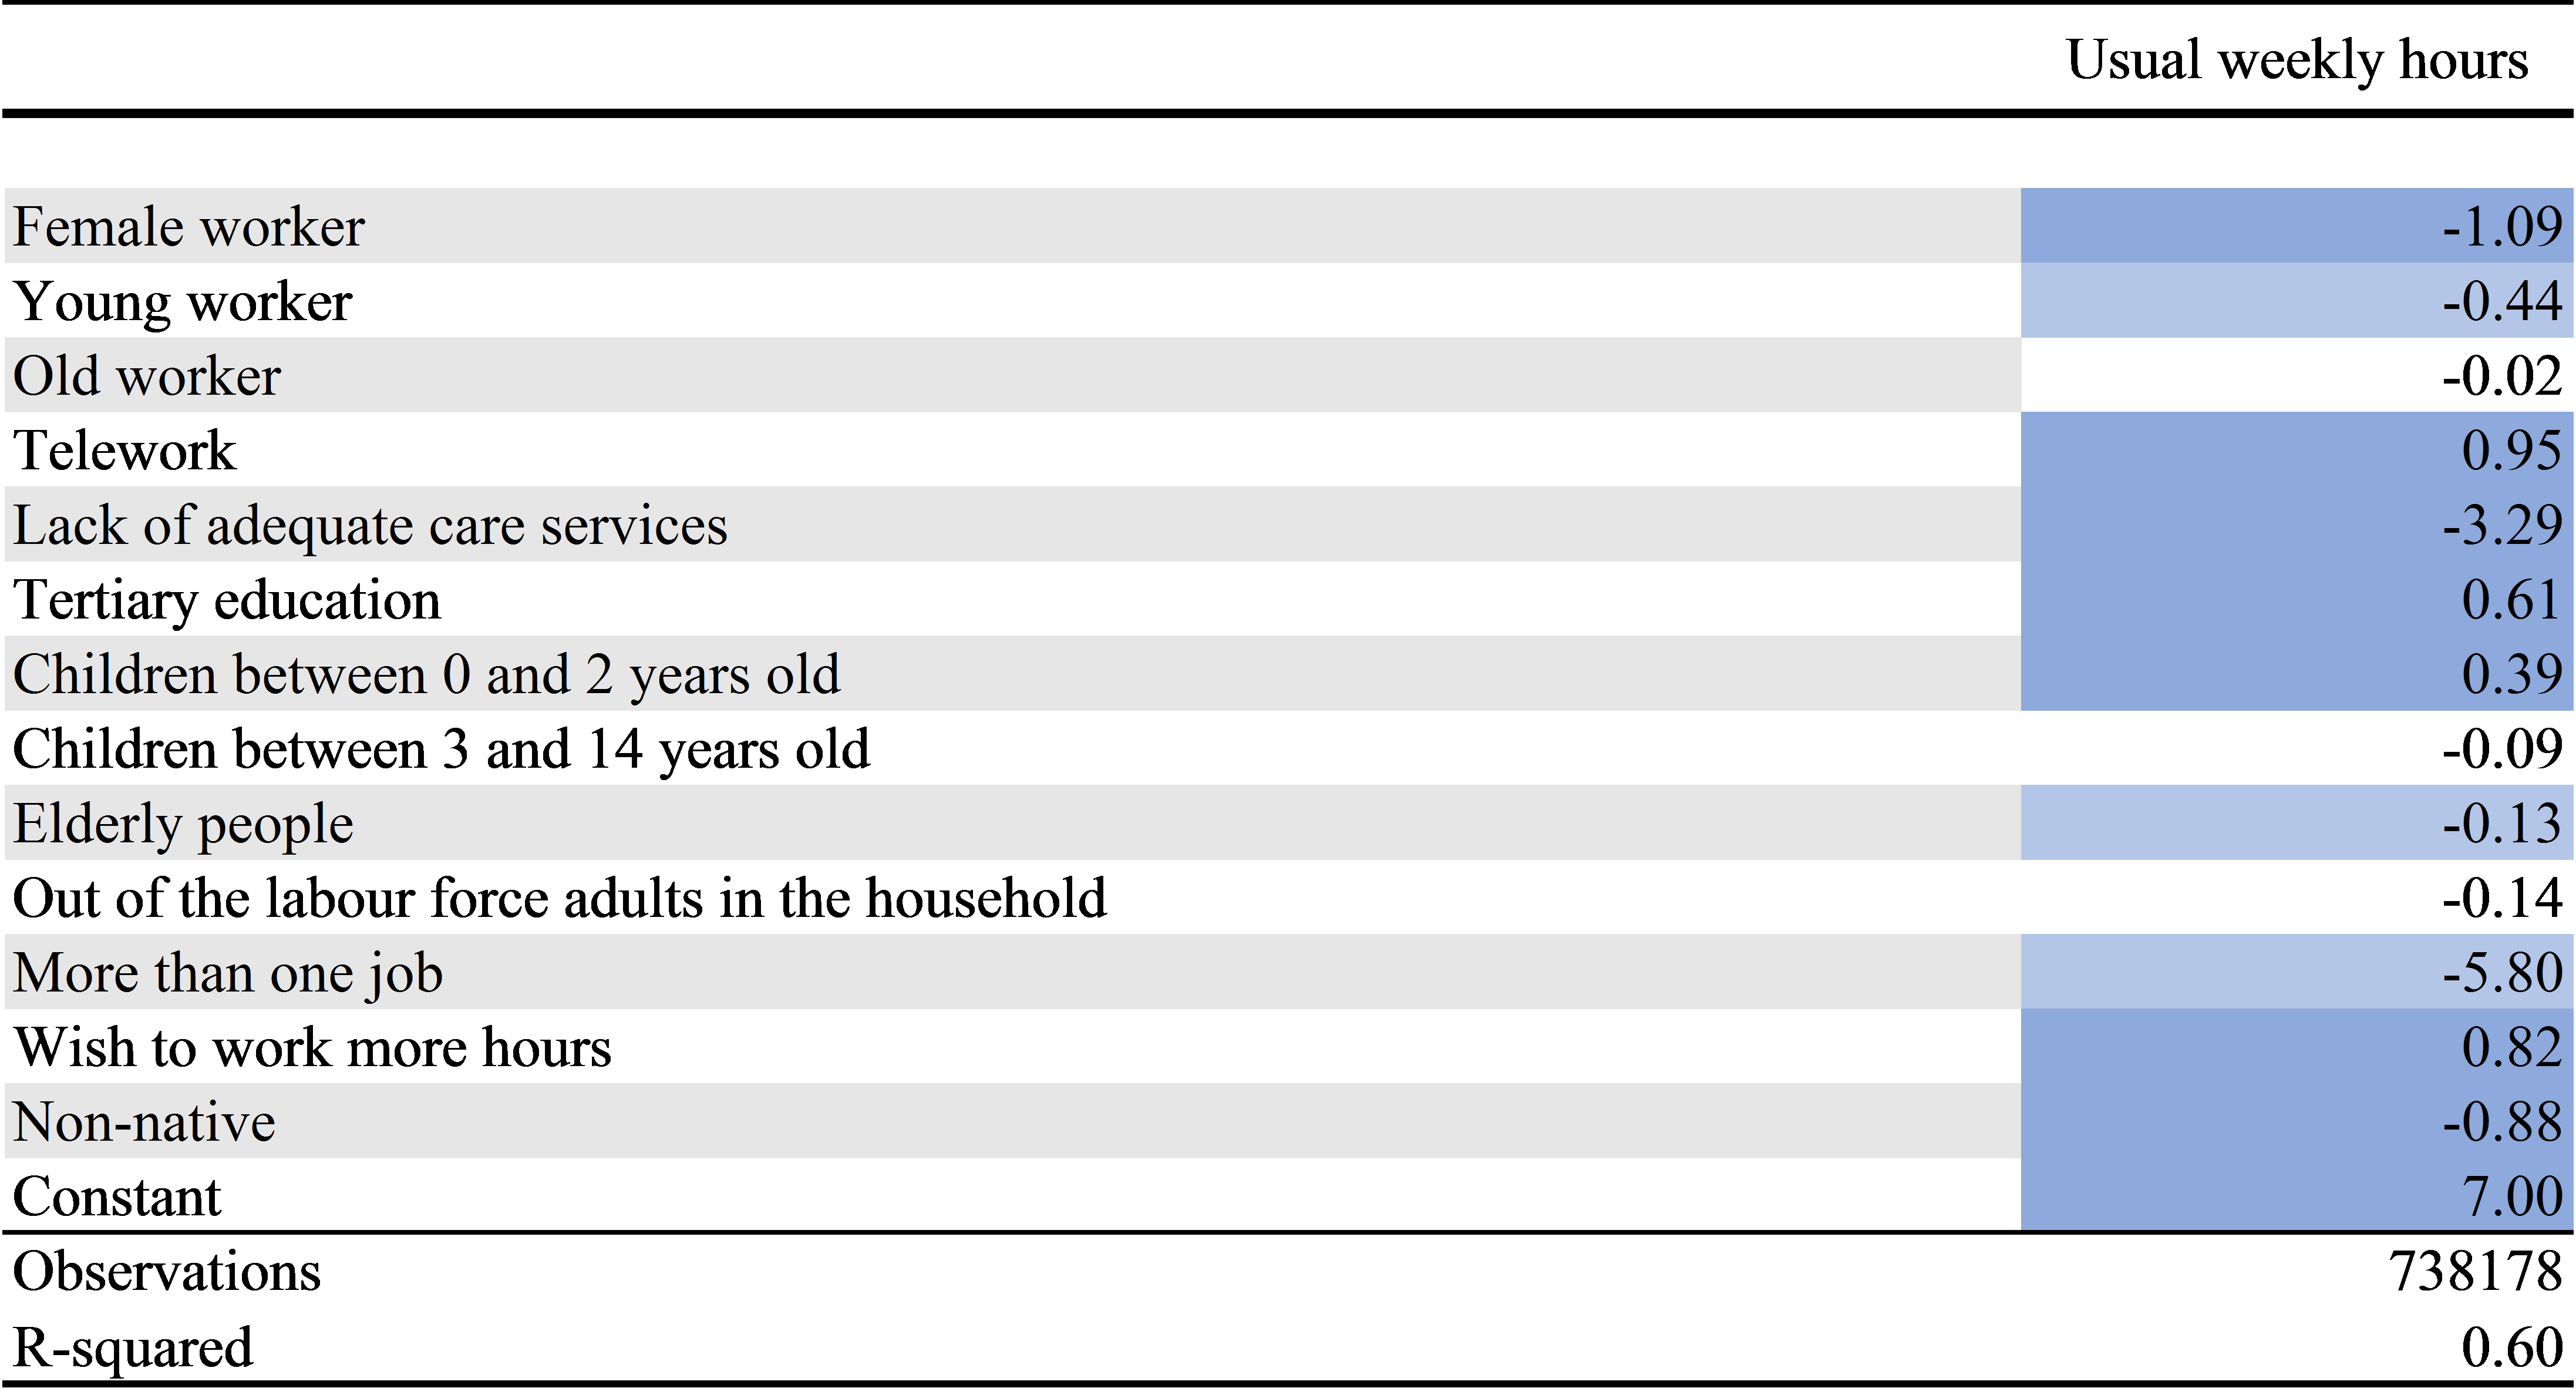
Table 3.1:Determinants of individual decisions on average weekly hours worked in the EU, 2021
Note
Cross-section OLS regression with standard errors clustered by country. Due to missing values, the estimation does not cover Denmark and the Netherlands. Shading reflects statistical significance: light blue = significant at 10 %; blue = significant at 5 %; dark blue = significant at 1 %.
Source
Eurostat, LFS 2021.
The gender gap in hours worked has been gradually narrowing since 2008.Women tend to work shorter full-time weekly hours, but slightly longer part-time weekly hours than men. 29.5 % of employed women worked part-time in 2008-2022, compared with only 8.2 % of men. As a result, women in the EU work on average 34.7 hours, 5.2 hours less than men. Three factors have contributed to the diminishing gender gap in average weekly hours worked experienced since 2008. First, the share of women working part-time has decreased since 2008, leading to a positive composition effect on women's average working hours (Graph 3.8). Second, the decrease in average weekly hours of full-time employees has been greater for men than for women (-3 % and -1.5 %, respectively, between 2008 and 2022). Third, average weekly hours in part-time employment have increased for women, but not for men. However, this convergence applies to employees, not self-employed people: self-employed women still work 7 weekly hours less on average than self-employed men. The gender gap in average weekly hours across Member States is highest in Denmark, Germany, the Netherlands and Austria and lowest in central and eastern European Member States and Greece (Graph 3.6). The gap is likely to be strongly influenced by the cross-country institutional differences such as the availability of part-time work arrangements, the access to quality early childcare and elderly care and taxation policies.
Graph 3.6: Gender gap in average weekly hours of work by Member State (2021)
Additional information about graph 3.6
The chart shows a map of the EU Member States according to the gender gap in average weekly working hours. The group of countries with the largest gender differences (more than 7.2 hours per week difference between male and female working hours) consists of the Netherlands, Germany, Austria and Ireland. This is followed by the countries with a gender difference in working hours of between 5.8 and 7.2 hours per week, consisting of Italy and Belgium. This is followed by countries with a gender working time gap of between 3.7 and 5.8 hours per week, namely France, Spain, Greece, Denmark and Finland. This is followed by countries with a gender working time gap of between 2.4 and 3.7 hours per week, consisting of the Czech Republic, Sweden, Cyprus and Portugal. Countries with a gender working time gap of between 1.2 and 2.4 hours per week are Slovenia, Estonia, Slovakia and Poland. The group of countries with the smallest gender working time gap (less than 1.2 hours per week) consists of Croatia, Lithuania, Latvia, Hungary, Romania and Bulgaria.
Source
Eurostat, EU Labour Force Survey.
Household composition, associated with time spent on informal care, also has an important influence on hours in paid work.People with children aged between 3 and 14 in their household tend to work less (as shown in Table 3.A1.2 in Appendix 1), especially women . Similarly, workers that have to take care of elderly people tend to work less, both at the EU level and in most Member States. Inadequate access to care services for both children and elderly people is an important institutional factor that negatively influences weekly hours worked (as shown in Table 3.1).
Young workers and older workers tend to work fewer weekly hours.The former work shorter hours in full-time jobs and self-employed occupations, in part due to combining work with studying. Moreover, young workers had the largest average decrease in hours worked, even though they already recorded the lowest average hours worked among the age groups. In this age group, the share of part-time workers increased significantly (from 18.8 % in 2002 to 32.7 % in 2022), which contributed significantly to the decline in average weekly working hours over this period (Graph 3.8). The above-50 age group also shows a significant decline in average weekly working hours, mainly due to the reduction in weekly working hours of full-time employees and self-employed people.
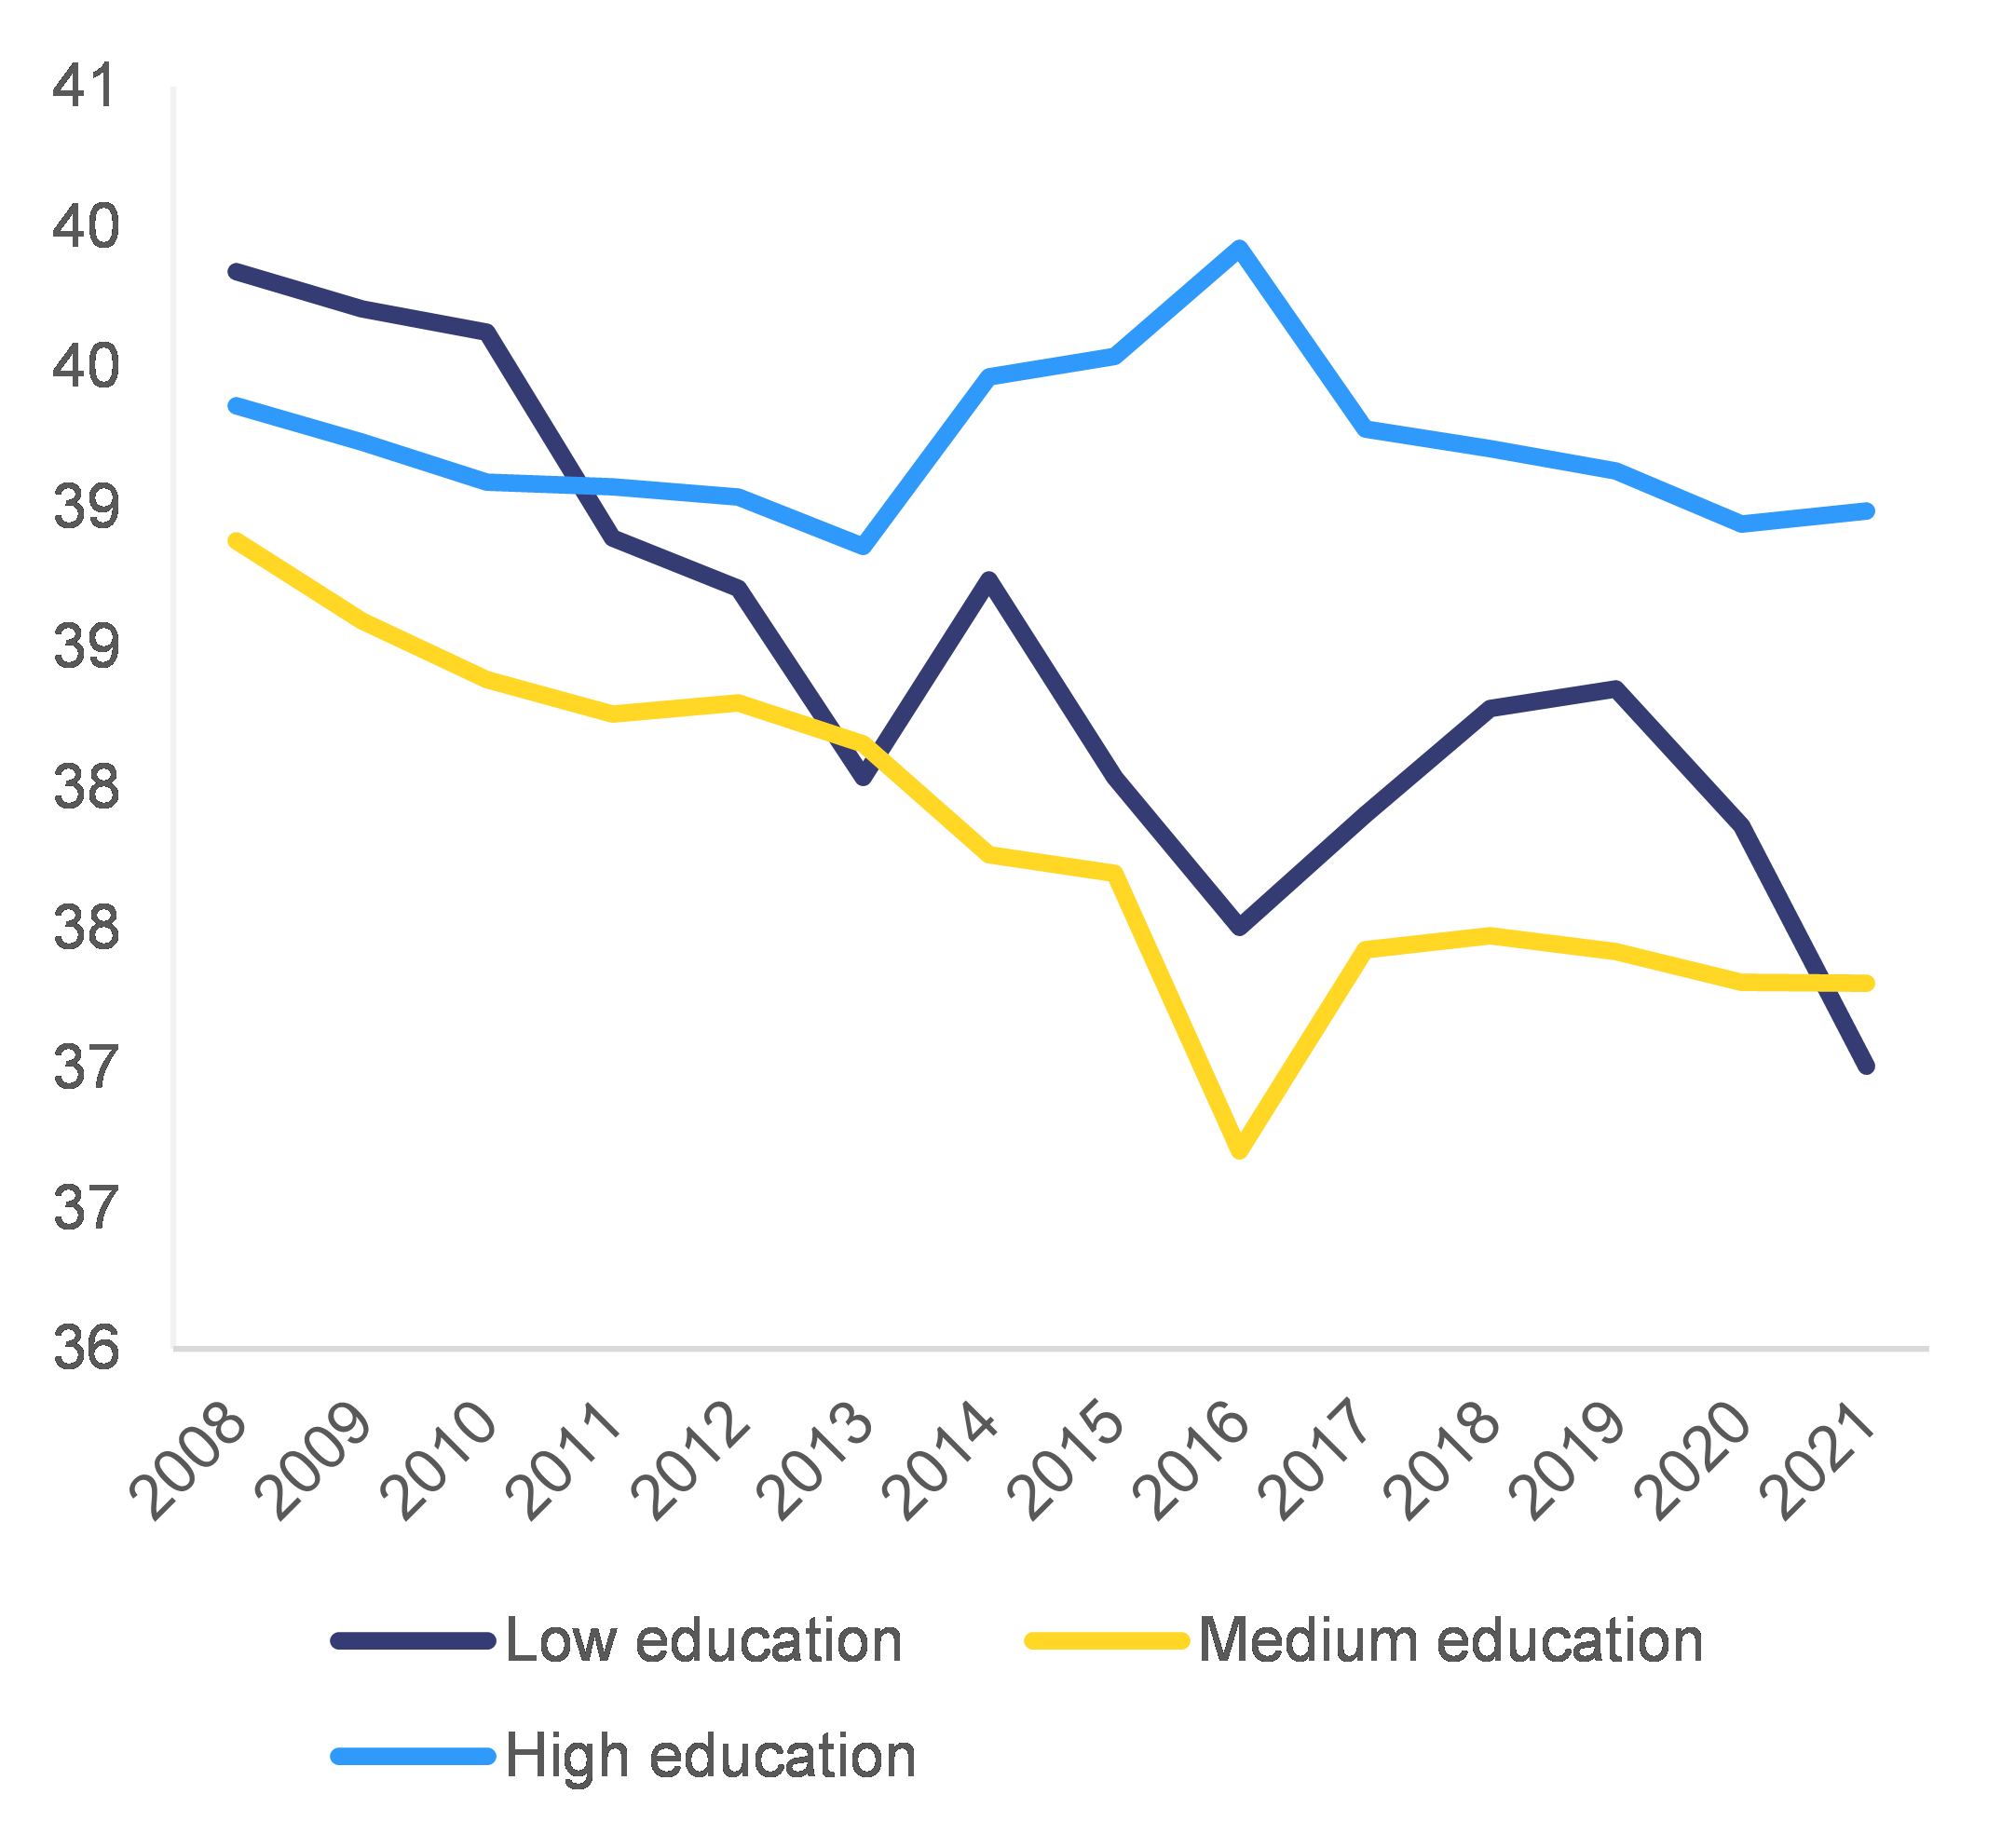
Graph 3.7: Average number of weekly hours of work (main job) by level of education, employed persons in the EU (20-64 years old)
Additional information about graph 3.7
The graph describes the average number of weekly hours by level of education for employed persons in the EU aged between 20 to 64 years. The time frame reaches from 2008 to 2021 and shows the development for three levels of education: low education, medium education and high education. The average number of weekly hours has declined for low and medium education levels. Most remarkable is the decline for the group of persons with low education, which decreased from 40 hours per week in 2008 to 37 hours per week in 2021. The number of hours worked for persons with a medium level of education decreased from 39 hours in 2008 to 37 hours in 2021. The number of hours worked by people with a high level of education was 39 hours in 2008. It increased up to 40 hours per week in 2015 and 2016 and then dropped again to 39 hours per week in 2021.
Source
Eurostat, LFS.
There is a positive correlation between education and working time on aggregate in the EU, which is especially marked for women. Workers with tertiary education worked 4.5 % more hours than workers with secondary and primary education in 2021 (as shown in Graph 3.7) . This finding is in line with the literature (e.g. Gammarano, 2020, Dolton 2017) which observes a similar recent pattern in labour markets globally. Technological change could contribute to this increase in the hours worked by higher educated workers. This finding can be indicative of a higher incidence of overemployment among those with higher levels of qualifications. At the national level, the picture is more mixed: in Belgium, Germany, Ireland, Greece, Spain, France, Italy Hungary, Austria, Slovenia and Finland, tertiary education is positively correlated with hours worked, while in Bulgaria, Czechia, Lithuania, Poland and Romania having attained a tertiary level of education is correlated with a lower number of average weekly hours of work (see Table 3.A1.1 in Appendix 1).
Other individual-level characteristics such as being born in a different country and being a worker who teleworks or who has more than one job are also determinants of average weekly hours worked.The results (Table 3.1) show that teleworking and having a preference for more hours are both associated with longer weekly hours, while having more than one job implies working shorter hours in the main job. Workers with a migrant background work fewer hours than native workers, both on aggregate in the EU and in Germany, Estonia, France, Italy, Austria Portugal, Romania and Finland.
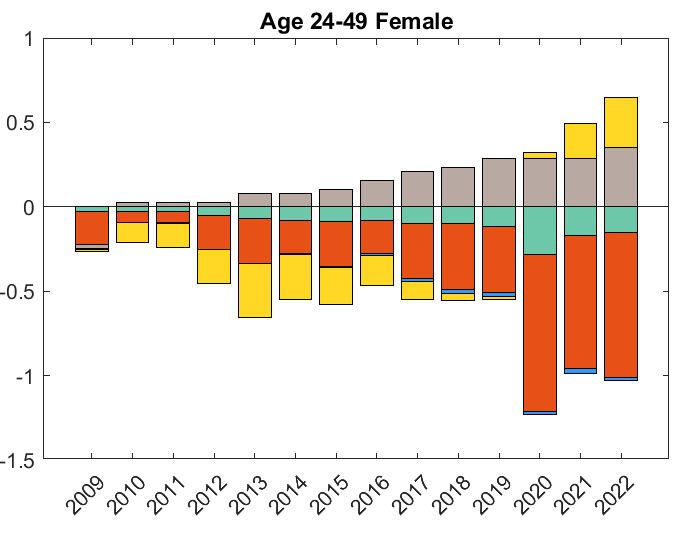
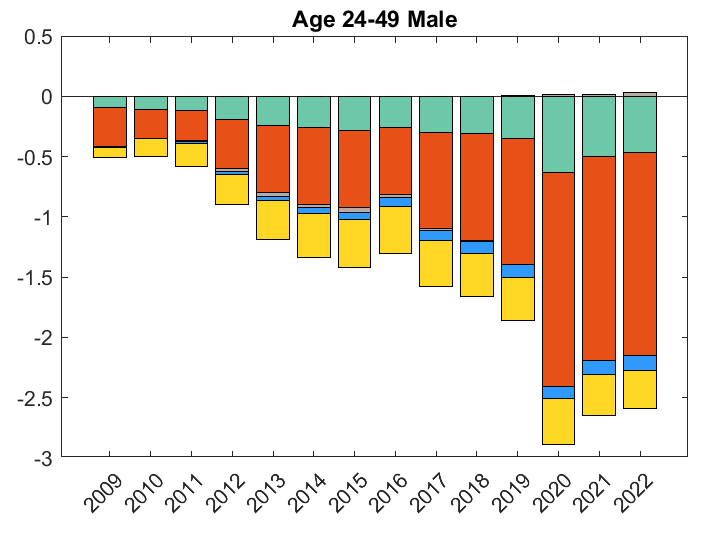
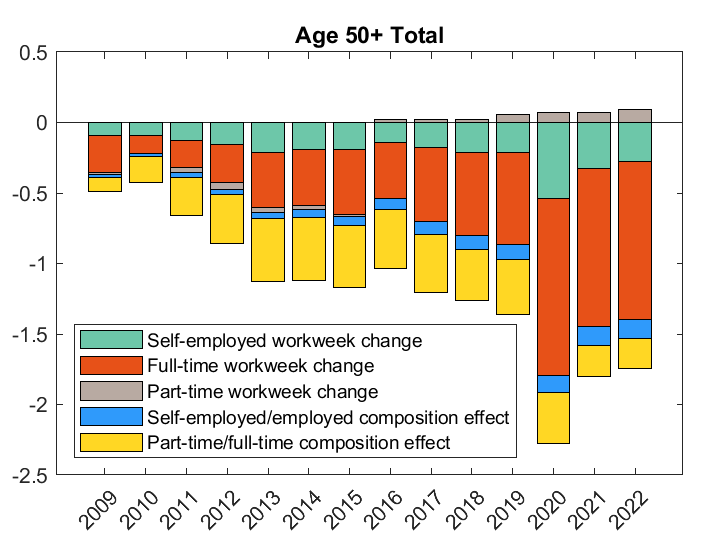
Graph 3.8: EU working week, working time changes broken down by age group and gender

Additional information about graph 3.8
The graph consists of 4 subgraphs. All graphs show the cumulative changes in weekly working hours between 2008-2022, broken down by the following main factors: changes in average full-time working hours, changes in average part-time working hours and changes in the composition between part-time and full-time.
The first chart shows the female age group between 25 and 49. For this demographic group, the decrease in average full-time hours is the main factor in the decrease in average weekly hours, with both changes in composition and part-time work contributing to an increase in average weekly hours.
The second chart shows the male age group between 25 and 49. For this demographic group, the cumulative decrease in average working hours is greater than for women of the same age (2.5 hours versus 0.6 hours), with all factors contributing to this decrease, most notably the decrease in average weekly hours worked full-time.
The third chart shows the entire age group between 15 and 24. This group shows an above-average cumulative decrease in average hours worked (3.5 hours). Specific to this demographic group is the predominant role of the changing composition of part-time and full-time employment in this decline, which is related to the increasing part-time employment of younger workers.
The fourth chart shows employees over the age of 50. For this demographic group, the cumulative decline in average working hours is lower than for the other age groups (1.7 hours per week), with all factors contributing to this decline, of which the decline in average full-time working hours is the most important.
Note
The age and gender groups with the highest variability in the data are shown. The gender division exhibits less variability in the 15-24 and 50+ age groups. The country level results are presented in Appendix 4 for each age group and gender. See Appendix 4 for the methodology of the decomposition.
Source
Own calculations based on Eurostat EU Labour Force Survey.
Working time preferences
On average, workers prefer a reduction in working hours, and the preferred reduction in working hours increased significantly after the COVID-19 pandemic.The average weekly preferred reduction increased from 2.2 working hours in 2015 to 5.5 in 2021. Overall, this rate is higher for men, who favoured a reduction in weekly hours of 2.9 and 6.3 hours in 2015 and 2021, respectively. At the same time, for women, the preferred reduction of weekly hours has been 1.3 and 4.5 hours in 2015 and 2021.
Better educated and better-off households would prefer to work fewer hours.The preferred number of hours decreases with the level of education and with household financial wealth (Graph 3.9 and Table 3.2). This preference became more marked from 2015 to 2021. Such changes in preferences might be attributable to the changes in work organisation that occurred during the COVID-19 pandemic, which were more pronounced for more educated workers. The discrepancy between actual and preferred hours can signal overemployment for both groups. On the other hand, households that have substantial difficulties in making ends meet are more likely to work longer hours per week and express a lower-than-average preference for a reduction in working hours.
However, there are also groups of workers who are underemployed and would prefer to work longer hours.The share of part-time workers who would prefer to work longer hours has been increasing recently, from 32.7 % of all part-time workers in the EU in 2015 to 38.8 % in 2021. At the same time, the share of workers that reported inability to find full-time job as the main reason for part-time work has been decreasing, from 31.6 % in 2015 to 23.3 % in 2021 . Among workers in involuntary part-time work, women are overrepresented. In 2021, among all workers in the EU that were involuntarily employed in part-time, 66 % were women. Besides the involuntary part-time workers, people who are unemployed, and people who would be available to work but are not actively seeking work can also be considered to be underemployed.
Graph 3.9: Preferred decrease in working hours by (a) education level and (b) difficulty of making financial ends meet
Additional information about graph 3.9
This figure consists of two panels.
The first shows the preferred decrease in weekly working hours by education level in 2015 and 2021. In 2015, the preferred decrease in weekly working hours is lower on average compared to 2021. Workers with primary and tertiary education have a higher-than-average preference for a reduction in weekly working hours, while those with secondary education have the preference for only a modest reduction. The pattern changes significantly in 2021. The average preferred reduction in working hours more than doubles and shows a linear pattern with respect to education level, with highly educated workers preferring a greater reduction in working hours and workers with primary education preferring only a small reduction.
The second panel shows the preferred reduction in weekly working hours by household financial wealth. While all household categories on average prefer a reduction in working hours, households with the greatest financial difficulties prefer a smaller reduction, while households without financial difficulties prefer a larger reduction in working hours.
Source
Eurofound, European Working Conditions Survey 2015 and European Working Conditions Telephone Survey 2021.
Table 3.2: The determinants of working hours: propensity score matching
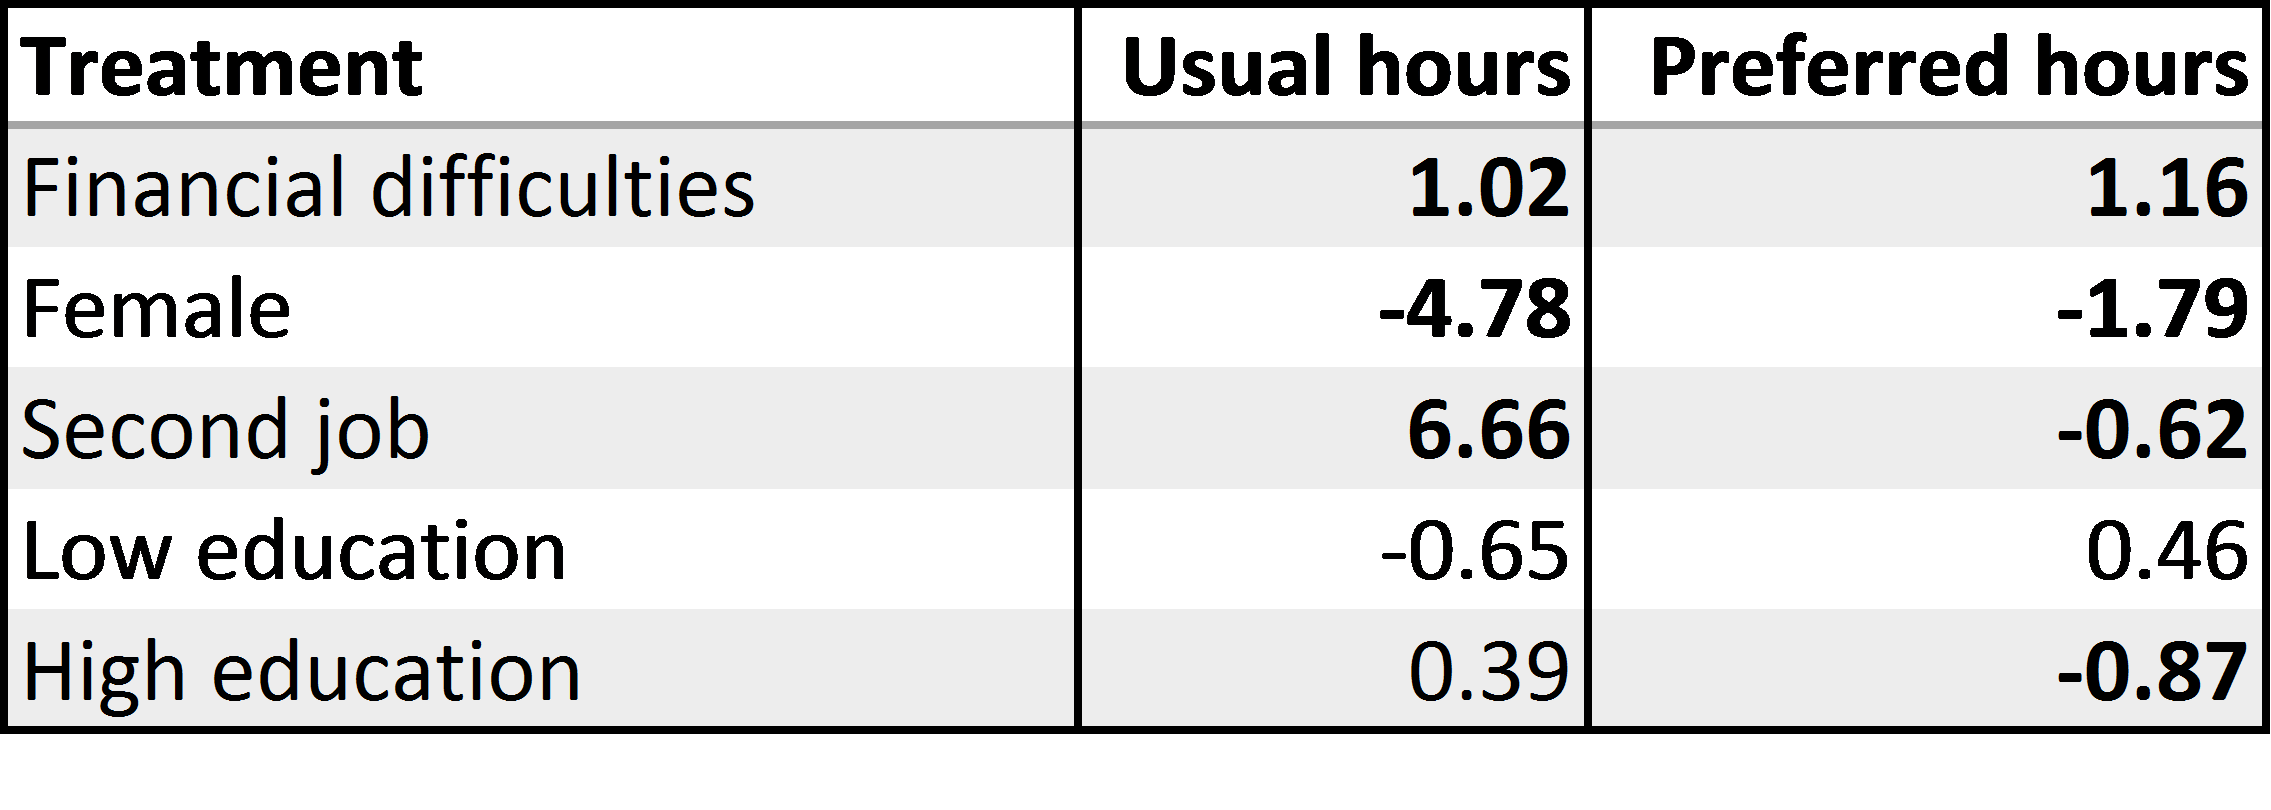
Note
Bold indicates values are statistically significant at the 95% confidence level.
See Appendix 5 for the description of the methodology.
Source
Eurofound, European Working Conditions Telephone Survey 2021.
Both actual and preferred working hours vary considerably by occupational group.The lowest total number of hours worked are characteristic of elementary occupations, sales and office workers, while managers, agricultural workers, craftsmen, plant and machine operators and assemblers work the highest average number of hours. According to our analysis, managers, professionals, technicians and agricultural workers were also among those groups indicating a preference for the highest reduction in weekly working hours, while elementary occupations and non-professional service workers preferred a lower reduction in working hours (if any at all).
Overemployment has a distinct geographical pattern as it is more prevalent in the countries with longer weekly working hours.It affects workers of central and eastern European Member States, although it is less common in the Baltic countries and Romania, and the prevalence of overemployment is low in Romania and Slovakia. Among southern EU Member States, Portugal is most affected. Among Member States with higher levels of GDP per capita, overemployment is more frequently reported by workers in Ireland.
Job quality and working time
Working time is an important component of job quality.Over a certain threshold, long working hours contribute to negative elements of job quality such as physical and mental job strain, overtime and sick leave taken (see Graph 3.10) . At the same time, short hours may not always lead to higher job satisfaction or better outcomes, as people in full-time jobs may be more fully engaged and enjoy more ownership of their tasks, benefit more from in-work collegiality and amenities such as trainings, and have better career prospects than workers in part-time employment.
Graph 3.10: Job quality and working hours
Additional information about graph 3.10
The chart is made by 11 columns, one for each of the 11 identified range of possible hours worked in a week. The values of hours worked go from 0 to 108 and are divided in ranges including 12 values at the two ends of the distribution and 6 values in the central groups of the distribution. Each column is divided in six areas marked with different colours that represent the share of respondents that gave a certain answer on their job quality among the following ones: “extreme strain”, “high strain”, “moderate strain”, “low resourced”, “moderately resourced” and “highly resourced”. The ranges of hours worked are on the x-axis, while the shares are on the y-axis. The chart shows that the size of areas such as “extreme strain”, “high strain”, “moderate strain” and “low resourced” is bigger within the columns corresponding to more hours worked, that is, more respondents among those that work more hours reported higher strain. For instance, among the workers that worked between 96 and 108 hours per week in 2021, almost 30% reported extreme or high strain, while among the workers that worked up to 36 hours per week this share was around 10%.
Source
Eurofound, EWCTS 2021.
Overtime affects certain categories of workers to a greater extent.Overtime is found to be more prevalent among women, older workers and those who have tertiary education. At the same time, workers that work in the evening and on Saturdays, those who telework, those who have more than one job, those who have an inactive adult in the household, and workers who are non-native do less overtime (see Table 3.A1.4 in Appendix 1). However, the prevalence of overtime in teleworking and in non-regular work arrangements may be underestimated due to inaccurate recording of working time on the job. This constrains the impact of overtime regulations in the above-mentioned employment relations.
Young workers and people preferring long hours are more likely to work unsocial hours.Young workers, people who work long hours and people who have more than one job are more likely to work outside regular working hours. People with longer hours are also more likely to be in shift work. On the other hand, teleworkers, are less likely to work at night and on weekends or to do shift work while they are more likely to do work in the evenings (Tables 3.A1.3 and 3.A1.4 in Appendix 1).
These findings highlight a trade-off for working time policies to improve job quality.The health and wellbeing of the groups of workers who tend to do more overtime or work during unusual hours, such as women, young and older workers, should be protected and enhanced through adequate policies. However, regulations on working time may also create barriers for people who are willing to work longer hours.
Institutional determinants of hours worked
Cross-country differences in hours worked are influenced by institutional characteristics.These include the level of development of a country, the tax system and labour market policies, regulations and institutions (Alesina et al., 2005; Altonji and Oldham, 2003; Bowles and Park, 2005; Causa, 2009; Faggio and Nickell, 2007). To explain developments in working time between 2008 and 2021 across a large group of EU Member States, the analysis looks at the influence of per capita GDP, the average and marginal tax wedge, unionisation, collective bargaining and childcare services .
- Member States where there are above average difficulties in accessing adequate care services for children and elderly people are characterised by lower average weekly hours worked. This is especially the case for female workers. This finding is explained by the fact that, in these countries, adults, especially women, have to devote more hours to the care of children and elderly people than in countries with more developed care services.
- An increase in trade union density or in collective bargaining coverage is associated with lower average weekly hours. This finding is in line with the literature and can be interpreted as an outcome of a historical process. When faced with sectoral shocks, unions may have preferred adjustments to hours over increases in unemployment (Alesina et al., 2005). Moreover, unions may also have requested lower hours in response to increasing marginal tax rates, or to the increasing income level of their members who demanded more leisure time (Alesina et al. 2,005; Blanchard, 2004; Prescott, 2004).
- While workers in richer countries tend to work fewer hours, the analysis shows that GDP per capitaand hours worked tended to react similarly to the business cycle over the period analysed.
- The analysis does not find a significant relationship between the tax wedge (average or marginal) and hours worked at the aggregate level .
Policies to improve the adequacy of care services can increase the hours worked by women and workers’ wellbeing.The results suggest that more accessible and affordable care services for children and elderly people allow adults, especially women, to work more hours, which, in turn, would contribute to closing the gender gap in hours worked.
Policies to increase collective bargaining coverage are also essential to safeguard employment and enhance workers’ wellbeing.During periods of economic shock, collective agreements can contribute to preserving employment, including potentially through working time reduction, preserving skills and facilitating a rapid economic rebound. Similarly, during structural transformations of the economy, such as the green and digital transitions, collective agreements can help to safeguard employment and promote the necessary upskilling and reskilling of the labour force. Depending on the bargaining strategies of social partners, the structure of the labour market and the nature of collective bargaining institutions, there is potential for collective bargaining to take into account the broader economic implications of working time reduction on wages, employment and productivity, while representing the interests of workers.