Appendix 1
Additional graphs and tables
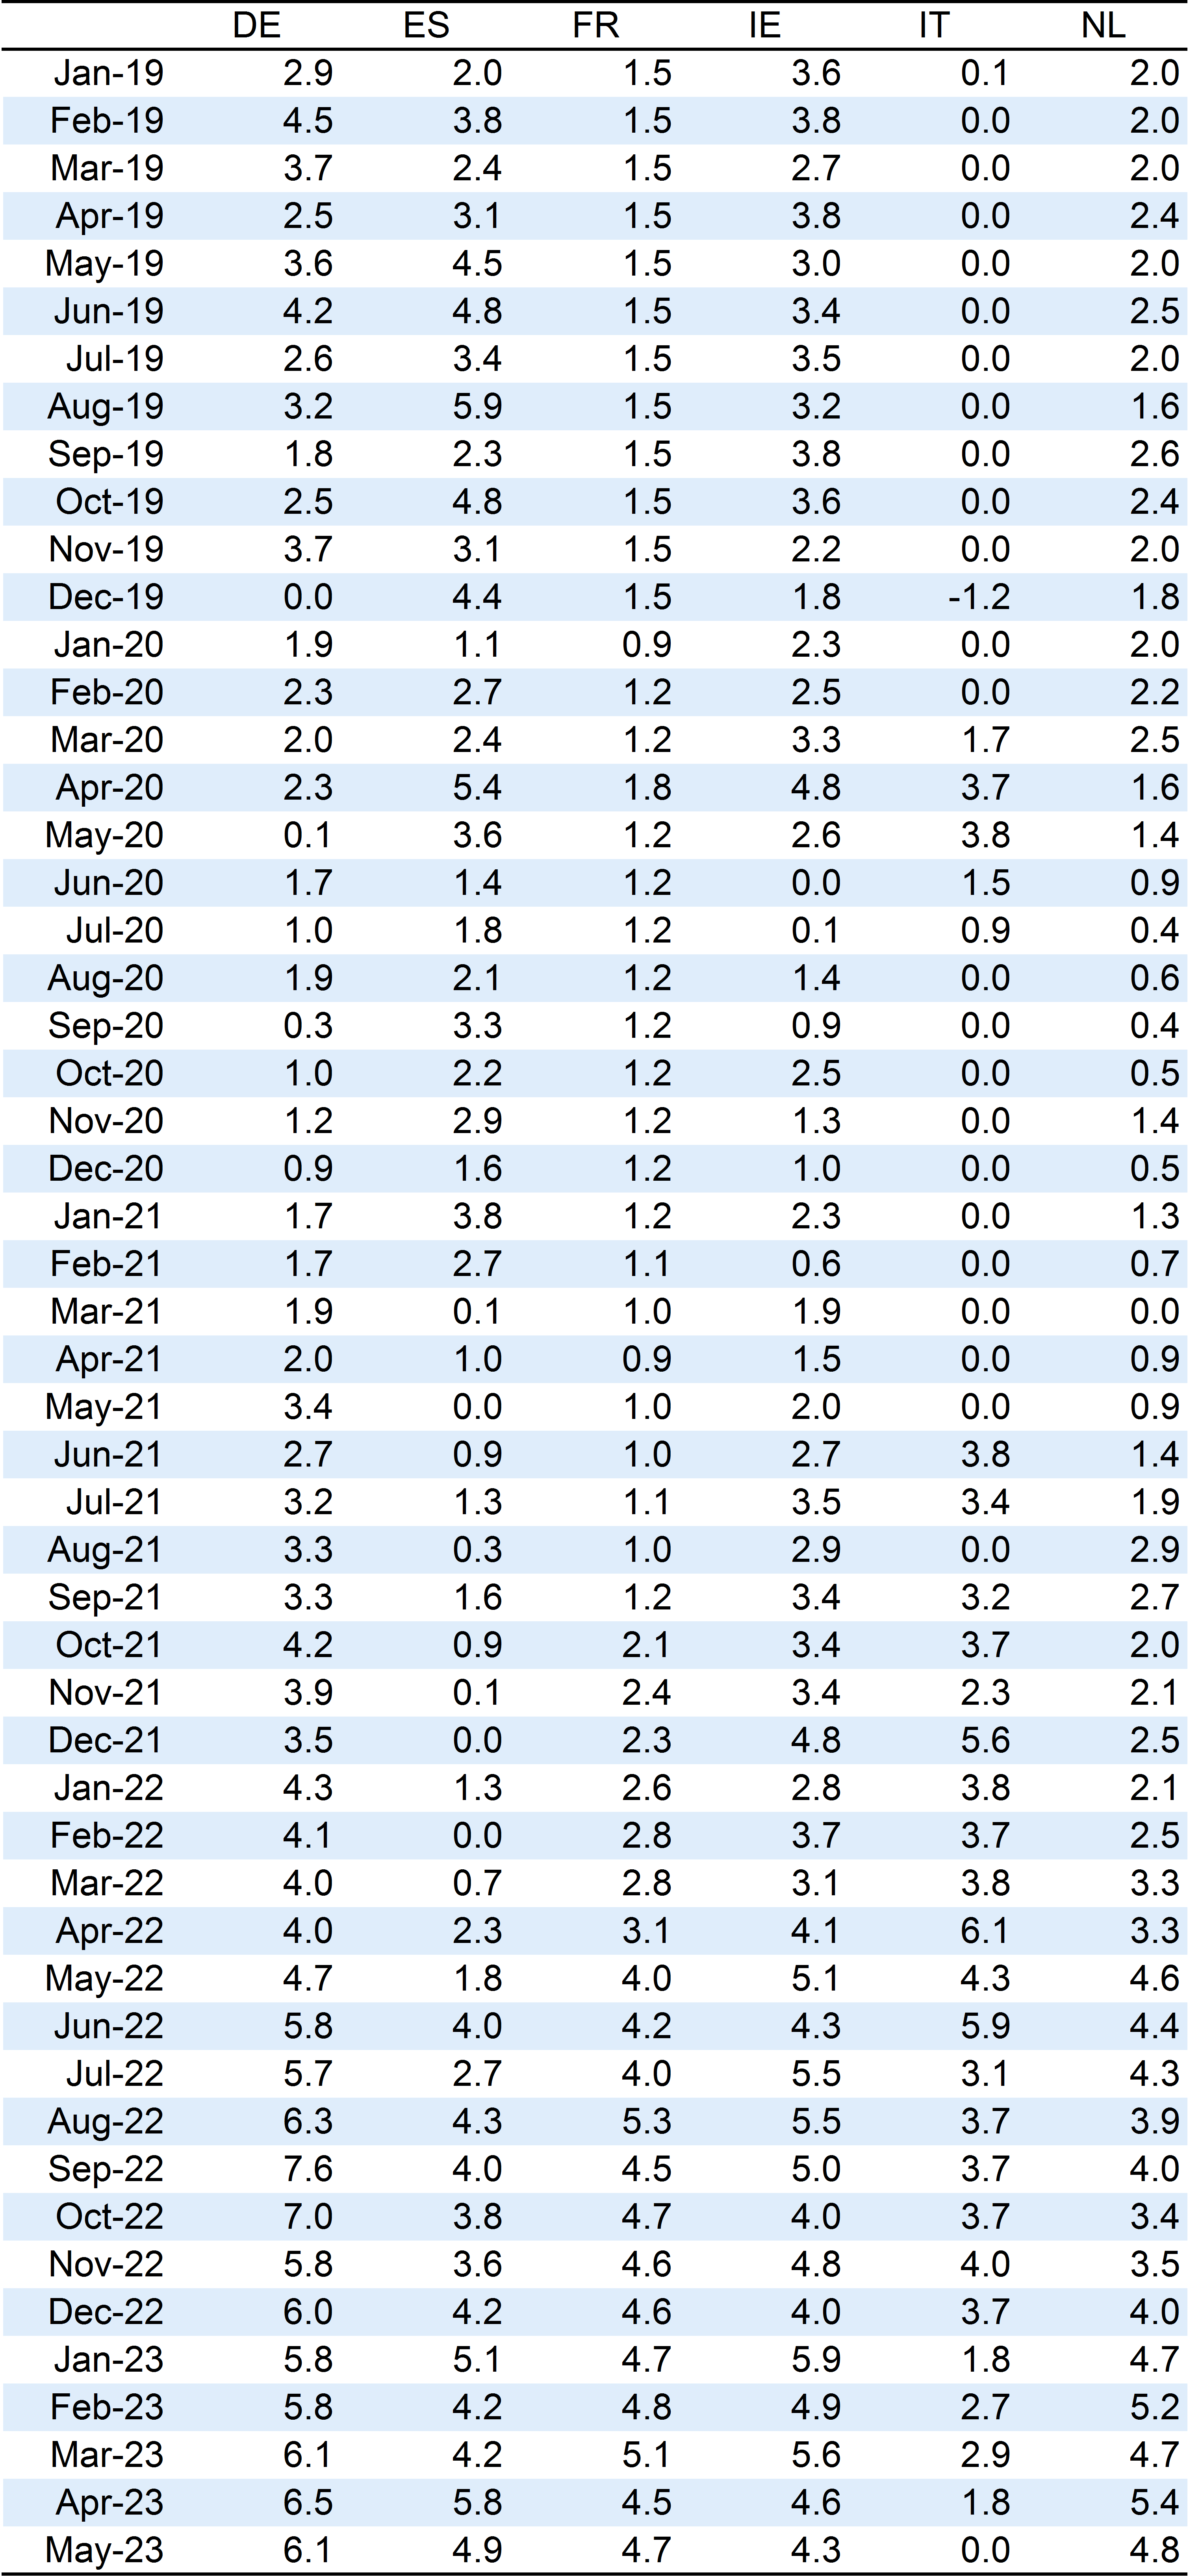
Table 2.A1.1: Average year-on-year percentage changes in wages and salaries advertised in job postings on Indeed
Source
Indeed Hiring Lab
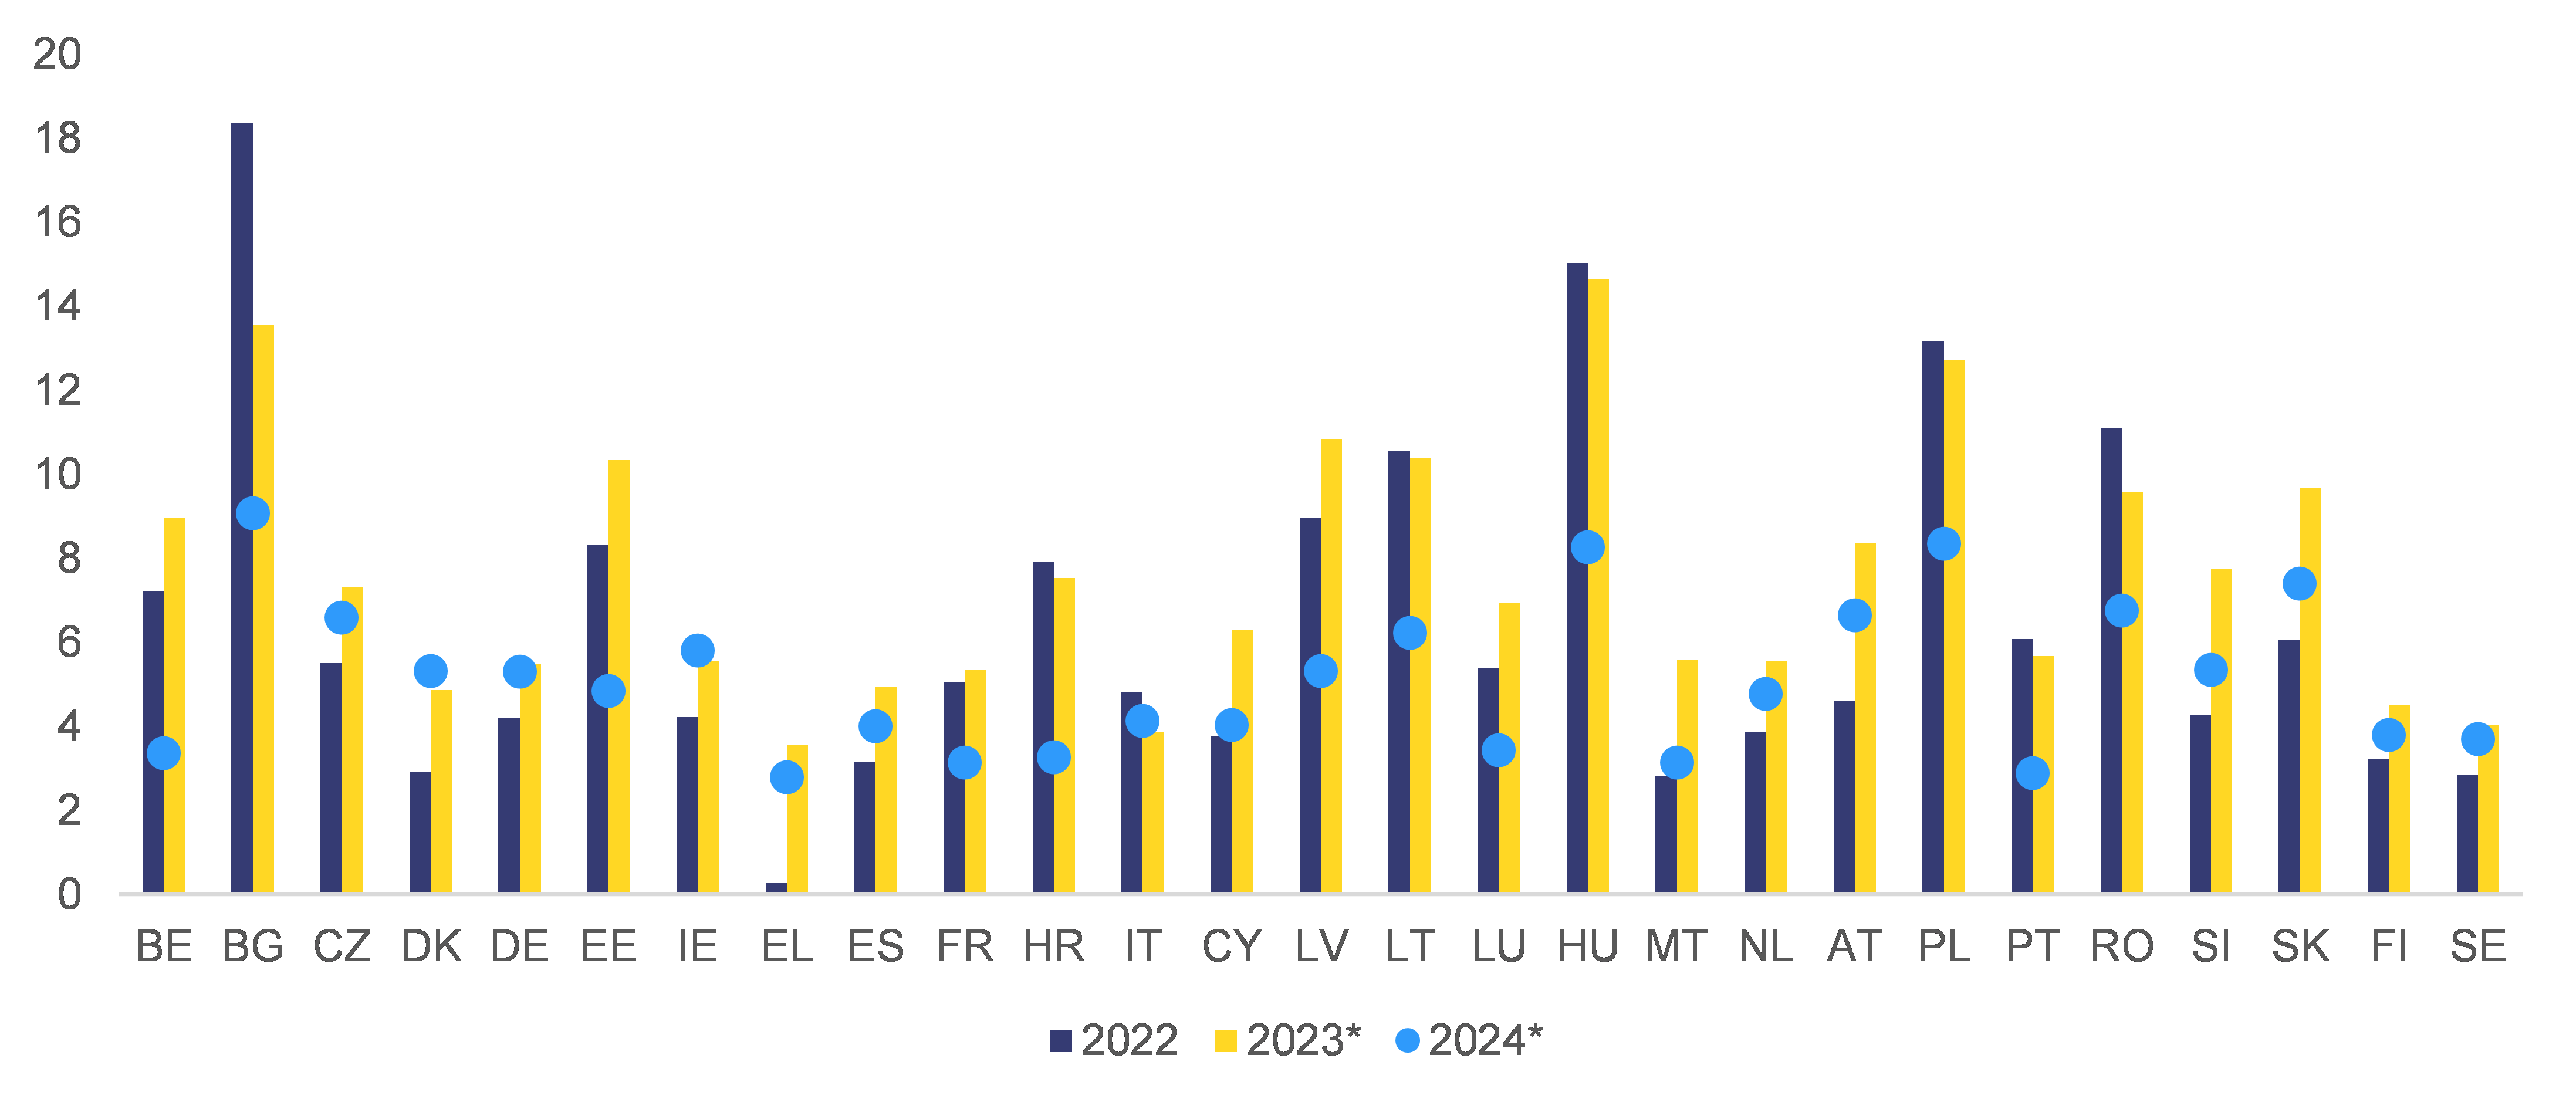
Graph 2.A1.1: Nominal compensation per employee by EU Member State (2022-2024)
Source
Ameco [5 0 0 0 HWCDW]
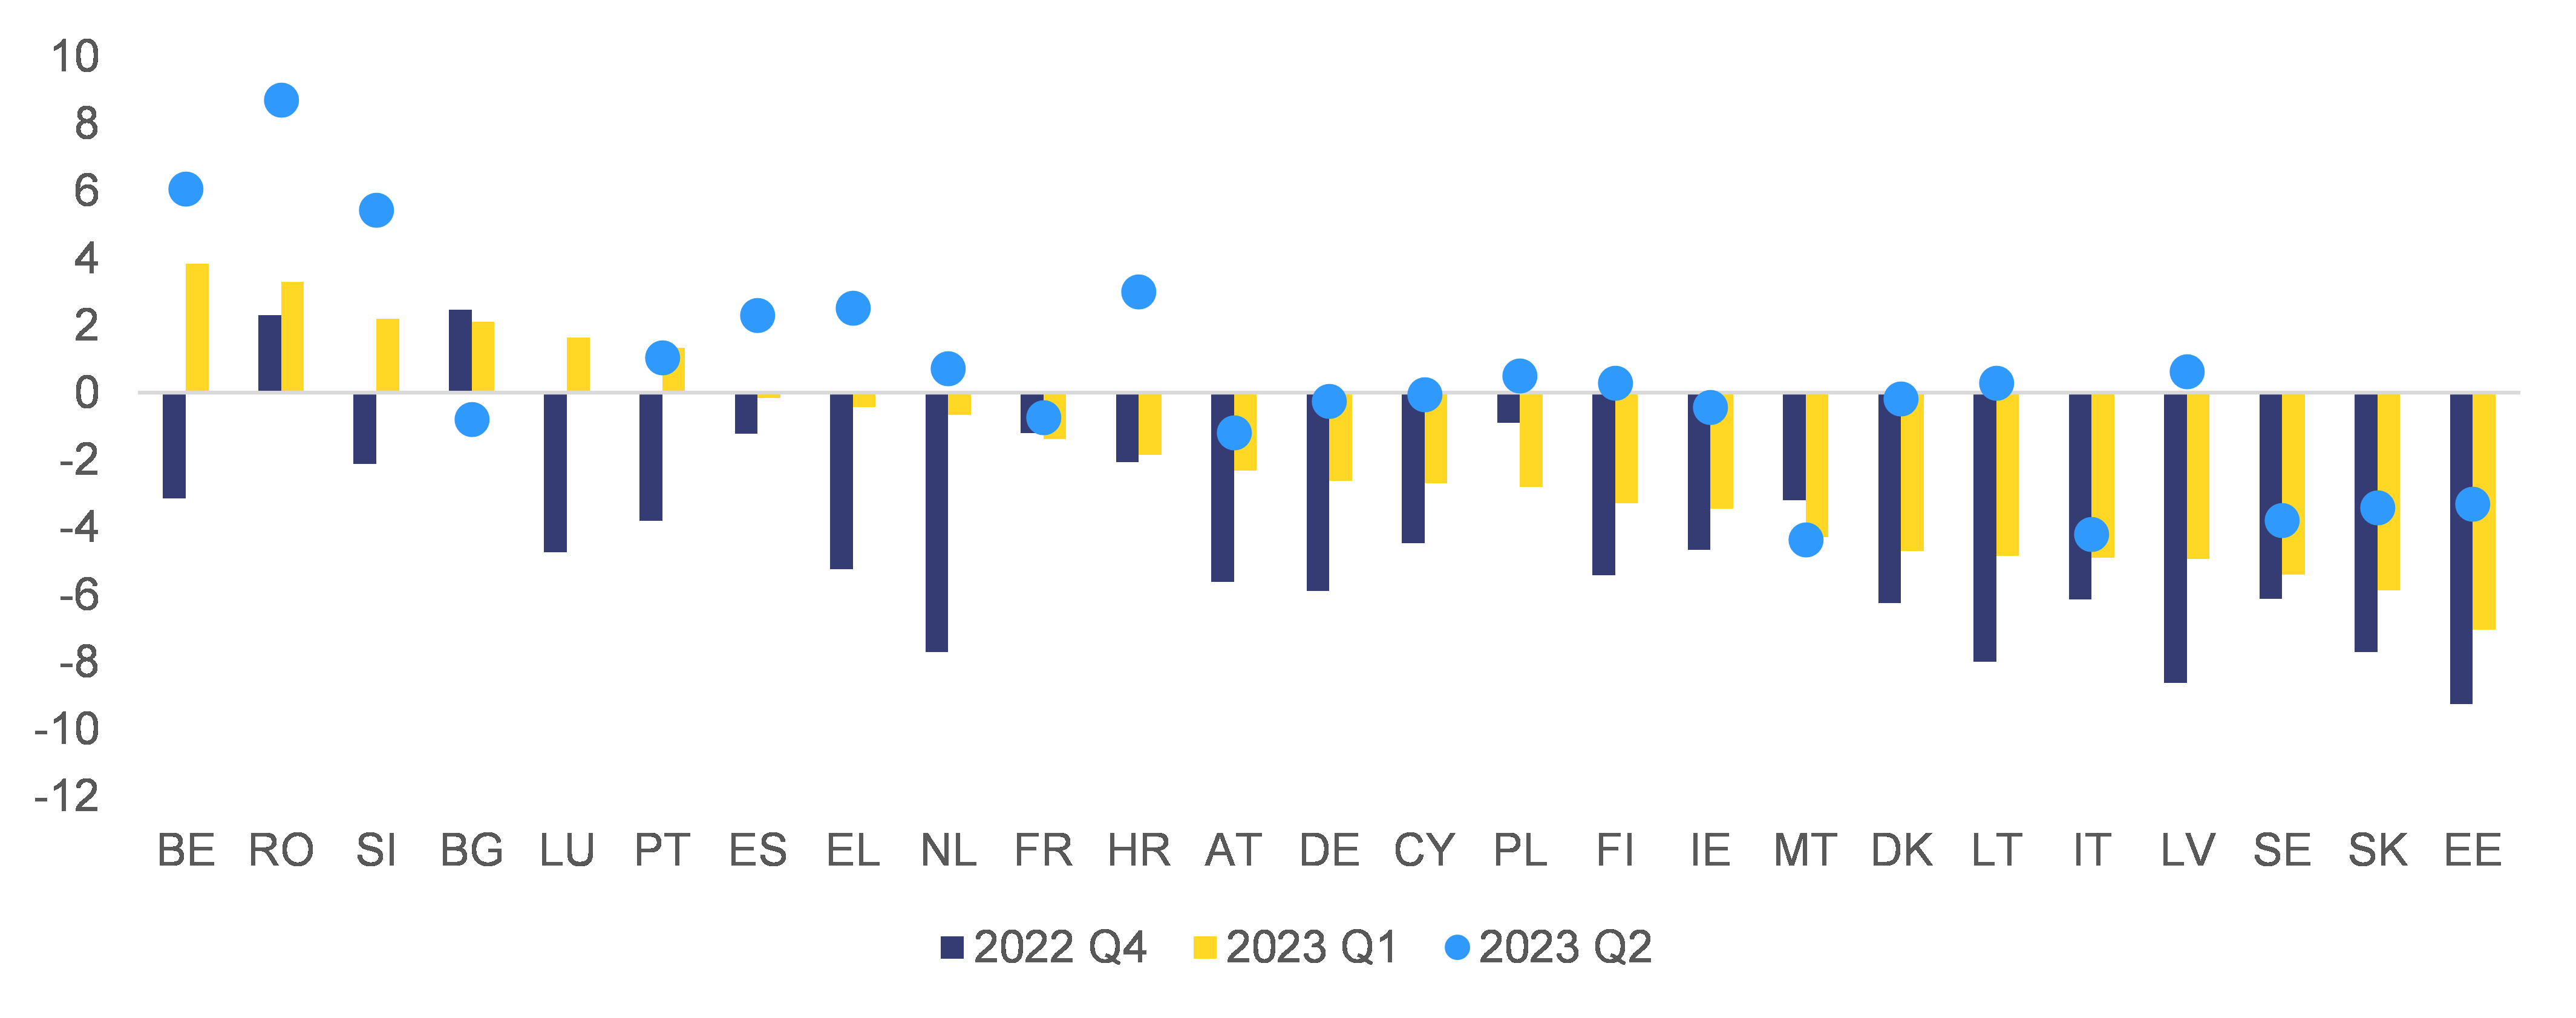
Graph 2.A1.2: Real wages per employee (2022q3-2023q1)
Source
Own calculations based on Eurostat [namq_10_pe, namq_10_a10, prc_hicp_midx]
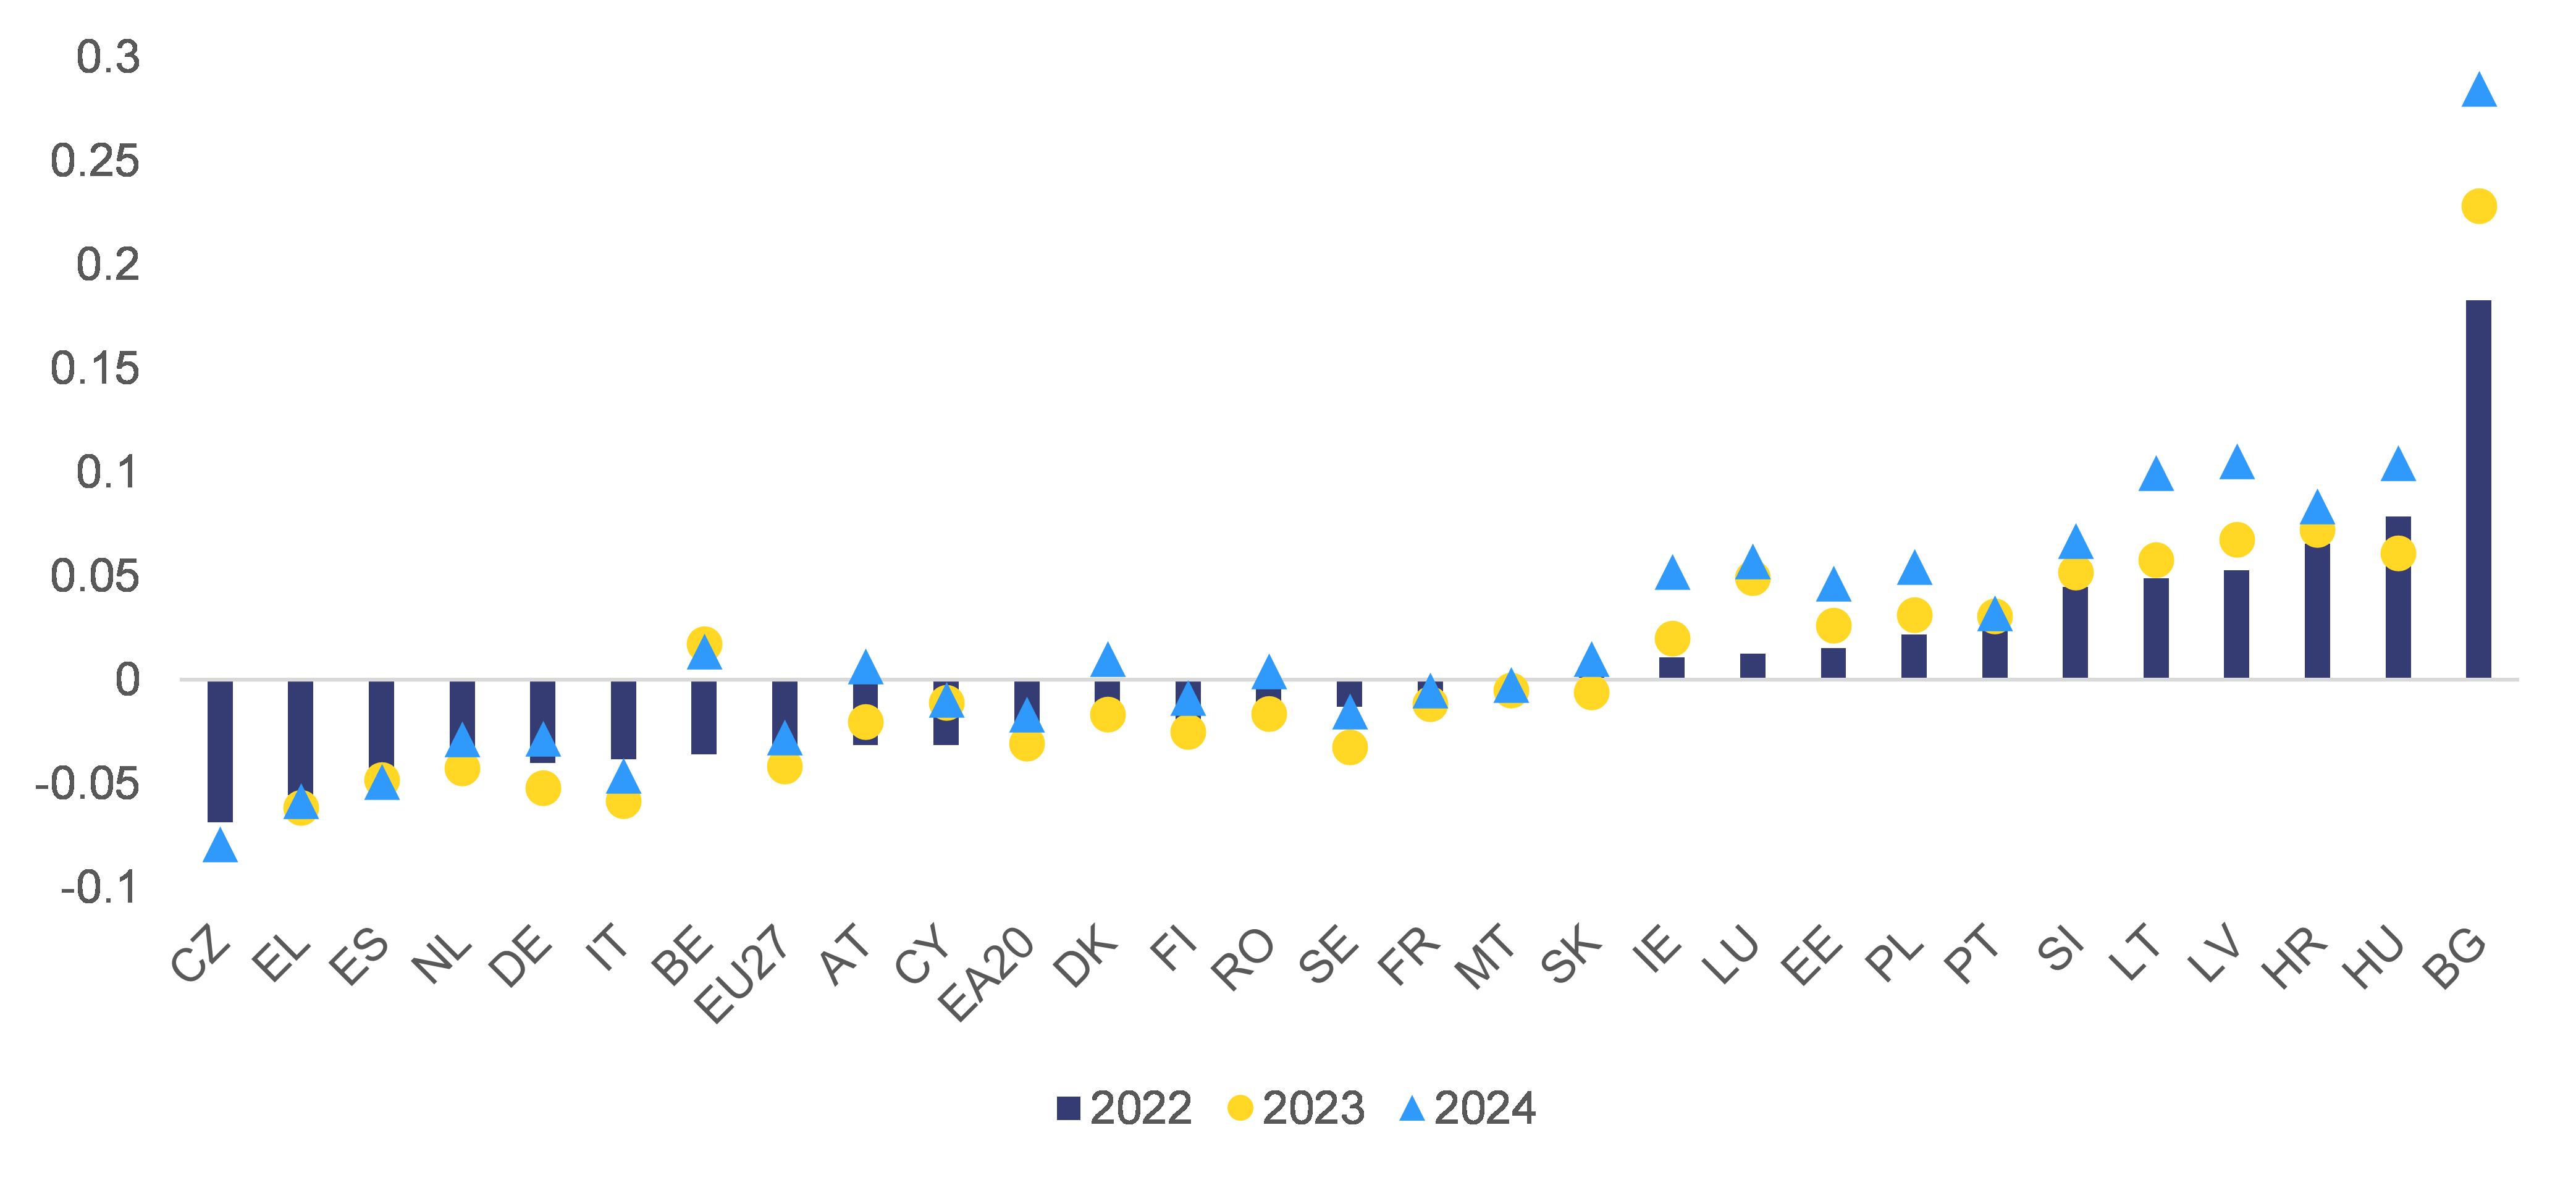
Graph 2.A1.3: Real wages per employee (2022-2024)
Source
Ameco [5 0 0 0 HWWDW, 5 0 0 0 ZCPIH]
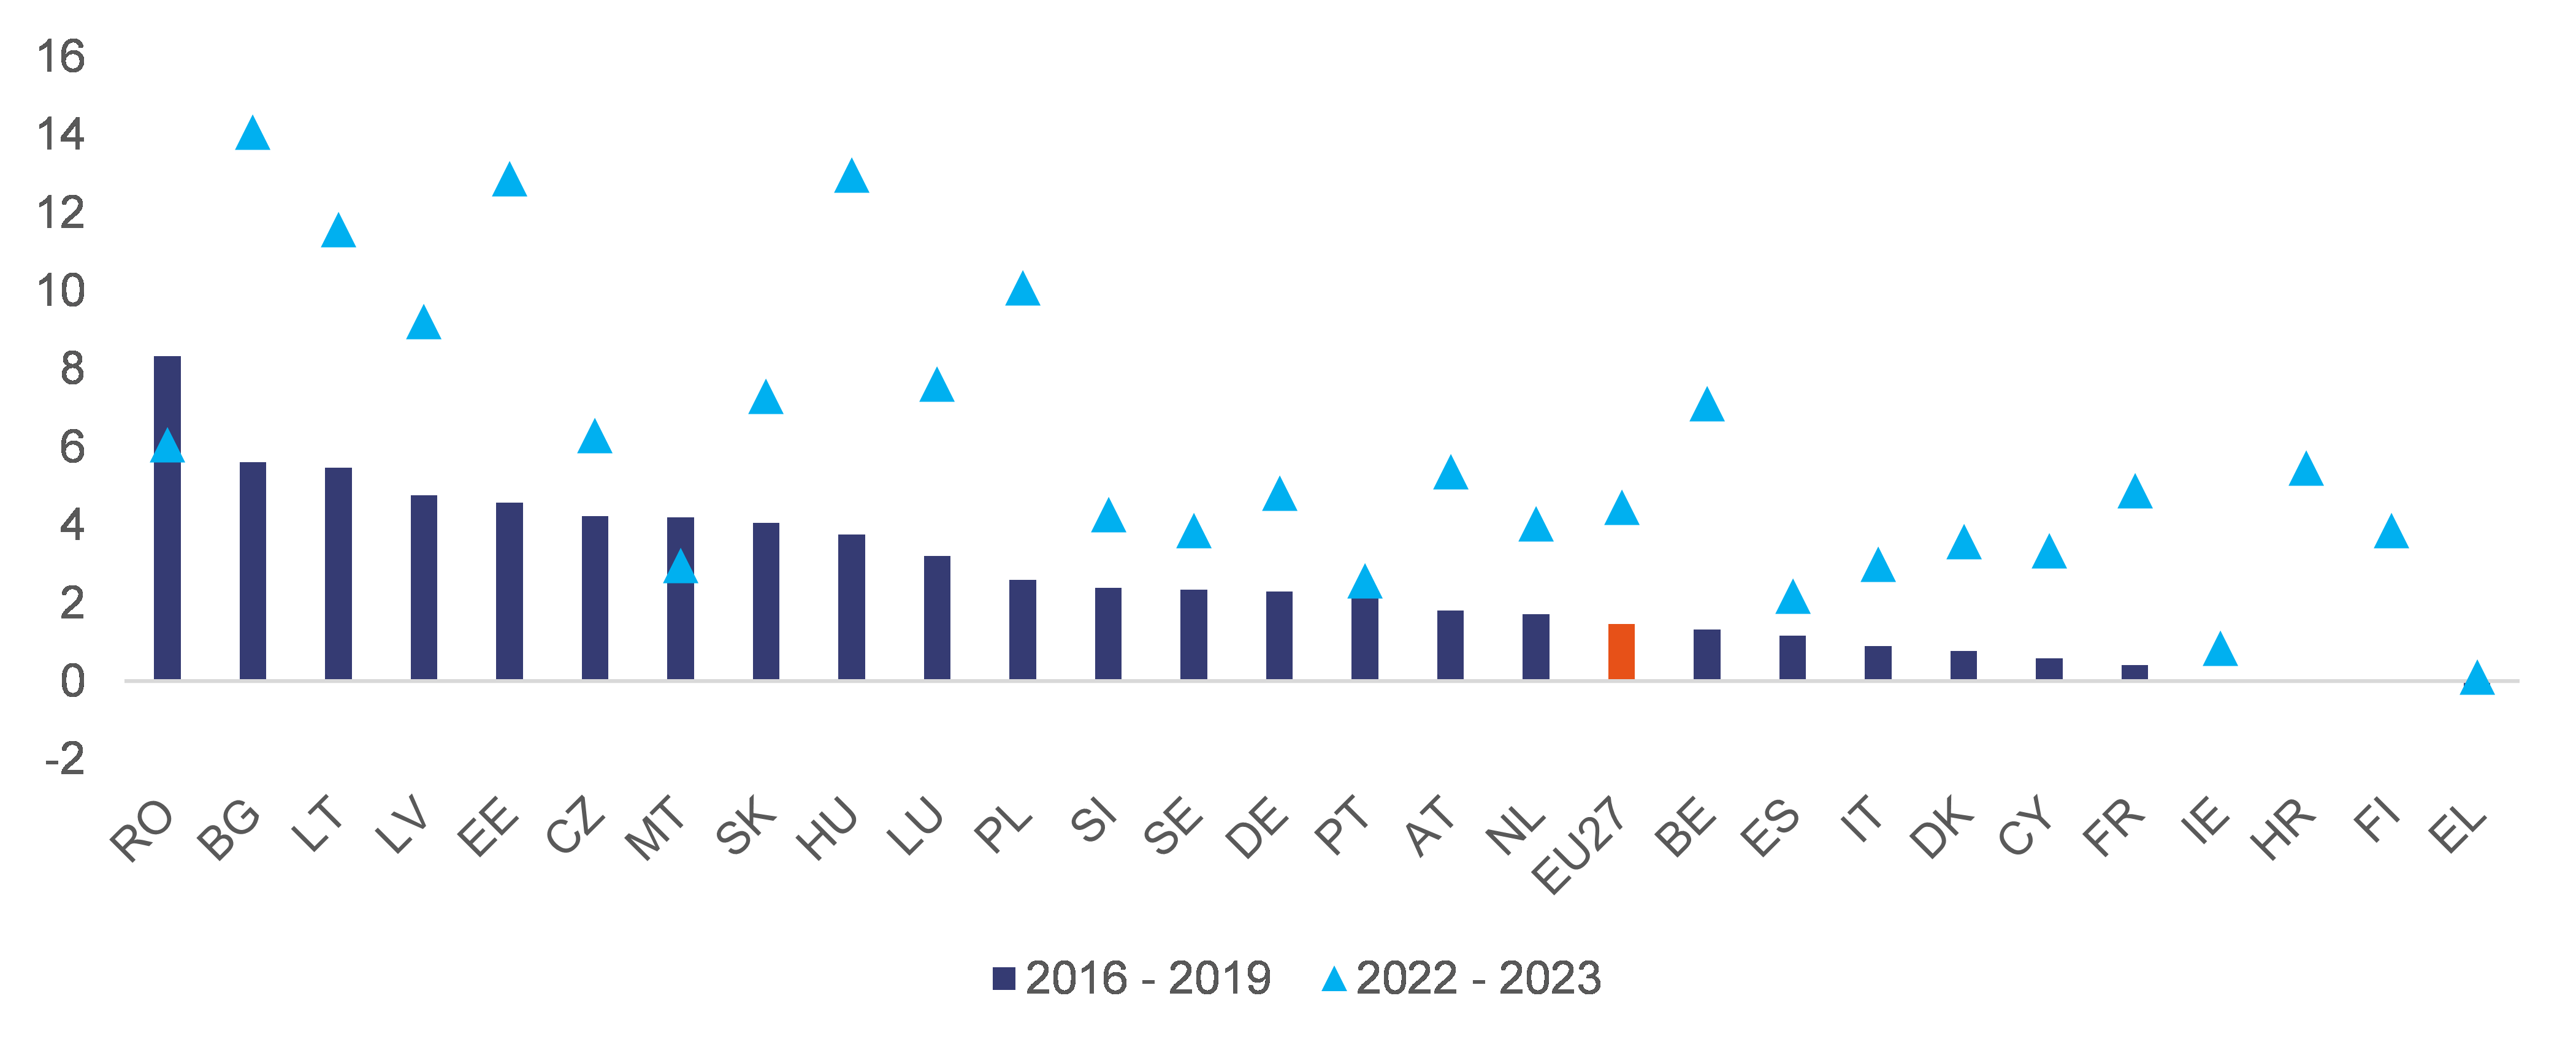
Graph 2.A1.4: Average growth rate of nominal unit labour costs between 2016-2019 and 2022-2023
Source
Ameco [5 1 0 0 PLCD]
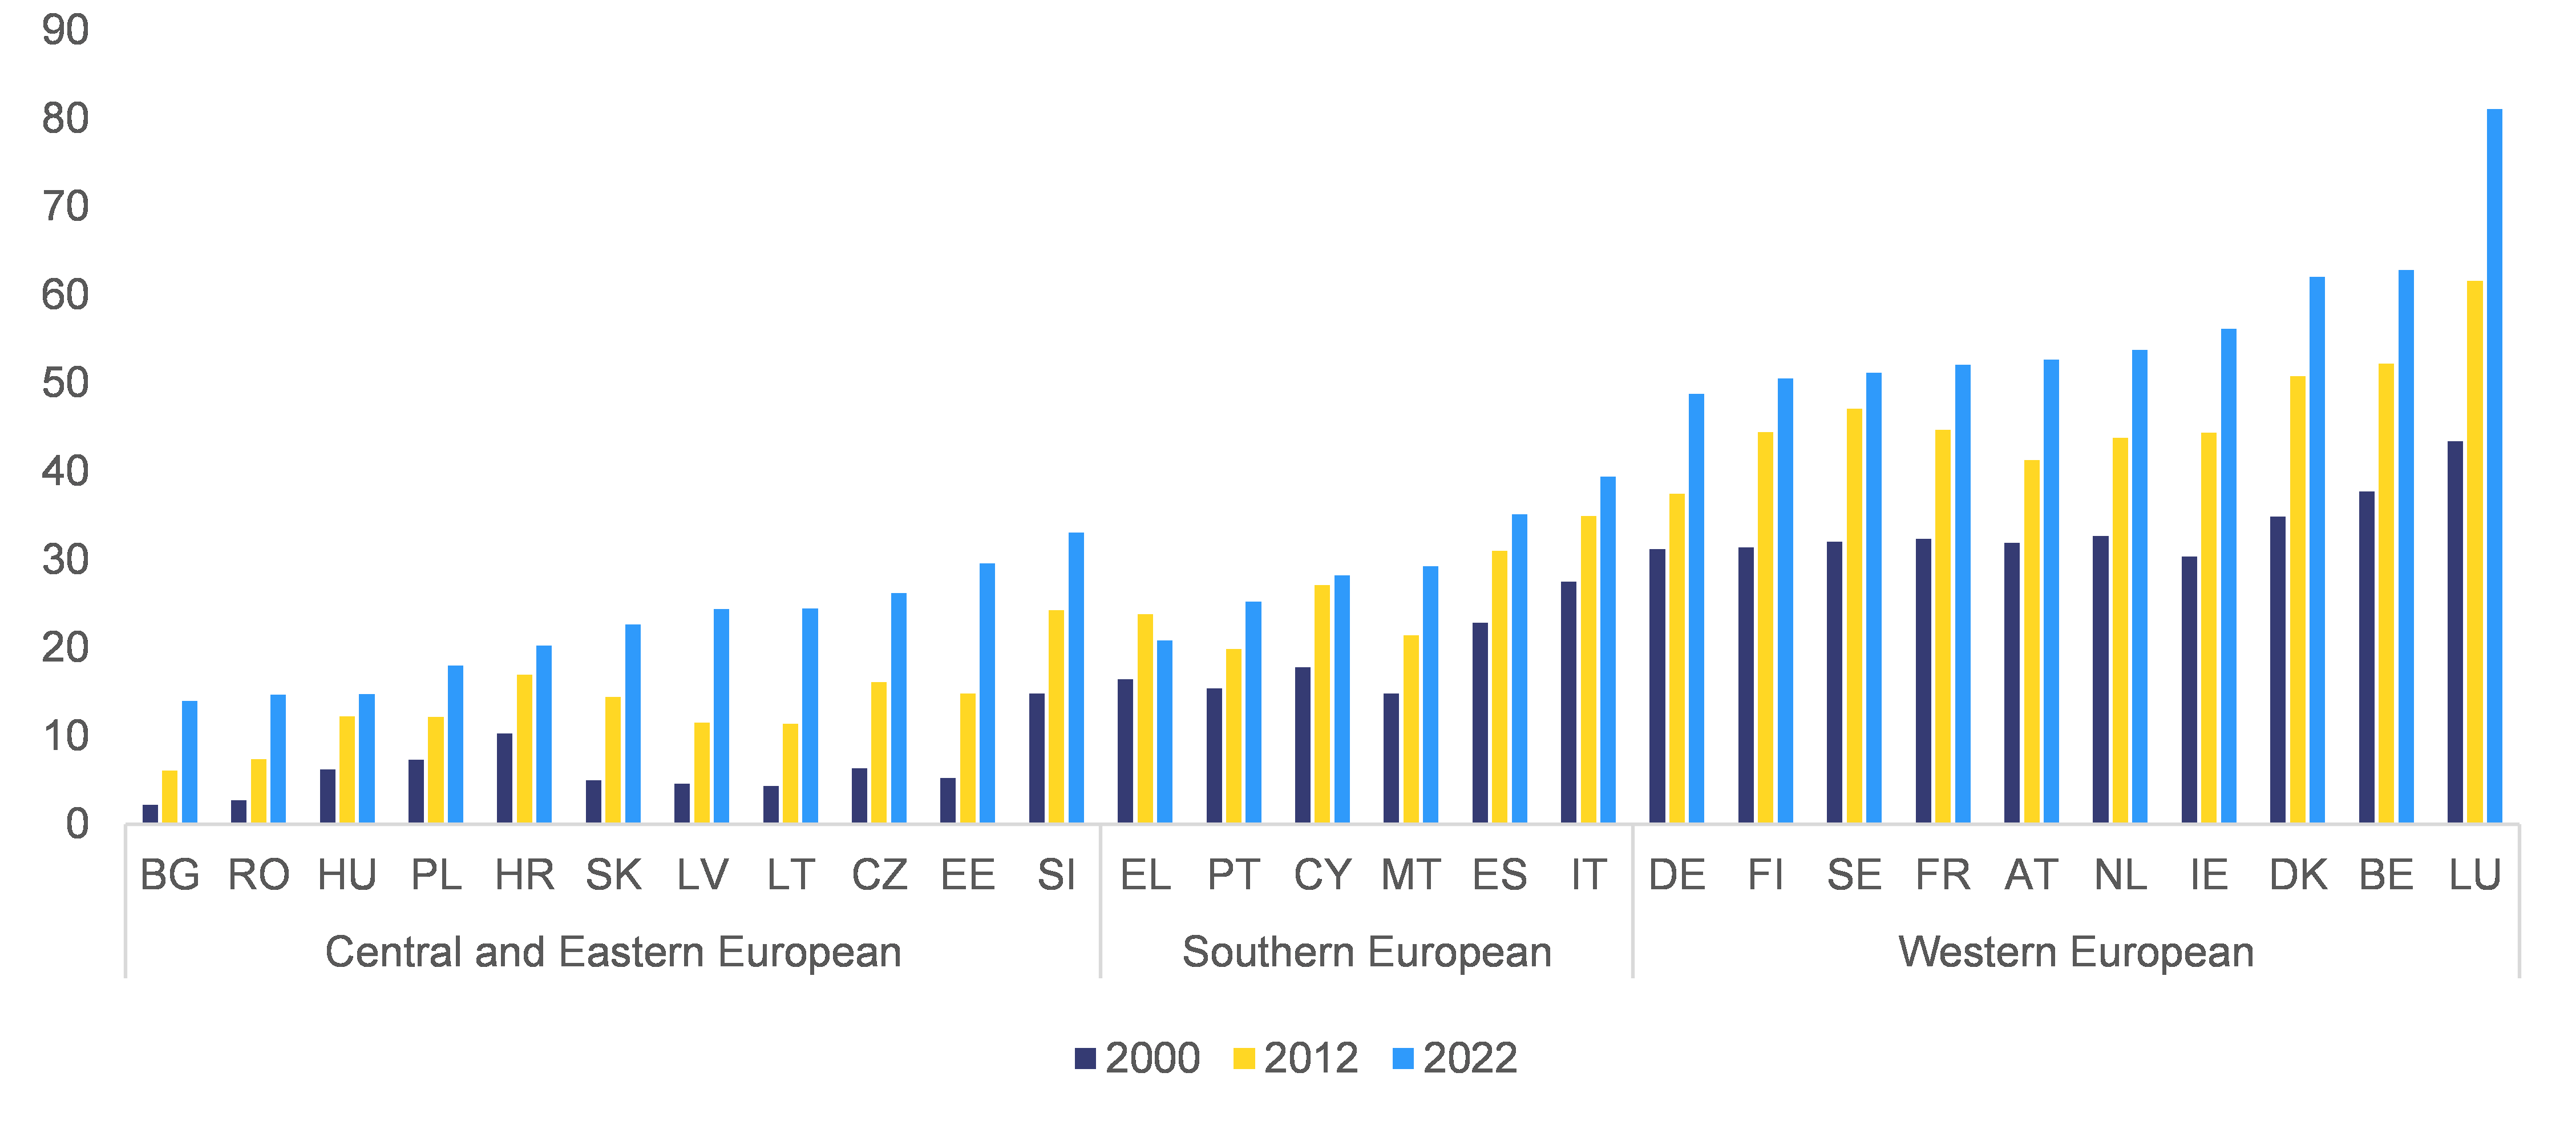
Graph 2.A1.5: Nominal compensation per employee (2000, 2012, 2022)
Source
Ameco
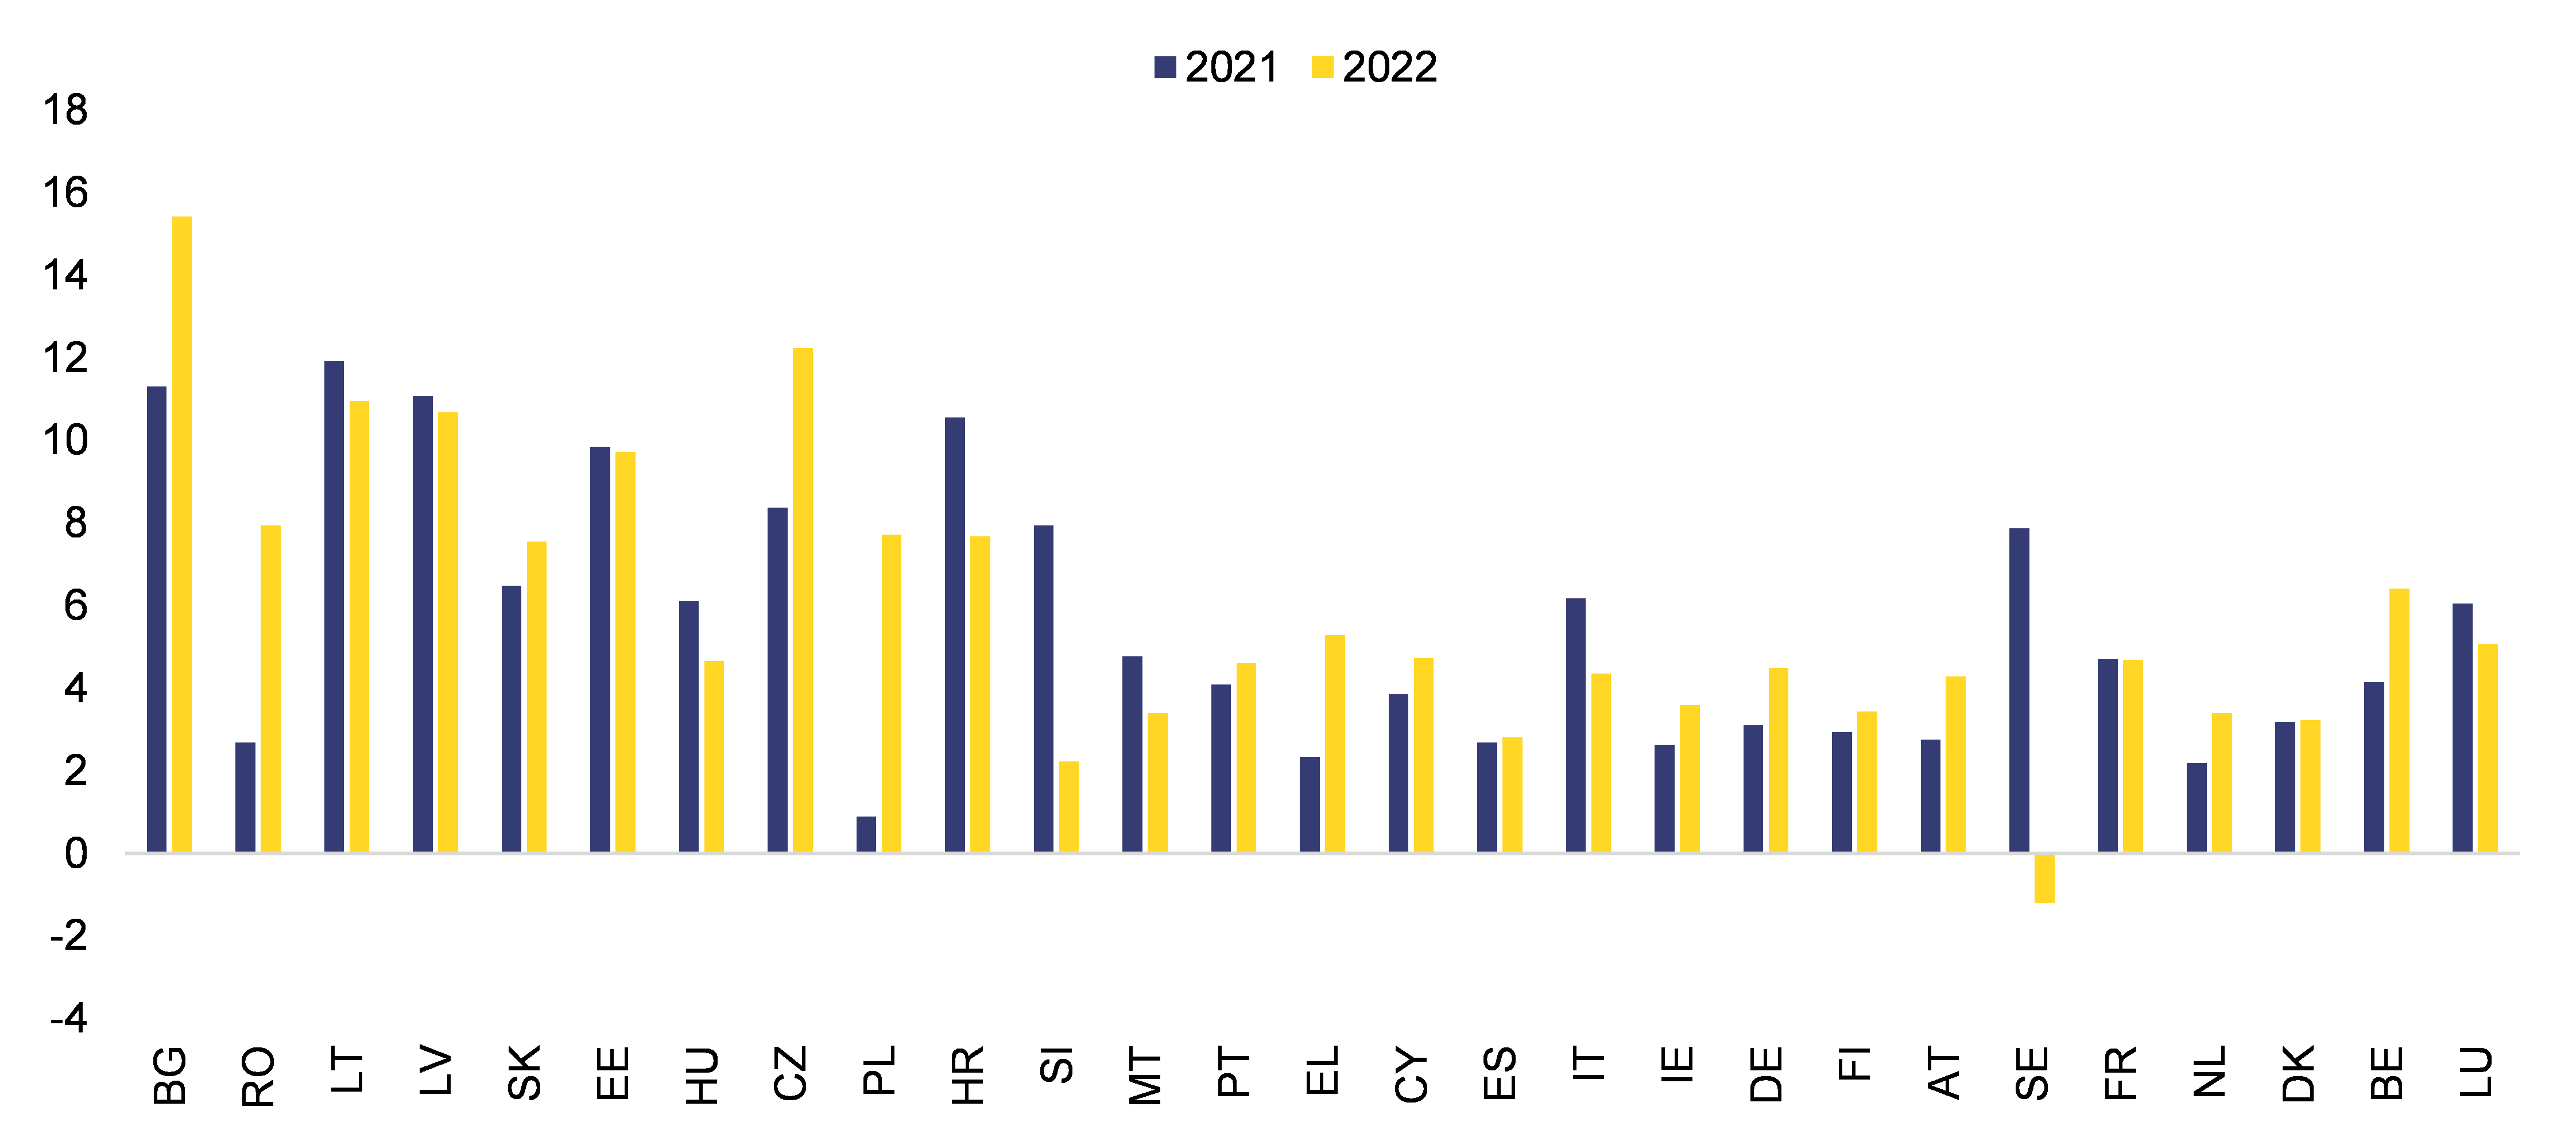
Graph 2.A1.6: Growth rates of nominal compensation per employee (2021 and 2022)
Note
(1) Countries are ranked based on the basis of nominal compensation per employee 2000 levels
Source
Ameco
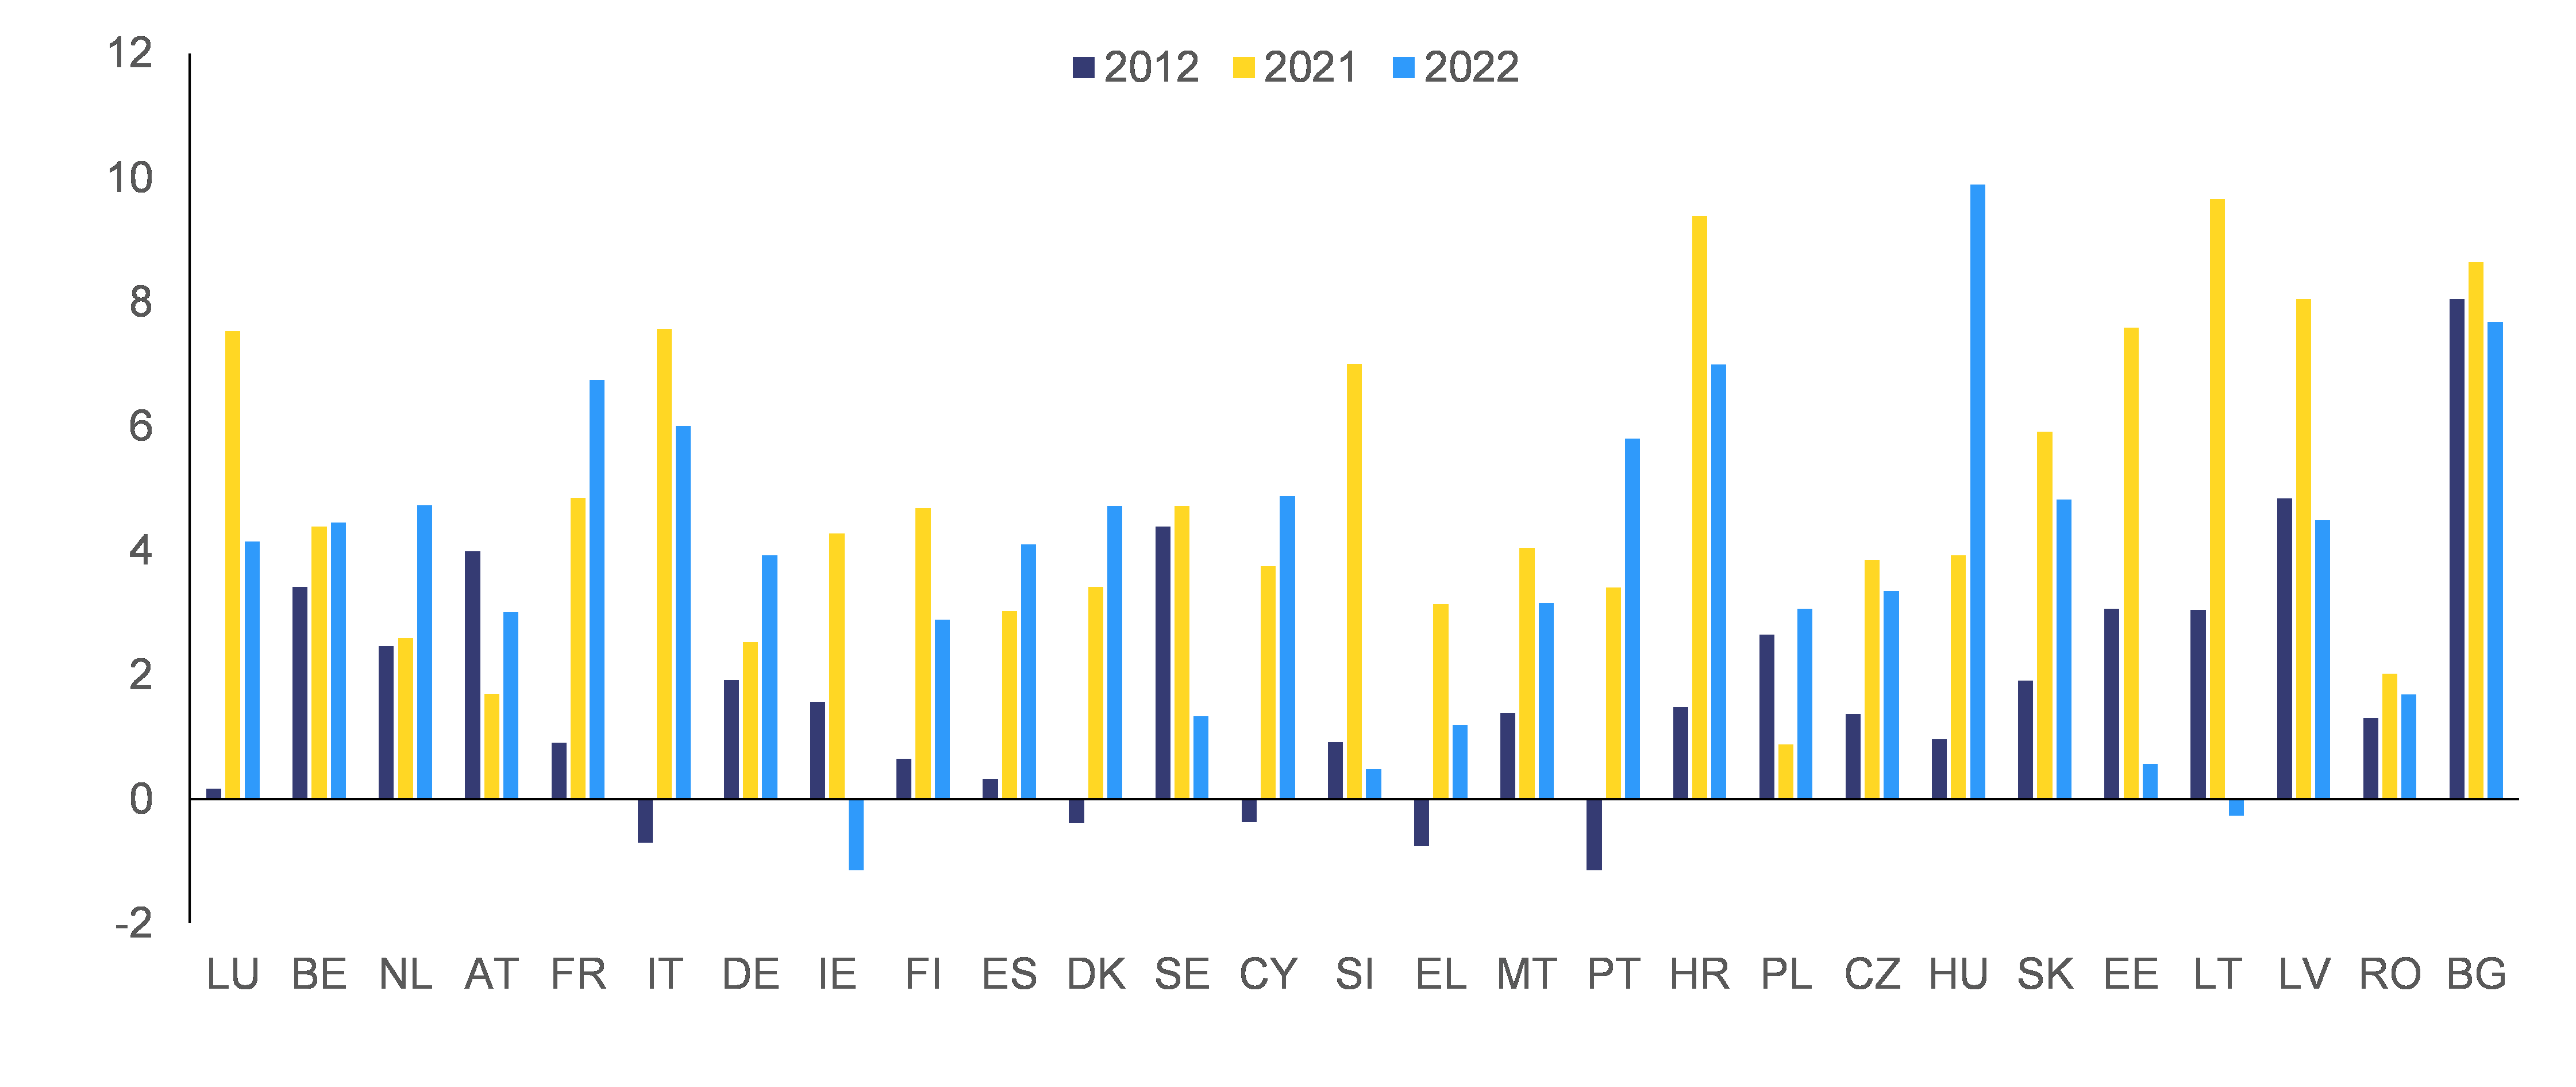
Graph 2.A1.7: Growth rates of nominal compensation per employee in PPS (2012, 2021 and 2022)
Note
(1) Countries are ranked on the basis of nominal compensation per employee 2000 levels.
Source
Ameco
Graph 2.A1.8: Sigma convergence of nominal compensation per employee in levels and PPS
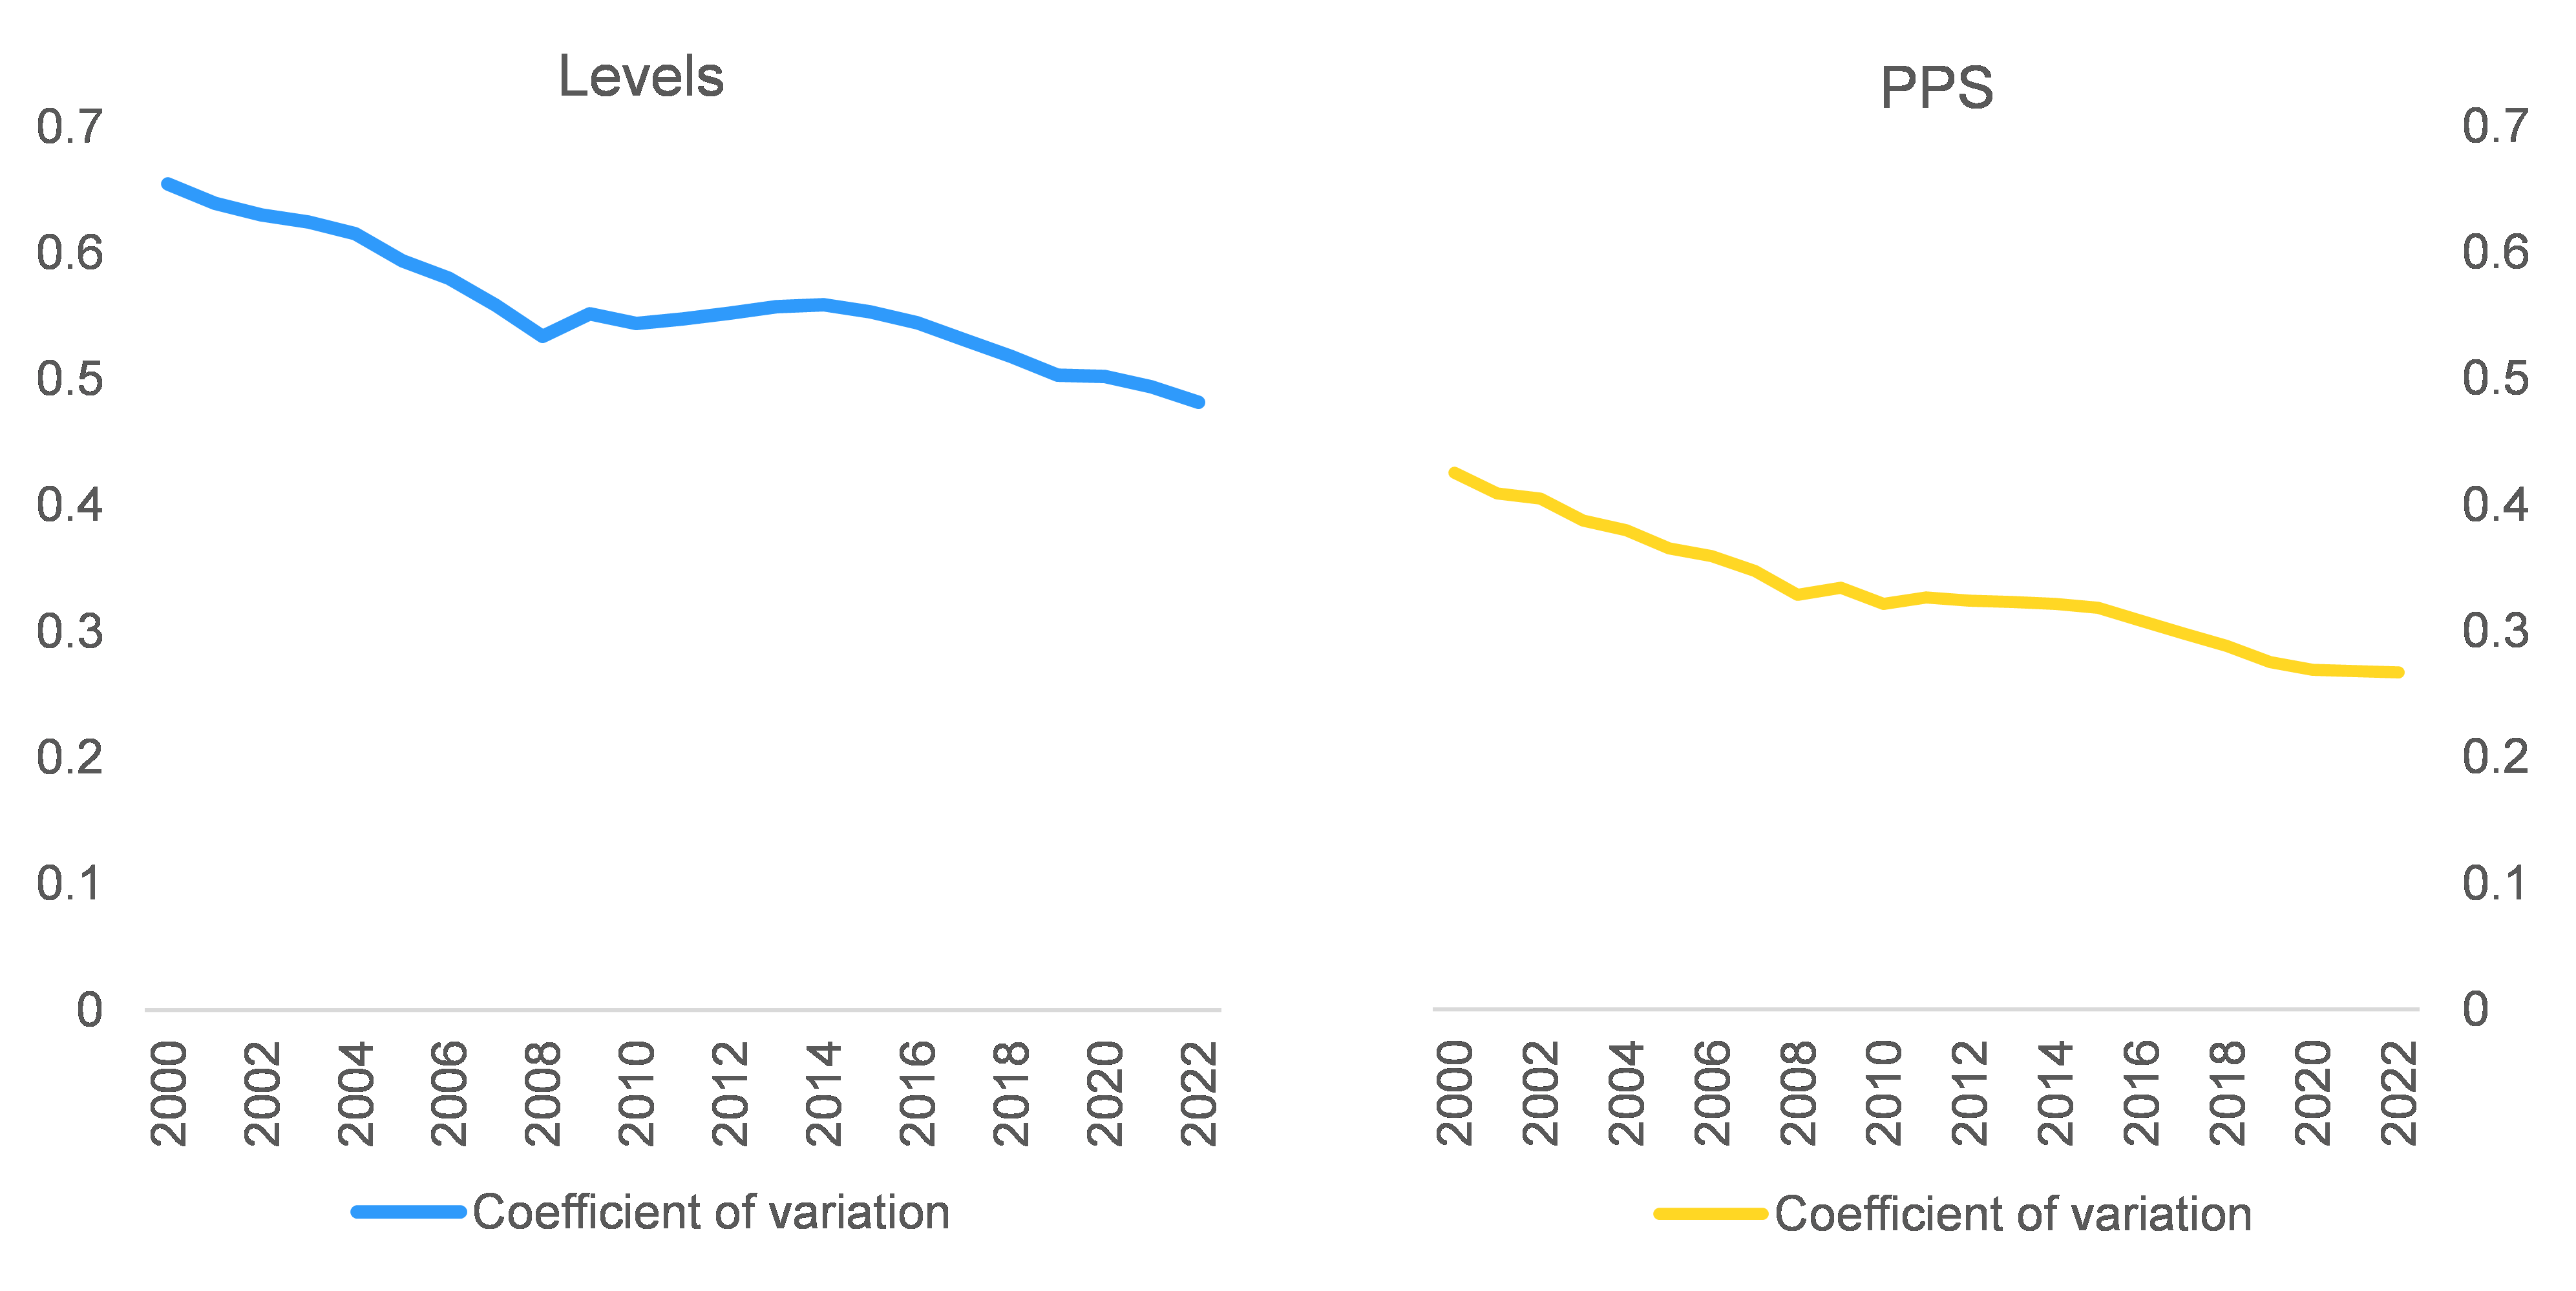
Source
Own calculations based on Ameco