General labour market conditions in the EU and its Member States
General labour market conditions in the EU
The job-rich recovery from the COVID-19 pandemic has contributed to the resilience of EU labour markets in the face of the energy crisis and Russia’s war of aggression against Ukraine.
In the second half of 2022 and the first quarter of 2023, EU employment continued to grow strongly despite the slowdown of economic activity in the third and fourth quarter (Table 1.1). The labour market response to this slowdown has been quite small so far: employment growth declined from 0.4 % quarter-on-quarter in the first two quarters of 2022 to 0.2 % in the third quarter and 0.3 % in the fourth quarter, regaining temporarily some strength to reach 0.5 % in the first quarter of 2023, before dropping to 0.2% in the second. Compared with the same quarter of the previous year, employment growth declined from 2.5 % in the second quarter of 2022 to 1.1 % in the second quarter of 2023 (Graph 1.1 (a) and Table 1.1). To put this data in a historical perspective, current employment growth can be compared with the average of recent periods of positive GDP growth (i.e. excluding recessions, defined as two consecutive quarters of negative growth). This comparison reveals that the recovery that started after the pandemic is more job rich. In the second half of 2022 and the first half of 2023 employment increased at an average annualised rate of close to 1.1 %, which not only is above the average growth recorded in the pre-pandemic period, but has been taking place in the context of a much weaker economic growth (Graph 1.1 (b)) . The counterpart of this labour market resilience is the decline in labour productivity.
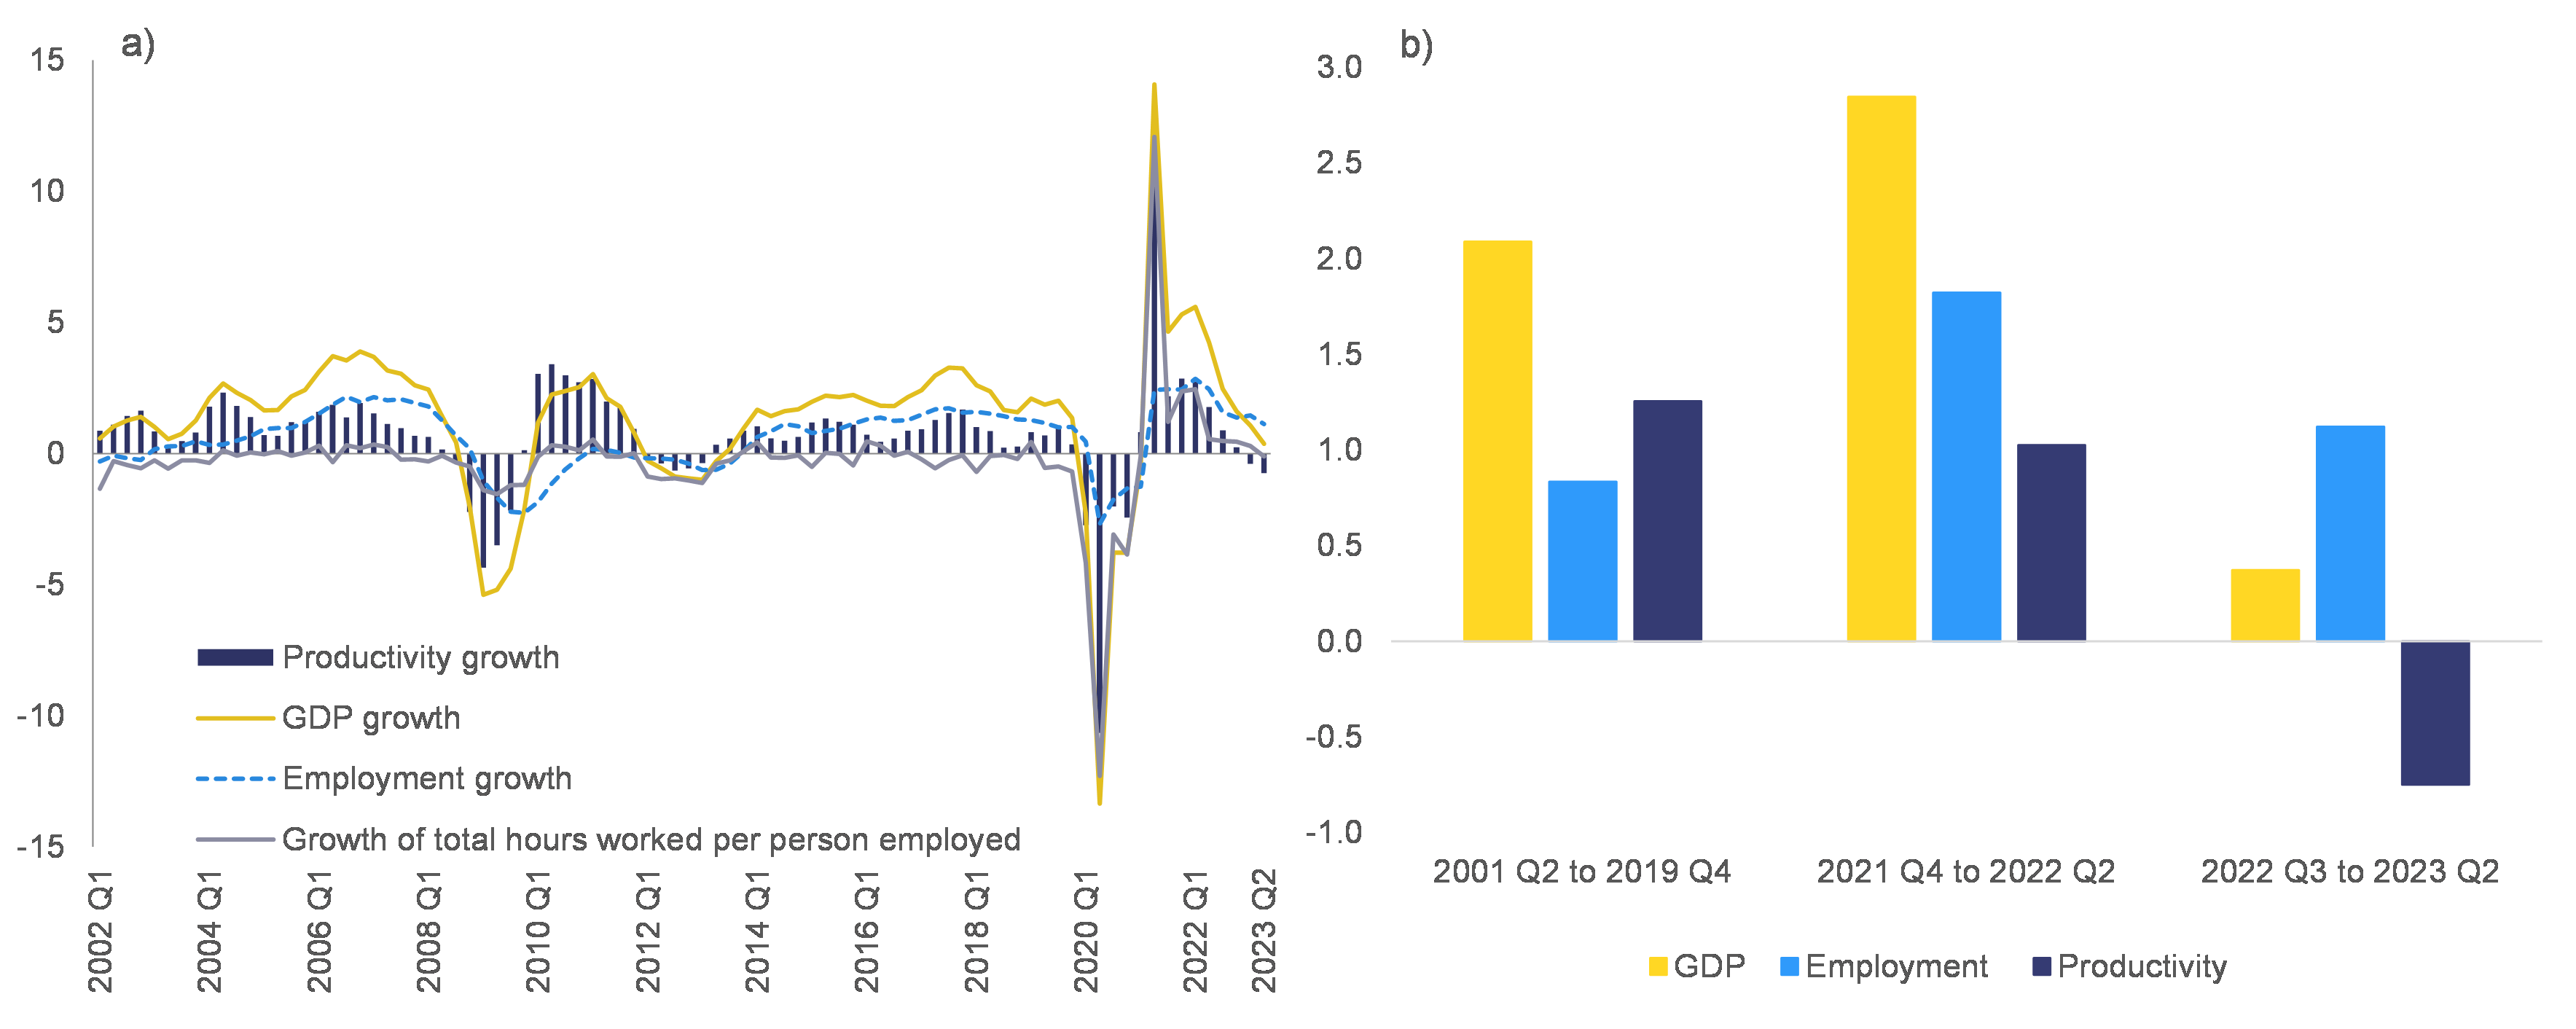
Graph 1.1: (a) Employment, GDP, hours worked and productivity in the EU in % and (b) annualised growth rates for GDP, employment and productivity in periods of positive GDP growth
Additional information about graph 1.1
The left panel shows the time series of the growth rate of employment, GDP, hours worked per employee and productivity from the first quarter of 2020 to the last of 2022. In the second half of 2022, GDP growth has started to decline significantly (from more than 4% of the first half to less than 2.2% of the second half). The labour market response to this slowdown has been so far quite small: employment growth declined from 0.4% quarter-on-quarter in the first two quarters of 2022 to 0.2% in the third and 0.3% in the fourth quarter.
The right panel shows the average employment, GDP and productivity growth for the quarters of positive economic growth of the period 2001Q2–2019Q4 and 2021Q4-2022-Q2. It compares these periods with the average growth of the period 2022Q3-2023Q1. The chart shows that in the latter period employment growth has been much higher than in the past on average; the opposite holds true for GDP growth. Therefore, in the latter period productivity growth is negative while it was positive in the first two periods.
Note
Graph 1.1 (a): data are the average annualised growth rates over the period, excluding quarters when GDP was negative quarter on quarter. This excludes recessions, defined as two consecutive quarters of negative growth.
Source
Eurostat, National accounts, GDP and main components (output, expenditure and income) (namq_10_gdp) and Employment A*10 industry breakdowns (namq_10_a10_e).
All EU Member States benefited from the post-pandemic-recovery.
At the beginning of 2023, almost all Member States had recovered the job losses experienced during the pandemic and their employment growth rates returned to their long-term trends (Graph 1.2 (a)) . In half of them, employment was about 2 % higher than in the fourth quarter of 2019 (Graph 1.2 (c)). Similarly, by December 2022 the unemployment rate had fallen below pre-pandemic levels in 15 Member States . In the first 6 months of 2023, unemployment continued falling or remained broadly stable in all countries. In general, the unemployment rate was below its (pre-pandemic) long-term average in all Member States and was notably below the average in those with historically high levels of unemployment (Graph 1.2 (b)). Therefore, differences in unemployment rates across countries continued to decrease . Labour market slack has also been on a declining path in most Member States (Graph 1.2 (d)), dropping from 12.6 % to 11.9 % between the first quarter of 2022 and the second quarter of 2023 for the EU. However, in thefirst half of 2023, the economic slowdown started to be felt, with 12 Member States experiencing an increase in the measure of slack in the second quarter of 2023.
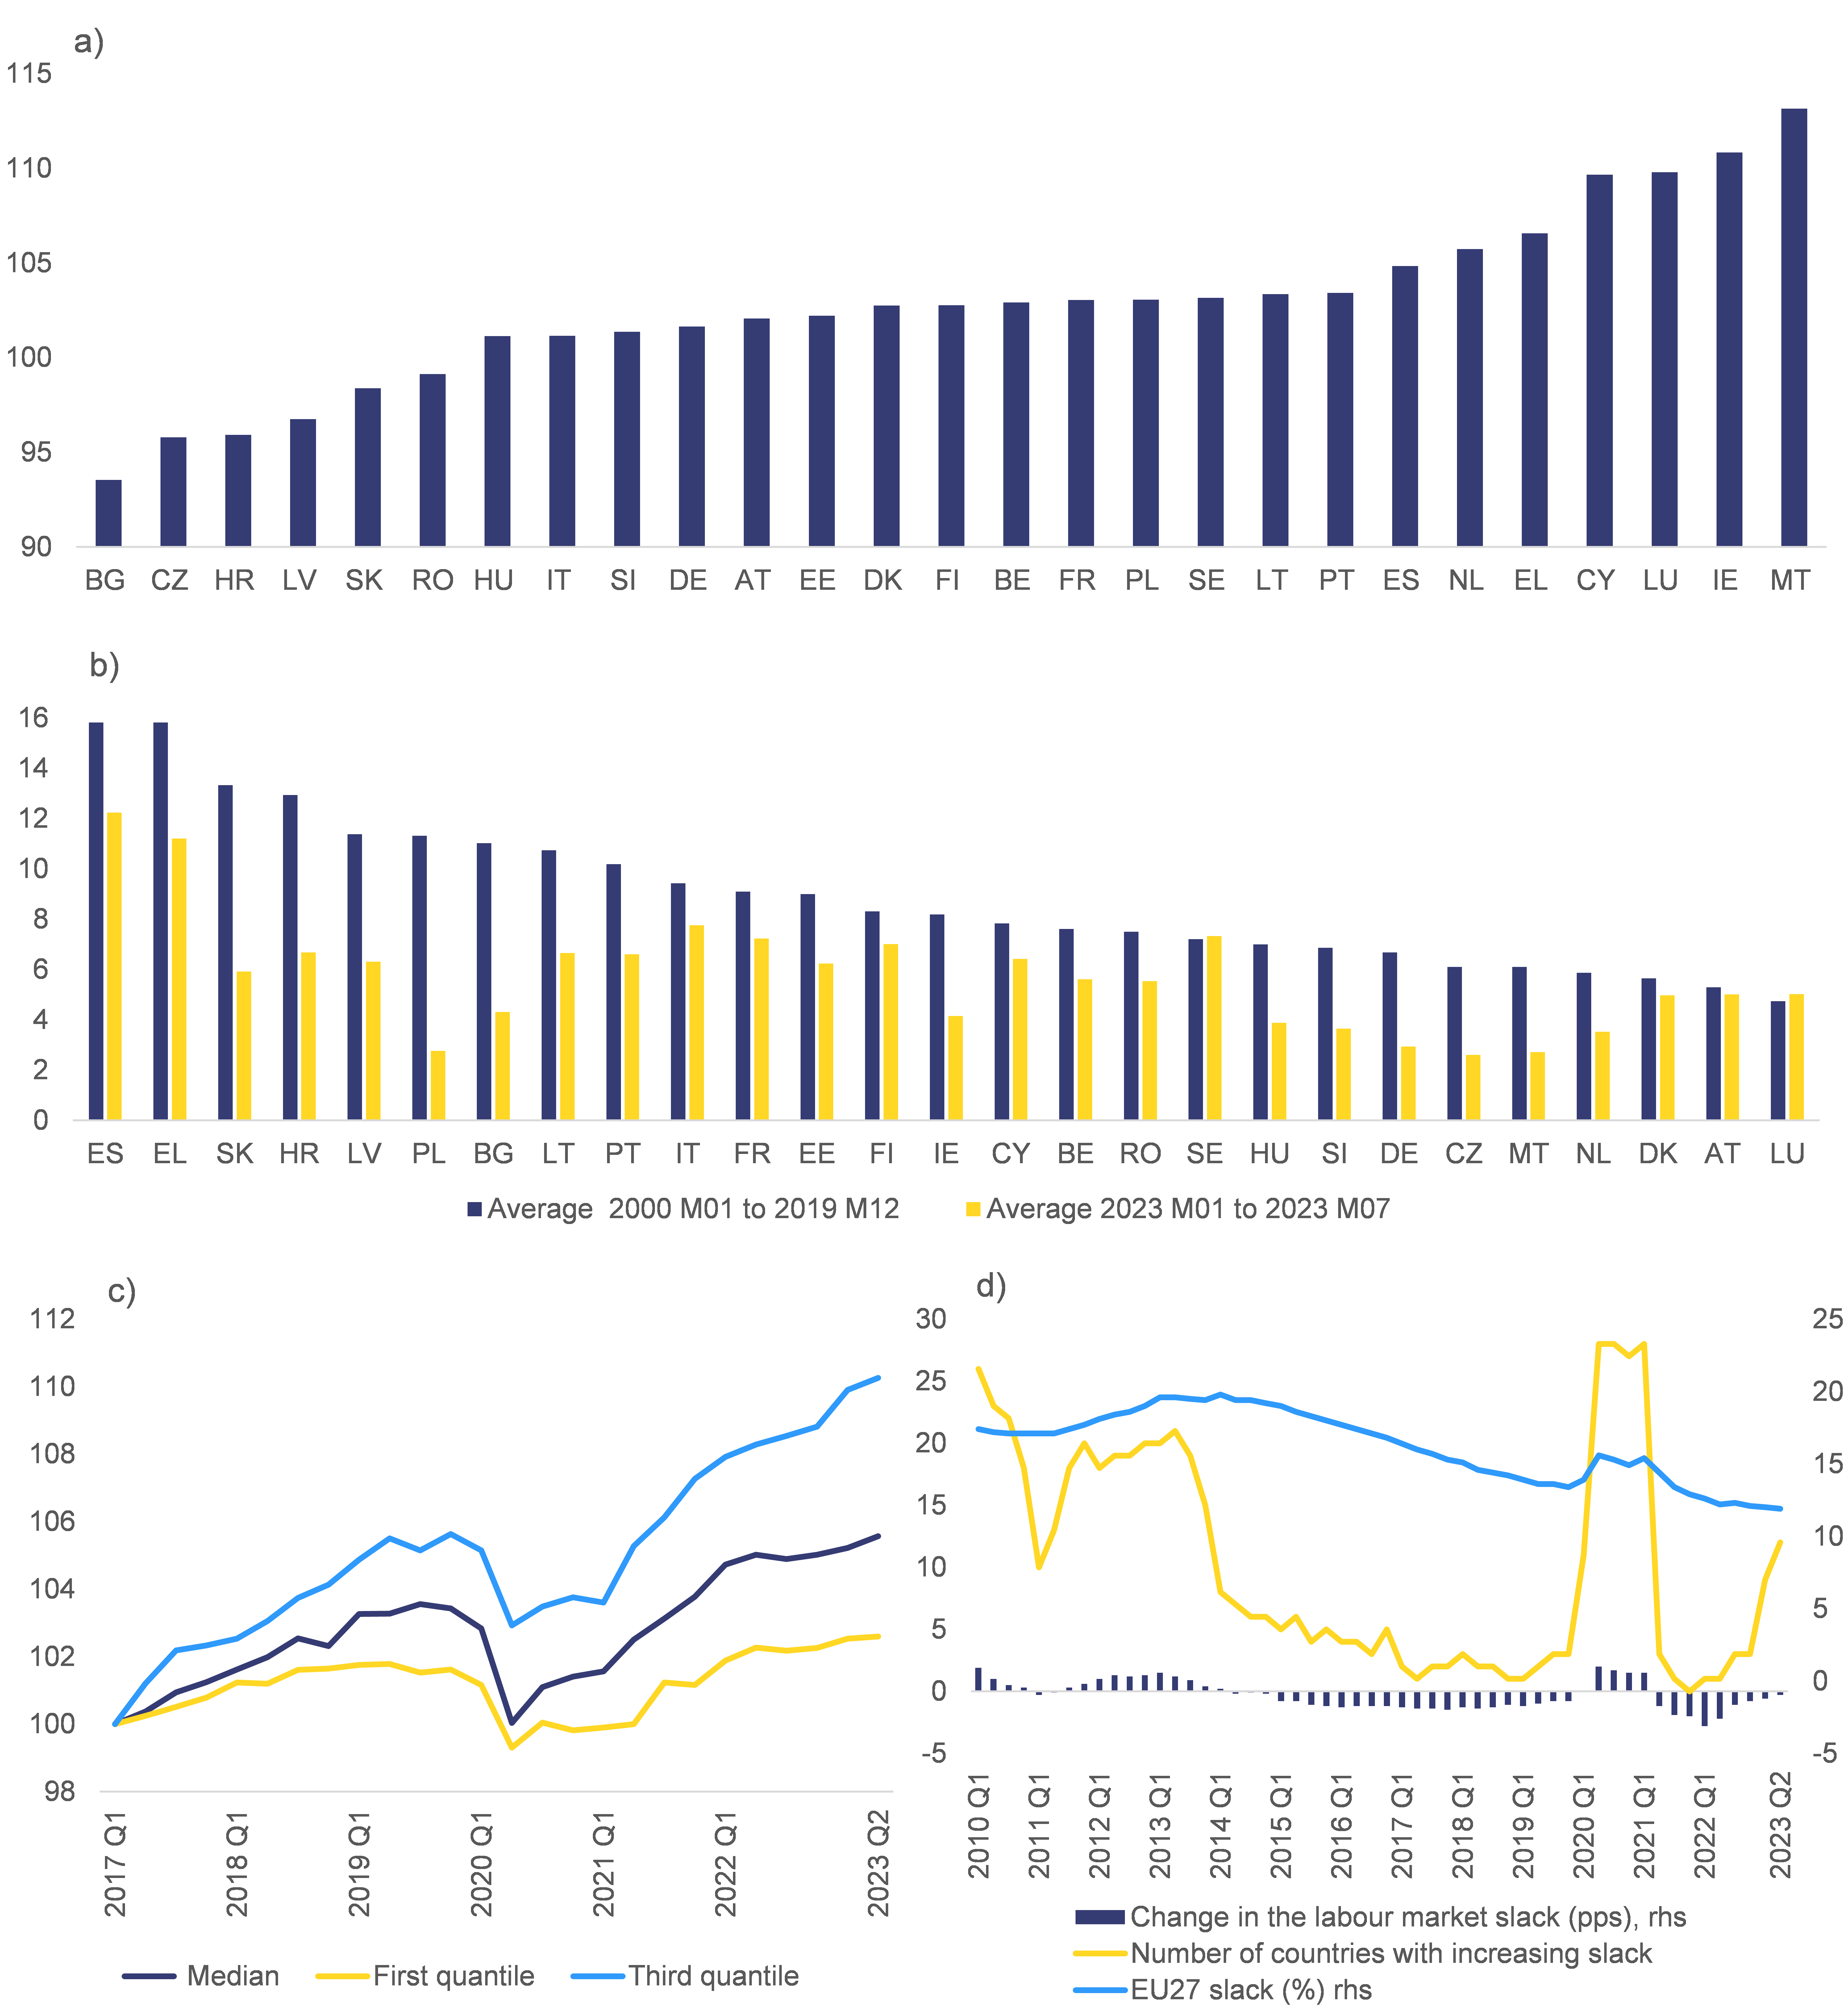
Graph 1.2: Selected labour market indicators: (a) employment in the second quarter of 2023 (fourth quarter of 2019 = 100), (b) unemployment rate in the EU Member States, (c) employment distribution across countries (first quarter of 2017 = 100) and (d) labour slack in the EU
Additional information about graph 1.2
The figure consists of four panels.
The first panel shows the employment growth rates in the first quarter of 2023 in comparison to the fourth quarter of 2019. In most of the countries employment in the first quarter of 2023 was higher than in the fourth quarter of 2019. Only Bulgaria, Czechia, Croatia, Latvia, Romania, Slovenia, and Slovakia showed employment rates below pre-pandemic levels. Malta, Ireland, Cyprus, Luxembourg, and Greece were the five Member States with the highest employment growth rates in comparison to the fourth quarter of 2019.
The second panel compares the average unemployment rates in EU Member States in the first six months of 2023 to the long-term average, which ranges from January 2000 to December 2019. In general, the unemployment rate in the first six months of 2023 was below its pre-pandemic long-term average in all Member States and was notably below the average in those with historically elevated levels of unemployment.
The third panel shows the average employment distribution across EU Member States from the first quarter of 2017 to the first quarter of 2023 in comparison to the first quarter of 2017. Measured always in the first quarter of each year, graphs that represent the median, first and third quartile of employment distribution across EU Member States displayed. In half of the countries, at the beginning of 2023 employment was about 2 % higher than in the fourth quarter of 2019.
The last panel displays the development of labour slack in the EU from the first quarter of 2010 to the first quarter of 2023. In detail, the graphs present the change in labour market slack, the number of EU Member States with increasing slack and the average slack of countries in percent. Concerning the change in labour market slack, the first graph shows that labour market slack has been decreasing since the second quarter of 2014. It rose from the second quarter of 2020 until the first quarter of 2021, followed by a continuous decrease since then. The graph for the number of countries with increasing slack shows a similar trend. The number was low before the pandemic but rose to 28 Member States at the height of it. From the first quarter of 2021 on, a steep decrease to only 1 member state in the fourth quarter of 2021 can be observed. Afterwards the number increased again slowly. The average labour market slack has continuously decreased from 19.8 % in the first quarter of 2014 to 13.9 % in the first quarter of 2020. During the COVID-19 pandemic, it increased up to 15.6 % in the second quarter of 2020 and 15.4 % in the first quarter of 2021. Afterwards, a phase of continuous decrease began, dropping from 12.6 % to 12.0 % between the first quarter of 2022 and the first quarter of 2023.
Note
M, month. Unemployment rates are harmonised; seasonally adjusted monthly figures need to be updated.
Source
Eurostat, National accounts, Unemployment by sex and age – monthly data (une_rt_m); and Eurostat, Labour Force Survey, Employment and activity by sex and age – quarterly data (lfsi_emp_q) and Labour market slack by sex and age – quarterly data (lfsi_sla_q).
While headcount employment bounced back quickly after the pandemic, the number of hours worked per worker reverted to its long-running downward trend.
After the large drop registered during the pandemic (largely due to the widespread use of short-time work schemes), the number of hours worked per worker picked up strongly in 2022 – growing on average at about 2 % year on year – but without fully returning to pre-pandemic levels (Graph 1.3). In fact, looking beyond the business cycle dynamics, a long-term downward trend can be seen in the number of hours worked per worker, a decline that ends to accelerate during recessions. Over the past two decades, each time the EU economy recovered from a downturn, the number of hours worked per worker did not revert fully to its pre-shock level. This has also been observed in the period that followed the COVID-19 crisis. This long-term decline in the number of hours worked per worker can be partly explained by the rising importance of services (characterised by a lower number of hours worked per worker than the average), even though a broader reduction in working time across sectors can be observed. It may also reflect the effect of the introduction of more efficient and productive technologies in the aftermath of recessions. In the case of the COVID-19 pandemic, this could be due to the acceleration of digitalisation. The evolution and recent trends in working time are discussed in more detail in Chapter 3. of this report.
Graph 1.3: Headcount employment and hours worked in the EU
Additional information about graph 1.3
The figure shows the evolution of employment and of the average number of hours worked per worker in the EU, between the first quarter of 2000 and the second quarter of 2023. Regarding employment, four periods can be distinguished. First, a period of positive growth between 2000 and 2008, with employment increasing from 186 million to 205 million. Then, the global financial crisis led to a strong decline between the second quarter of 2008 and the first quarter of 2010, with employment down to 195 million persons, followed by a period of stagnation until the end of 2013. Third, a period of steady growth is observed between 2014 and the last quarter of 2019, with a new peak of close to 210 million. Finally, with the COVID-19 pandemic employment fell abruptly, going below 204 million persons in the second quarter of 2020. However, it quickly bounced back, returning to pre-pandemic levels by the third quarter of 2021 and continuing to grow steadily to attain 216 million in the second quarter of 2023 (latest data available). Regarding the number of hours worked, a small but steady decline can be observed between the first quarter of 2000 and the last quarter of 2019, with the average number of hours worked per person employed going from 430 per quarter to 405 per quarter. Declines experienced during recession periods (namely between 2008 and 2009, and between the end of 2011 and the beginning of 2013) were accompanied only by a partial recovery of the hours worked per worker. This happened also during the COVID-19 pandemic. Hours worked fell abruptly to 356 in the second quarter of 2020, bouncing back in the third quarter (to 396 hours) and then broadly stabilising at a level around 400 hours, below the pre-pandemic period.
Note
Hours worked per person employed are total hours worked divided by total employment.
Source
Eurostat, National accounts, Employment A*10 industry breakdowns (namq_10_a10_e).
The job-rich economic growth currently observed can be explained by the EU economy’s strong exit from the pandemic.
The post-pandemic recovery was mainly driven by pent-up consumption as a result of unprecedented savings accumulated following the activity restrictions imposed to curb the spread of the virus . The sharp rebound of consumption in the recovery benefited to a large extent those sectors that had been most affected by these restrictions, notably services. The fact that these sectors are more labour intensive and account for a large share of total employment could explain the strong overall employment growth post COVID-19 . By contrast, employment stagnated in the manufacturing sector on account of two main factors: (i) at the beginning of the recovery, employment growth in manufacturing was hampered by persistent disruptions to global supply chains; and, (ii) when these started to ease, the cost of energy started to rise sharply due to buoyant demand post COVID-19 and surged to an all-time high following Russia’s military invasion of Ukraine.
Impact of the energy crisis on employment
The positive employment developments observed at the aggregate level hide some differences between sectors, depending on their levels of energy intensity.
In the very short term, firms can respond to an increase in the cost of energy by reducing their energy demand, passing on the increase in production costs to selling prices, reducing their profit margins, or increasing imports of intermediate products from countries less dependent on energy – which allows companies to maintain their levels of production of final goods . The evidence available shows that these channels have played a role during the energy shock . In addition, EU Member States put a wide range of support measures in place to help businesses cope with the sudden and sharp increase in energy prices and maintain employment levels (see European Commission, 2022b). This includes direct subsidies to the most energy-intensive industries to mitigate the increase in production costs and to preserve employment levels when production is reduced or suspended.
As long as firms can maintain production or resort to short-time work support, a temporary surge in energy prices will not necessarily lead to large employment losses.
This is supported by Graph 1.4 (a) which shows that the effect on employment was overall relatively contained and limited to sectors with high energy intensity (which cover mostly industries in agriculture, manufacturing and transport) . At the beginning of 2023, the levels of employment in these sectors were about 3.5 % lower than before the pandemic. By contrast, after a temporary decline during the pandemic, employment in sectors with low energy intensity grew steadily and was more than 7 percentage points above pre-pandemic levels by the end of 2022. Finally, for industries with energy intensity that is neither extremely low nor high, employment remained more or less at its pre-pandemic level .
The energy price shock dampened employment growth in sectors with high energy intensity but did not lead to large employment losses.
Most of the decline in employment observed in sectors with high energy intensity had already occurred by the second quarter of 2021 (i.e. before the surge in energy prices). This suggests that some adjustment had already occurred during the first year of the pandemic, when global logistics and supply chain disruptions reduced the level of economic activity and labour demand in the more exposed sectors (e.g. pharmaceuticals, machinery, manufacture of basic metals). Subsequently, the tensions in the energy markets contributed to keeping labour demand subdued in energy-intensive industries that had previously been exposed to supply chain disruption – holding back job creation without triggering job destruction .
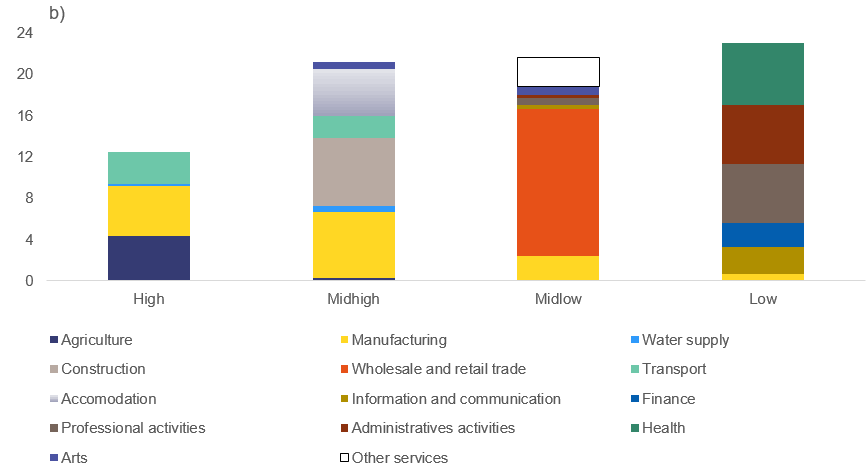
Graph 1.4: (a) Employment by energy intensity in the EU (fourth quarter of 2019 = 100), (b) share of employment by energy intensity and (c) contribution to total employment growth between the fourth quarter of 2019 and the first quarter of 2023 by energy intensity of production
Additional information about graph 1.4
The figure shows the evolution of employment for different sectors, grouped according to their relative level of energy intensity. Following the COVID19 pandemic, employment in the more energy-intensive sectors declined by about 2 % in the second and third quarters of 2020, and again in the first and second quarters of 2021, stabilising about 4 % below their pre-pandemic levels. In sectors with a medium-high level of energy intensity, the fall in employment was more pronounced (8 %), with a temporary recovery in the second half of 2020 and a new decline in the first quarter of 2021. However, employment recovered steadily after that, returning to pre-pandemic levels by the first quarter of 2023. Sectors with medium-low energy intensity followed a similar pattern, albeit less pronounced, with a double-dip between mid-2020 and early-2021 of around 3 %, and a full recovery by early 2023. Finally, after a small contraction in 2020, sectors with low levels of energy intensity display steady growth in employment, reaching in the first quarter of 2023 a level that is 7 % higher compared to the last quarter of 2019.
Note
Energy intensity is measured as tera joules per value added. The different groups were defined by classifying 55 sectors of the economy on the basis of quartiles of sectoral distribution of energy intensity. The quartile measures the spread of values above and below the mean by dividing the distribution into four groups. Seasonally adjusted data. Sectors excluded: mining and quarrying; manufacture of coke and refined petroleum; electricity, gas and air conditioning; public administration and defence and compulsory social security; and education. See Table 1.A1.1 in Appendix 1 for the complete list of sectors. Starting with 2021, people that produce agricultural goods mainly or exclusively for self-consumption are no longer counted as employed. This explains the big drop in employment in agriculture, which particularly affects Latvia, Poland and Romania.
Source
Eurostat, Labour Force Survey, Employment by sex, age and detailed economic activity (from 2008 onwards, NACE Rev. 2 two digit level) – 1 000 (lfsq_egan22d) and Employment by sex, age and economic activity (from 2008 onwards, NACE Rev. 2) – 1 000 (lfsq_egan2); Eurostat, Energy statistics, Key indicators of physical energy flow accounts by NACE Rev. 2 activity (env_ac_pefa04); and Eurostat, National accounts, National accounts aggregates by industry (up to NACE A*64) (nama_10_a64).
Employment developments at the sectoral level differ quite markedly between countries.
EU Member States have different degrees of economic vulnerability to the rise in energy prices, which reflects the structure of their economies and the relative importance of energy-intensive industries, notably manufacturing, in each Member State. This heterogeneity implies that the effect of the energy shock is asymmetric, which could ultimately lead to divergences in employment growth between Member States . Graph 1.4 (c) provides some early evidence of this. The graph shows the contribution to total employment growth by each sector groups (split by levels of energy intensity) for each country. Therefore, it captures the combined effect of the employment growth in each group on total employment. In many Member States, employment stagnated or declined in industries with high energy intensity, while it rose steadily in those with very low energy consumption – in line with the pattern observed for the EU. By contrast, in more than half of the Member States, industries with energy intensity close to the median experienced either a stagnation of employment (industries with mid-low energy intensity) or a decline (those with mid-high energy intensity). A more sophisticated econometric analysis of the effect of the energy price shock on employment (presented in Box 1.1) broadly confirms these results. The majority of the industries with high energy intensity belong to the manufacturing or transport sector (Table 1.A1.1 in Appendix 1). This suggests that divergences in employment growth can arise between EU Member States because of their different industrial specialisations. Countries such as Germany and Italy and eastern European Member States appear more exposed to the risk of an energy shock than more service-oriented economies such as Belgium, Spain, France or the Netherlands.
These developments highlight the importance of accelerating the green transition to support employment growth.
Reducing the consumption of fossil fuels, notably by promoting investments into renewables and energy efficiency, increases the resilience of the EU economy against the energy shock while contributing to the goal of reaching climate neutrality, which was put forward by the European Green Deal and enshrined in the European climate law . Achieving this target requires action across all sectors of the economy, in particular those that are most energy intensive, with the adoption of new technologies, production processes and business models. This transition will inevitably imply job changes within sectors and occupations and reallocations across between and regions, but will also create opportunities for job creation . In March 2023, the Commission put forward the Green Deal industrial plan for the net-zero age, which aims to strengthen the manufacturing capacity of net-zero technologies in Europe notably through a simplified regulatory environment, faster access to funding and guaranteed availability of critical raw materials .
Box 1.1: Impact of the energy crisis on sectoral employment
The energy crisis, exacerbated by the Russian war of aggression against Ukraine, created concerns about the possible impact on the EU economy.Because of the high dependency of the EU economy on Russian gas, the decline in its imports has been a serious constrain for European companies. On average, at the EU level the prices of electricity and gas (net of taxes) increased by 68.5 % and 173 %, respectively, between the first quarter and the third quarter of 2021. Although the surge in energy prices hit all countries and sectors, its effects are likely to have been heterogeneous, as energy dependency can vary substantially between industries and Member States (European Commission, 2022b).
The employment effect of an energy shocks depends on the capacity of firms to adjust to it.As illustrated by Fontagné et al. (2023), based on a sample of French manufacturing firms over the 2005-2019 period, companies adjust to an energy price shock through multiple channels. First, firms pass the full impact of the rising energy costs on to their selling prices; this reduces the demand for their products, output and employment. Moreover, multi-plant firms relocate their production towards more efficient plants; in this case, firms reduce energy consumption more in the event of a gas price shock than an electricity price shock, which is consistent with the findings of European Commission (2022b). They also show that, at the time of the 2022 shock, the elasticity of energy demand to energy price had gone down, which is consistent with the selection of less efficient firms. Data from the French National Institute of Statistics and Economic Studies (INSEE) show that the increase in the wholesale price of energy may affect firms differently depending on the duration of the contract they have with their energy providers, the existence of regulated tariffs and the firms’ characteristics (e.g. INSEE, 2022). Evidence for the euro area (ECB 2023; Chiacchio et al., 2023) shows that an adverse energy shock can cause a drop in intermediate domestic output and an increase in intermediate imports from countries that are less dependent on global energy production; importing intermediate products helps companies to continue to produce final products domestically and limits the negative impact of the energy price rise.
While overall employment has been broadly unaffected by the energy shock, asymmetrical effects can be identified between both sectors and countries.The variation in the degree of energy intensity (energy consumption as a percentage of value added) can be used to identify the average effect on employment of the energy shock. The idea is to look at employment changes at the time of the shock between 56 industries with different exposures to the shock due to differences in energy intensies and exposure to Russian gas imports, after netting out all changes attributable to pre-shock trends and constant differences in employment between industries or Member States. Both the energy intensity and exposure to Russian exports exhibit variability only between sectors or countries. Therefore, changes in the gross value added do not affect the variety in the energy intensity. Energy shock effects are tested as a structural break in the time series with treatment variable being energy intensity and exposure to Russian exports.
Sectoral data do not allow controlling for possible differences between firms in the same sector.The panel estimation controls for industry, country and time fixed effects. The estimated effects therefore take into account industry-specific factors (common to all countries) controlling for features that differ across countries but do not change over time (e.g. the structure of the national energy markets). If this is the only type of heterogeneity, the estimates are unbiased. If, instead, there are further changes within the same industries (e.g. some firms being able to get better energy contracts or to better reorganise their production), then the estimates might be biased. However, it is likely that firms that were better prepared to cope with the energy price shock had signed ‘better’ contracts before the shock arrived. This possibility may be related to the fact that they belong to industries where the degree of domestic and foreign competition is strong, which makes them particularly attentive to costs factors. In such a case, this would be captured by the industry fixed effects (as firms located in different countries but belonging to the same industry perceive the same cost competitiveness constraints). This argument is valid on average, and it does not exclude that some firms within the most dynamic industries may have been more affected than others.
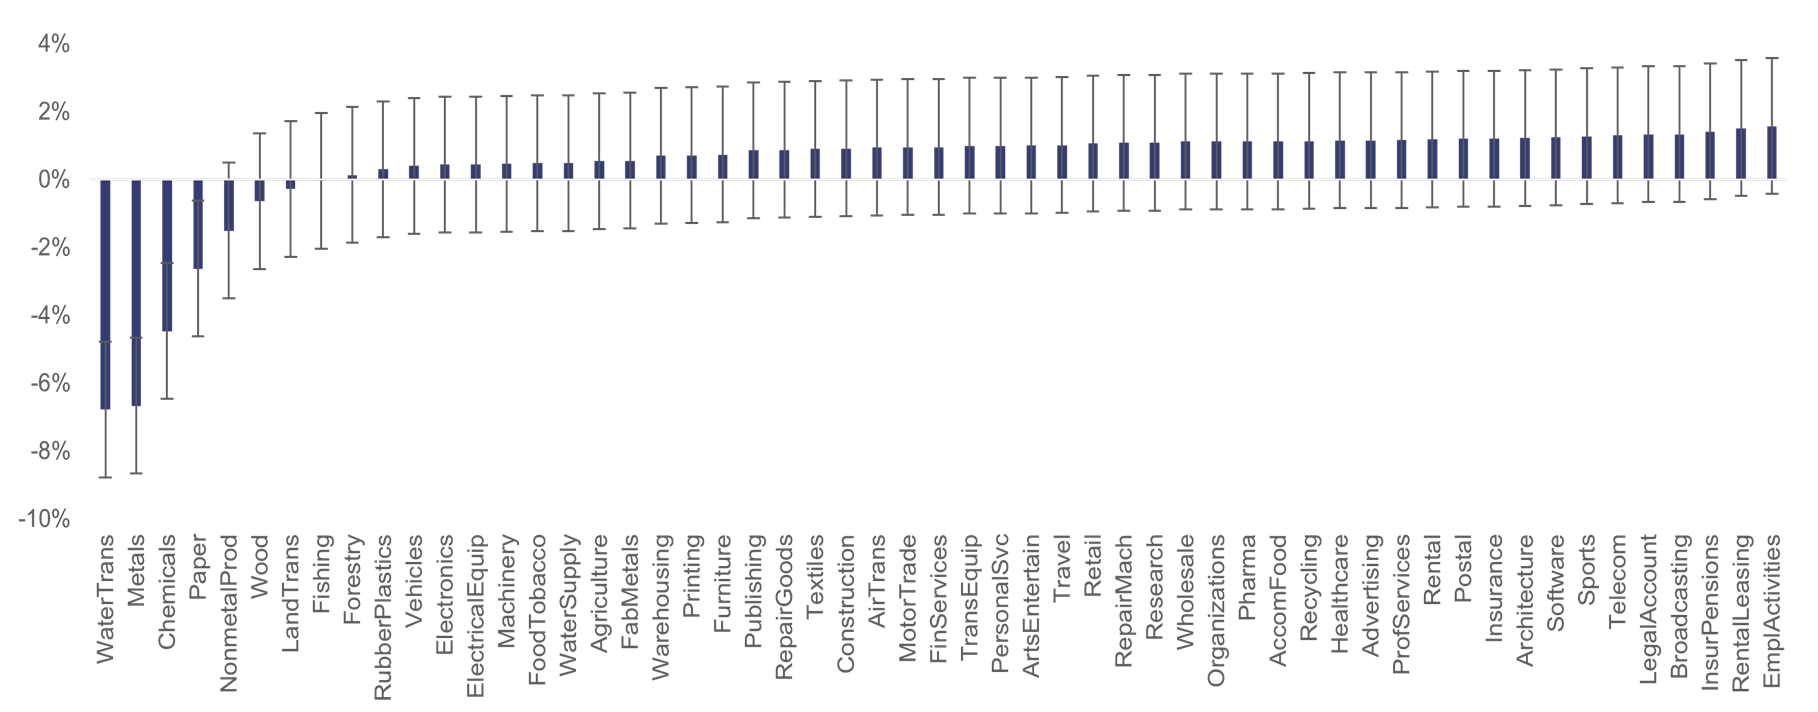
Higher energy intensity is associated with lower employment growth.Regression results (not shown for brevity) identify a negative employment effect of the energy shock in sectors with high energy intensity compared with sectors with low energy intensity: those sectors with very high energy consumption experience lower employment growth (everything else equal), while those with very low energy intensity have better employment outcomes. Among Member States, central and eastern EU countries experience negative employment outcomes, whereas for western and Mediterranean EU countries employment expanded during the shock (Graph 1), predominantly due to their lower dependence on Russian gas imports, as well as having a lower share of energy-intensive industries, which were more affected by the energy shock. By sector, the water transport, metal, chemical, paper and non-metal mineral industries experienced the most negative effects on employment (Graph 2).
Graph 1: Energy shock employment effects between countries

Note
The graphs show the response of employment at the time of the energy shock by industry and country, estimated with a panel regression that controls for country, sector and period fixed effects. The regressions test for a structural break after the gas price shock (first quarter of 2022) by using a shock dummy (equal to 1 after the first quarter of 2022) and its interaction with the indicators of energy intensity in 2020 and of the country-wide exposure to Russian gas imports as percentage of total gas consumption (at an average of 4 years prior to the energy shock). Standard errors are clustered by unique combination of country and NACE sector, to allow for autocorrelation. Energy producing sectors are dropped, leaving 56 industries in total for the period 2008-2022. Number of observations: 75 764. Regression results available on request.
Graph 2: Energy shock employment effects between sectors
Evolution of the labour supply
The strong labour market performance currently observed is also due to the resilience of the labour supply.
As shown in Graph 1.5, the activity rate in the EU had been growing steadily for more than a decade. This positive trend was only temporarily interrupted by the COVID-19 pandemic: the activity rate (of those aged 15-74) dropped from 64.1 % to 62.1 % between the fourth quarter of 2019 and the second quarter of 2020, but rebounded quickly, reaching 65.3 % in the second quarter of 2023 – slightly above the pre-pandemic trend. This level is in line with the (pre-pandemic) long-term trend of rising labour market participation. The strength of the EU’s labour supply is good news: a steady increase in the activity rate raises GDP per capita and potential growth; it reduces the dependency ratio, thus alleviating its growing burden on welfare policies; it increases social inclusion and earned incomes; and it limits wage pressures when labour demand is increasing . It is also a precondition for reaching the EU employment rate target set in the European Pillar of Social Rights action plan .
Graph 1.5: Activity rate in the EU and the United States
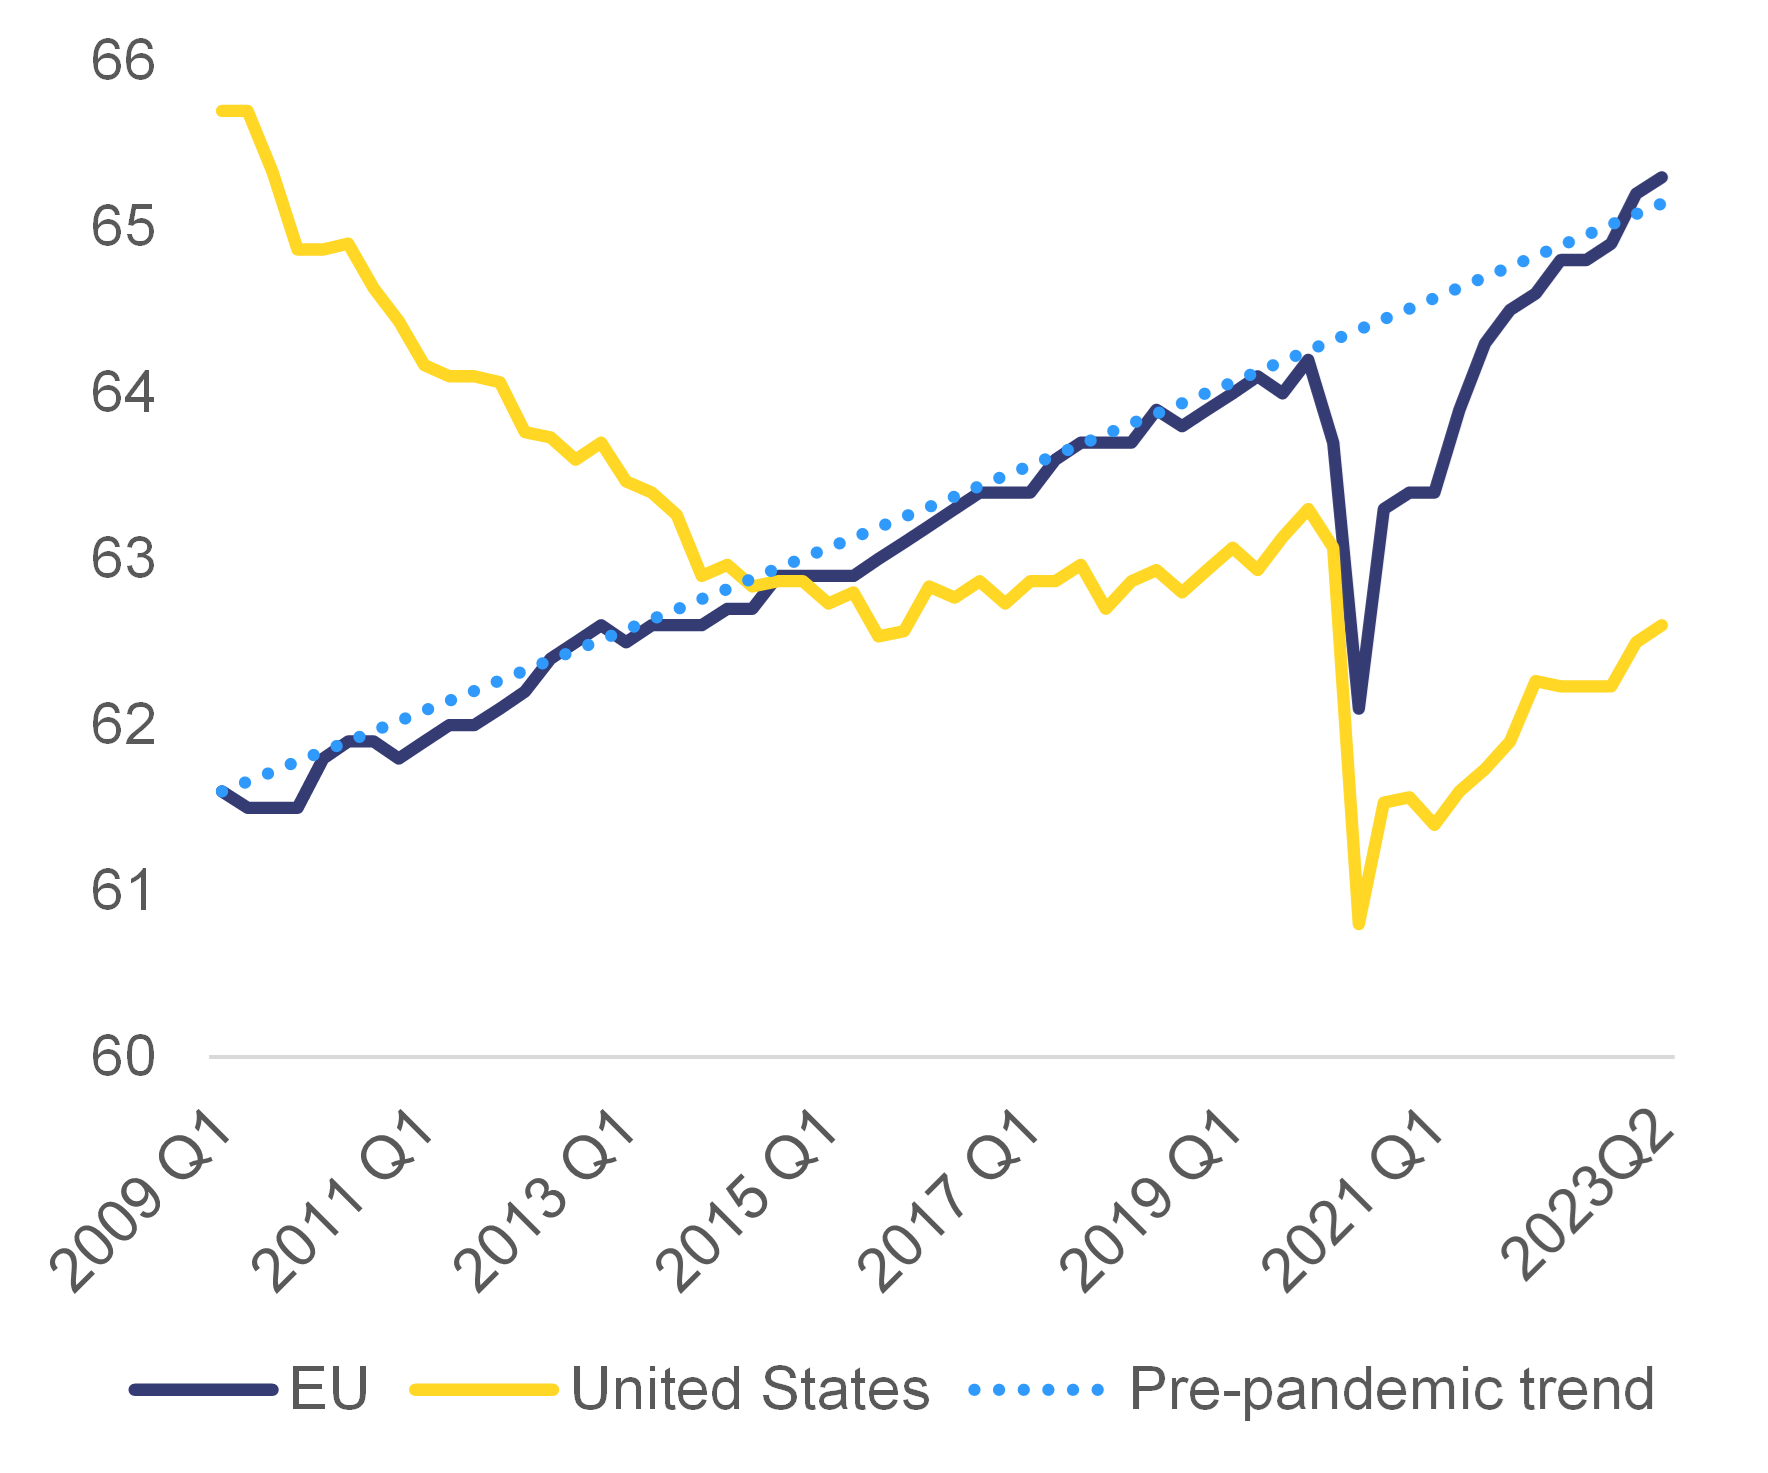
Additional information about graph 1.5
The figure displays the activity rate of those aged between 15 and 74 in the EU and the United States, between the first quarter of 2009 and the second quarter of 2023. The activity rate has been growing steadily in the EU. The pre-pandemic trend shows a continuous increase from 61.6 % in the first quarter of 2009 to 65.3 % in the second quarter of 2023. The positive trend in the EU was only temporarily interrupted by the COVID-19 pandemic. It caused a drop from 61.1 % to 62.1 % between the fourth quarter of 2019 and the second quarter of 2020. Then it increased again to 65.3 % in the second quarter of 2023. Regarding the activity rate in the United States, a long-term decline can be observed. Four phased can be distinguished: The activity rate declined from 65.7 % the first quarter of 2009 to 62.5 % in the third quarter of 2015. Then it slowly increased again to 63.3 % in the fourth quarter of 2019. The COVID-19 pandemic led to a drop of activity to 60.8 % in the second quarter of 2020. After that, the activity rate recovered to 62.5%. This recovery was slower than in the EU.
Note
The activity rate is the share of the population aged 15-74 who are either employed or actively searching for a job.
Source
Eurostat, Labour Force Survey, Employment and activity by sex and age – quarterly data (lfsi_emp_q); and US Bureau of Labor Statistics.
The increase in the overall activity rate is significant, given that population ageing acts as a drag on labour market participation.
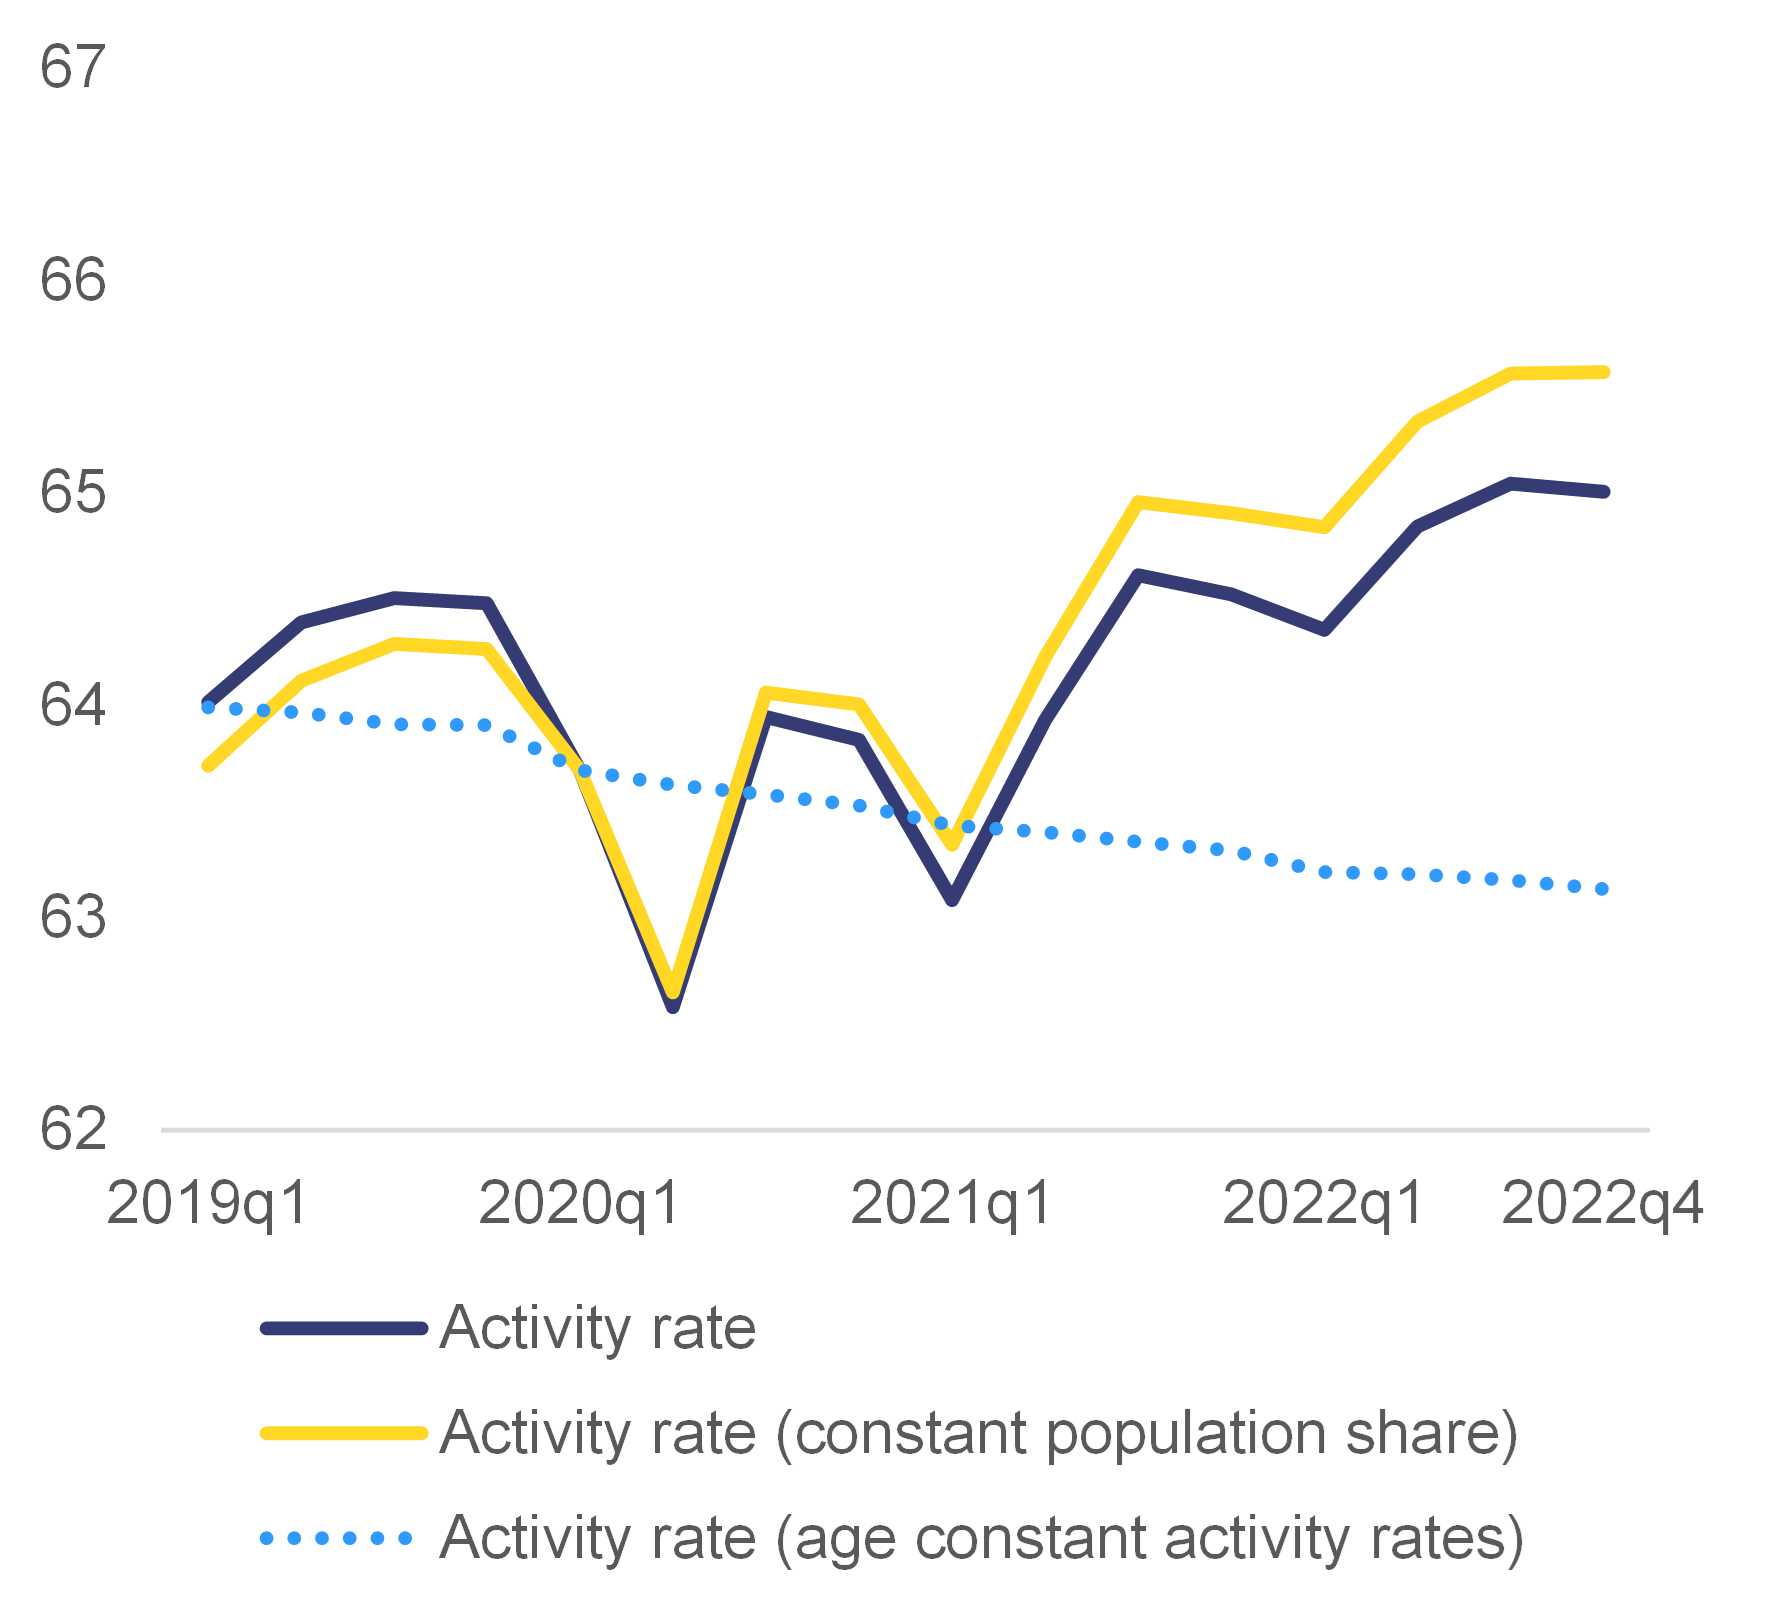
The profile of the activity rate by age is hump-shaped: first, it increases with age among young workers, then it stabilises at a high level for prime-age workers and finally it declines with age among older workers. Therefore, population ageing (which leads to an increased share of older workers, who have lower activity rates) puts downward pressure on the overall activity rate. In this regard, the developments in the overall rate are determined by shifts in the age-participation profile and by changes in the relative weight of each age group. To identify the importance of these shifts, Graph 1.6 compares the actual rate with that obtained assuming the structure of the population stays constant at the levels of the first quarter of 2020. Graph 1.6 shows that the activity rate at the end of 2022 would have been about 0.6 percentage points higher if the age structure of the population had remained the same as in the first quarter of 2020.
Graph 1.6: Effect of demographic change on the activity rate
Note
The constant population share activity rate is the age-adjusted activity rate obtained holding constant the population share (as observed in the first quarter of 2020) and allowing the activity rate within age group to vary. The age constant activity rates represent the total activity rate assuming that the activity rate remains fixed at its level of the first quarter of 2020, while the share of each age group changes as observed in the data. The former indicates the hypothetical activity rate independent from the change in the age structure of the population. The latter represents the hypothetical activity rate due only to changes in demographics.
Additional information about graph 1.6
The figure displays the effect of demographic change on the activity rate, between the first quarter of 2019 and the fourth quarter of 2022. Three graphs are shown: First, the actual activity rate. Second, the constant population share activity rate, which is the age-adjusted activity rate obtained, holding constant the population share (as observed in the first quarter of 2020) and allowing the activity rate within each age group to vary. Thirdly, the age constant activity rate, which represents the total activity rate, assuming that the activity rate remains fixed at its level of the first quarter of 2020, while the share of each age group changes as observed in the data.
The actual activity rate declined from 64.5 % in the fourth quarter of 2019 to 62.6 % in the second quarter of 2020. From then on it recovered slowly to 65.0 % in the fourth quarter of 2022. A similar development shows the activity rate, which holds the population share constant. It decreased from 64.3 % in the fourth quarter of 2019 to 62.6 % in the second quarter of 2020. Afterwards it recovered slightly faster than the actual activity rate and reached 65.6 % in the fourth quarter of 2022. The graph for the age constant activity rate shows a continuous decline. While it stood at 64.0 % in the first quarter of 2019, it had decreased to 63.1 % in the fourth quarter of 2022.
Source
Own calculations based on Eurostat, Labour Force Survey, Population by sex, age, citizenship and labour status (1 000) (lfsq_pganws).
The resilience of the EU’s labour supply is due to various factors, notably the increase in activity rates of women and older workers.
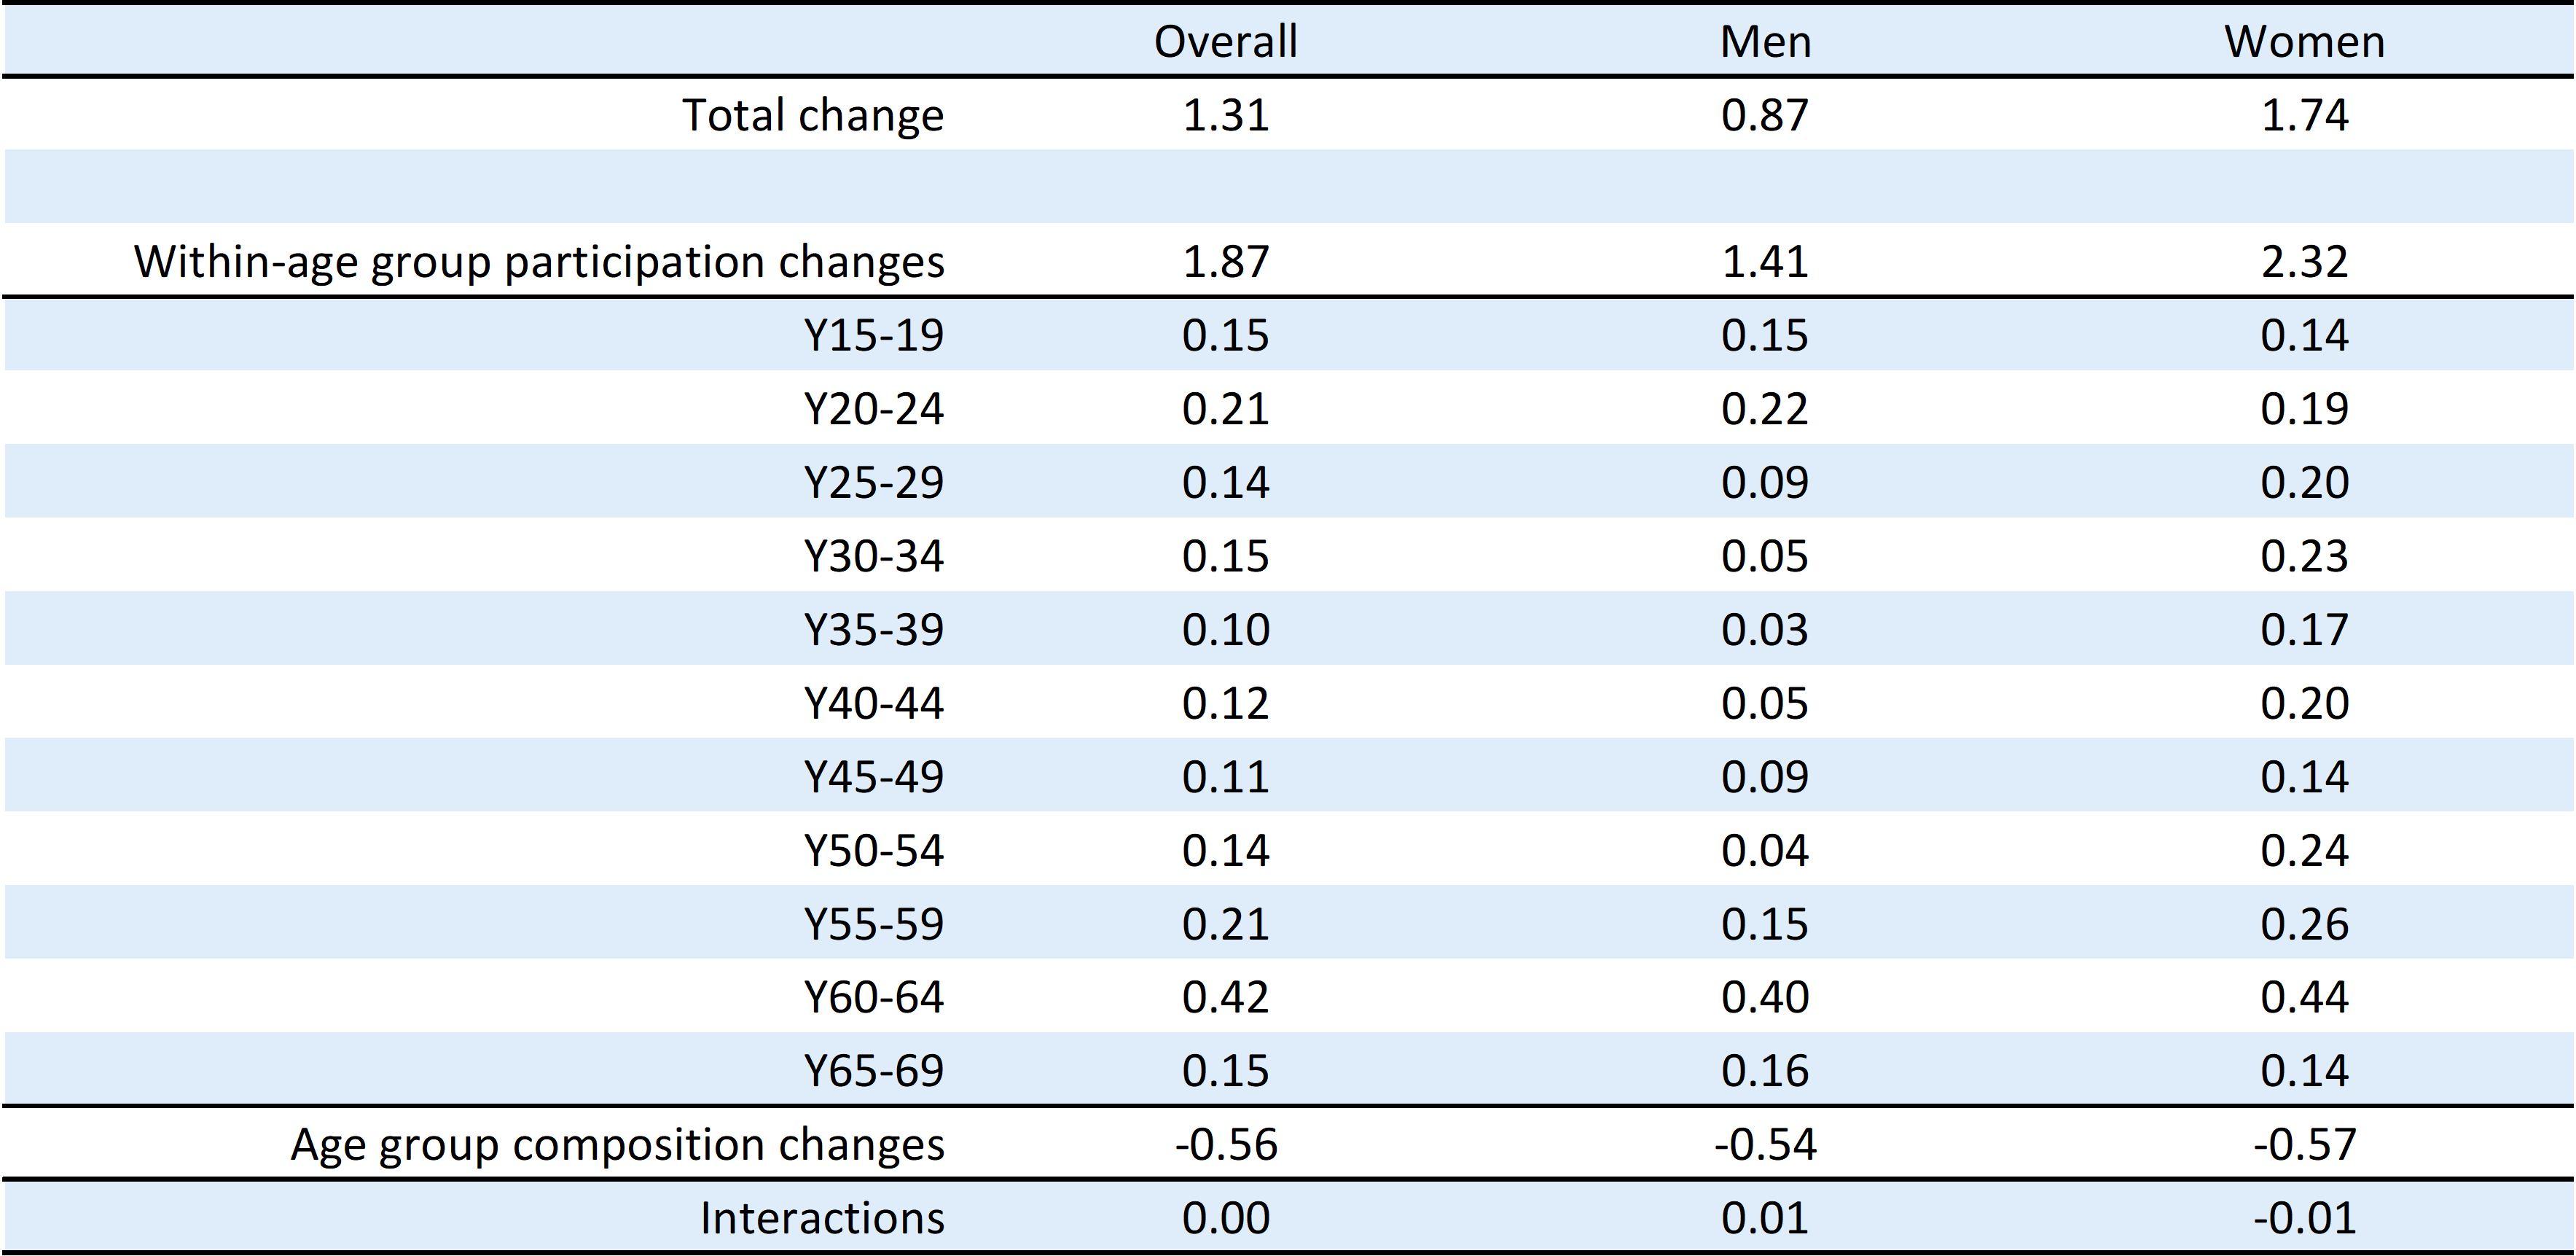
The extensive use of job-retention schemes throughout the pandemic helped preserve the labour market attachment of workers (since, when people become unemployed, they are more likely to leave the labour force). In addition, the increase in the overall activity rate has been driven to a large extent by the increased labour market participation of women and of older workers. Between the first quarter of 2020 and the fourth quarter of 2022, the activity rate of men increased by 0.87 percentage points, while that of women by 1.74 percentage points (see Table 1.2). While participation rates increased for all age cohorts, most of the increase for men came from the older age group (aged 60-64) (+ 0.40 percentage points); in the case of women, while the group aged 60-64 was also the highest contributor (+ 0.44 percentage points), the increases in participation were significant for all other age groups. Policies aimed at improving work-life balance, reducing the gender pay gap and increasing the effective retirement age are thought to have contributed positively to this development.
The resilience of the EU’s labour supply is due to various factors, notably the increase in activity rates of women and older workers.
The extensive use of job retention schemes throughout the pandemic helped preserve the labour market attachment of workers (since, when people become unemployed, they are more likely to leave the labour force). In addition, the increase in the overall activity rate has been driven to a large extent by the increased labour market participation of women and of older workers. Between the first quarter of 2020 and the fourth quarter of 2022, the activity rate of men increased by 0.87 percentage points, while that of women by 1.74 percentage points (see Table 1.2). While participation rates increased for all age cohorts, most of the increase for men came from the older age group (aged 60-64) (+ 0.40 percentage points); in the case of women, while the group aged 60-64 was also the highest contributor (+ 0.44 percentage points), the increases in participation were significant for all other age groups. Policies aimed at improving work-life balance, reducing the gender pay gap and increasing the effective retirement age are thought to have contributed positively to this development.
Table 1.2:Contribution to the overall participation rate of changes in age specific participation rates and in the structure of the population, 2020Q1-2022Q4
Note
The change in the overall participation rate between two periods equals the weighted average of the change in the participation rates of mutually exclusive age groups with weights being the share of each group in total population in the first period (within age group effect) plus the contribution of the change in the age specific shares multiplied by the participation rate of each group at the beginning of the period (age group composition effect) plus a residual factor that represents the effect of the interaction of the change in the age-specific shares and in the age specific participation rates (interaction effect).
Source
Own calculations based on Eurostat, Labour Force Survey, Population by sex, age, citizenship and labour status (1 000) (lfsq_pganws).
Additional contributions to increasing labour market participation have come from EU mobile workers and increased migration.
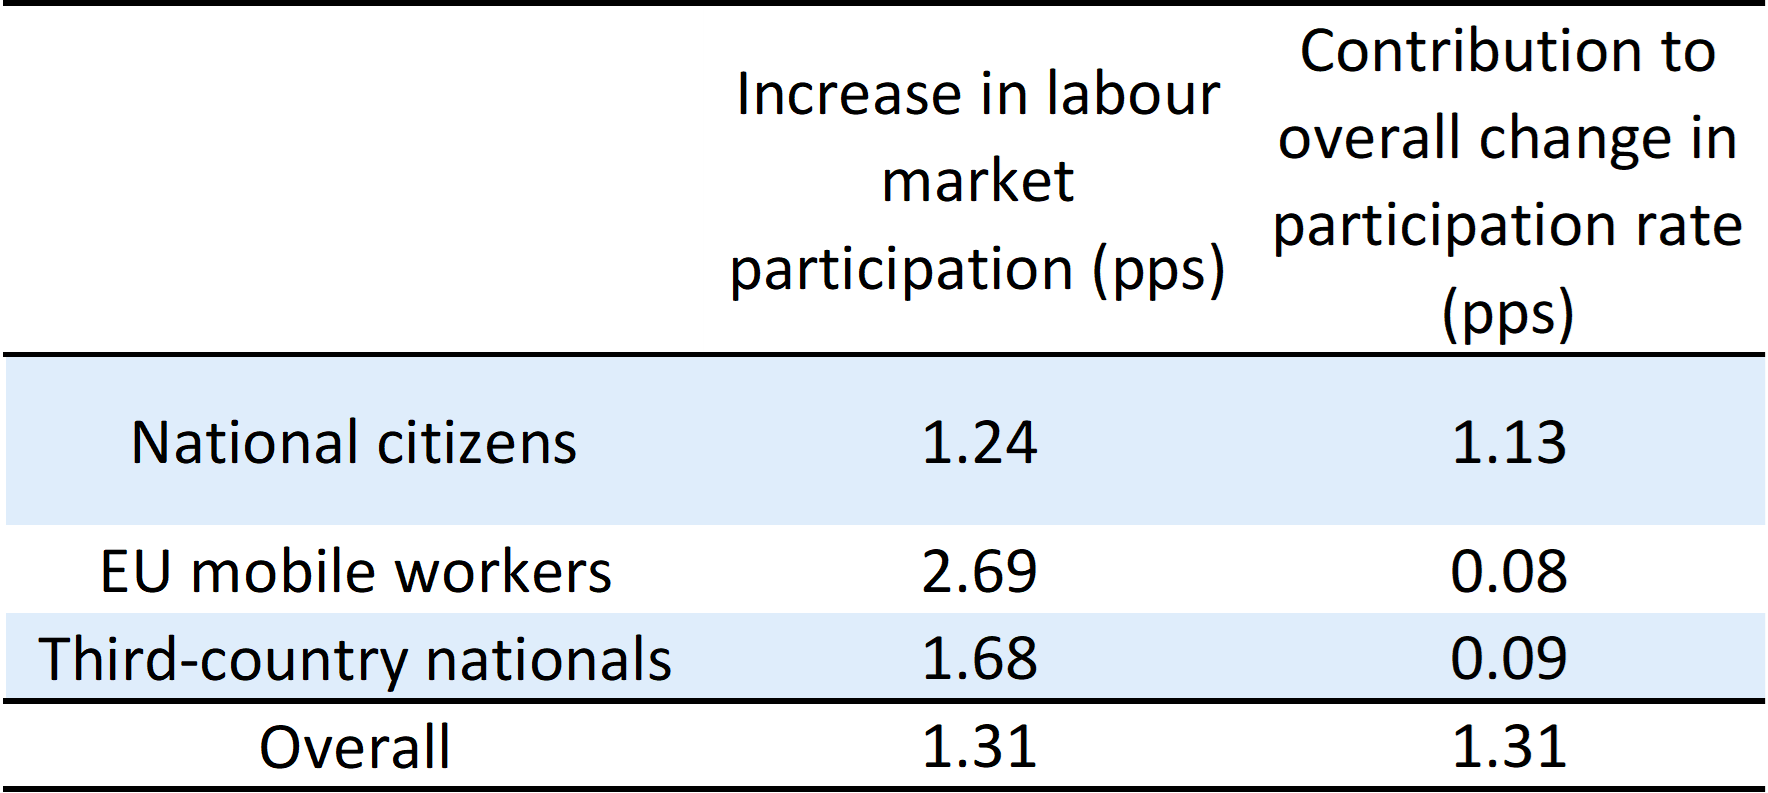
Between 2020 and 2022, EU mobile workers and non-EU nationals registered stronger increases in labour market participation compared to own-country nationals. While EU mobile workers account for only 3 % of the total population (stable over time), and the share of non-EU nationals in the total population is 5.6 %, the groups contributed to raising the overall activity rate by 0.08 and 0.09 percentage points respectively (i.e. 14 % of the overall increase in participation). This highlights the importance of mobility and migration to sustaining the labour supply and offsetting the impact of population ageing.
Table 1.3:Increase in labour market participation and contribution to the overall increase in participation rate, by citizenship, 2020–2022
Source
Own calculations based on Eurostat, Labour Force Survey, Population by sex, age, citizenship and labour status (1 000) (lfsq_pganws).
The increase in labour market participation after the pandemic accounted for two thirds of the observed employment growth, more than compensating for the negative effects of ageing on employment.
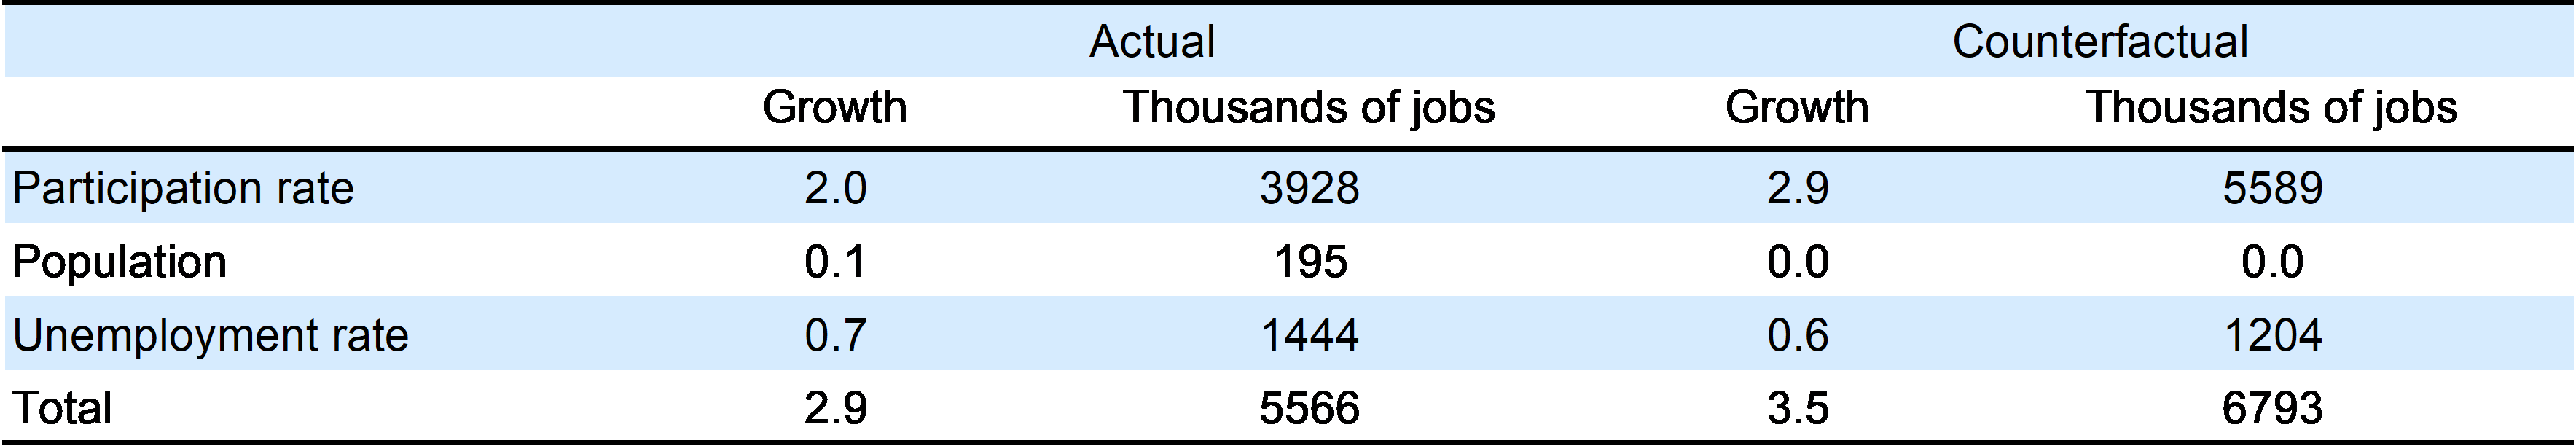
Table 1.4 breaks down the employment growth observed between the first quarter of 2020 and the fourth quarter of 2022 into three components: changes due to total population growth, changes due to variation in unemployment and participation rates. Over this period, the decline in the unemployment rate translated into an increase of employment by 0.7 %, equivalent to an increase of about 1.4 million jobs. The increase in the participation rate contributed 2 % to total employment growth, or almost 4 million jobs, while the growth of the total population added only 0.1 %. By contrast, the same decomposition based on a counterfactual scenario that keeps the age structure of the population constant shows that, without population ageing, the increased labour market participation rate would have contributed almost 3 % to total employment growth; this is about 1.5 million jobs more than in the actual scenario. This table conveys two main messages. First, the increase in the age-specific participation rates contributed largely to the increase in total employment growth. Second, the size of this increase was limited by the increase in the share of older workers. Since older workers have lower participation rates than other age groups, the increase in their participation rate was outweighed by the increase in their share in the population.
Table 1.4:Contribution to total employment growth: 2020Q1-2022Q4
Note
The decomposition is based on the following approximation ∆log Et ≅∆log 1-ut +∆log PRt +∆logPOPt. Therefore, all contributions are in percentage and not in percentage points. The table transforms percentage point changes in the unemployment and participation rate in percentage employment growth. When the participation rate does not change, employment growth moves in lockstep with the negative of the unemployment rate. The counterfactual columns show the effect on employment of changes in the participation and activity rates with unchanged age structure of the population and the labour force (i.e. due to changes in the age-specific rates).
Source
Calculations based on Eurostat, Labour Force Survey, Population by sex, age, citizenship and labour status (1 000) (lfsq_pganws).
A broad set of policies is needed to support labour force participation.
The design of the tax and benefit system can strongly influence financial incentives to work, especially for second earners and for low-income households. Measures promoting the reconciliation of family life with working life, including flexible working arrangements and affordable high-quality early childhood education and care, can contribute greatly to women’s labour market participation and reduce the gender employment gap. Flexible and secure contractual arrangements can also contribute to reducing the risks of unemployment, which helps to reduce exits from the labour force. Better working conditions and adequate wages also contribute to high labour force participation. Moreover, public employment services need to have adequate capacity to provide jobseekers with effective support through counselling, job search assistance and other activation measures. In addition, investing in the upskilling and re-skilling of the workforce is crucial to helping workers to adapt to an increasingly dynamic labour market and contributes to keeping people in the labour force. Finally, supportive migration and mobility policies that attract workers with the right skill sets also contribute to the growth of the labour supply ( ).
Evolution of labour demand
Until the beginning of 2023, the EU’s labour demand had remained strong, contributing to tight labour market conditions with very low unemployment and significant labour shortages.
Labour shortages exist when employers cannot find the workers needed to fill vacancies. This occurs when the demand for labour exceeds the available supply for a given skill set, at a particular level of wages and working conditions, at a specific location and point in time . In 2022 and at the beginning of 2023 the euro area job vacancy rate (i.e. the proportion of total posts that were vacant) hovered around 3 % – the highest level since 2008 when the series was first published. Similarly, data from the EU Business and Consumer Survey show that, at the beginning of 2023, labour shortages were still above their pre-pandemic levels, on average, in all sectors and countries .
However, some differences can also be seen at the Member State level and between sectors.
The job vacancy rate declined by 1 percentage point in Finland and Sweden in 2022, and relatively strong declines (of at least 0.5 percentage points) have also been observed in Belgium, Czechia, Cyprus, Hungary, the Netherlands, and Slovenia. From a sectoral perspective, labour shortages eased in the first few months of 2023 in industry: in April 2023, about one quarter of firms in the industry sector indicated shortages of labour as a factor constraining production, down from almost one third a year earlier . By contrast, high labour shortages continued to be reported in services, with 34 % of firms indicating that they could not expand production due to the lack of labour – this is the highest recorded value for the indicator.
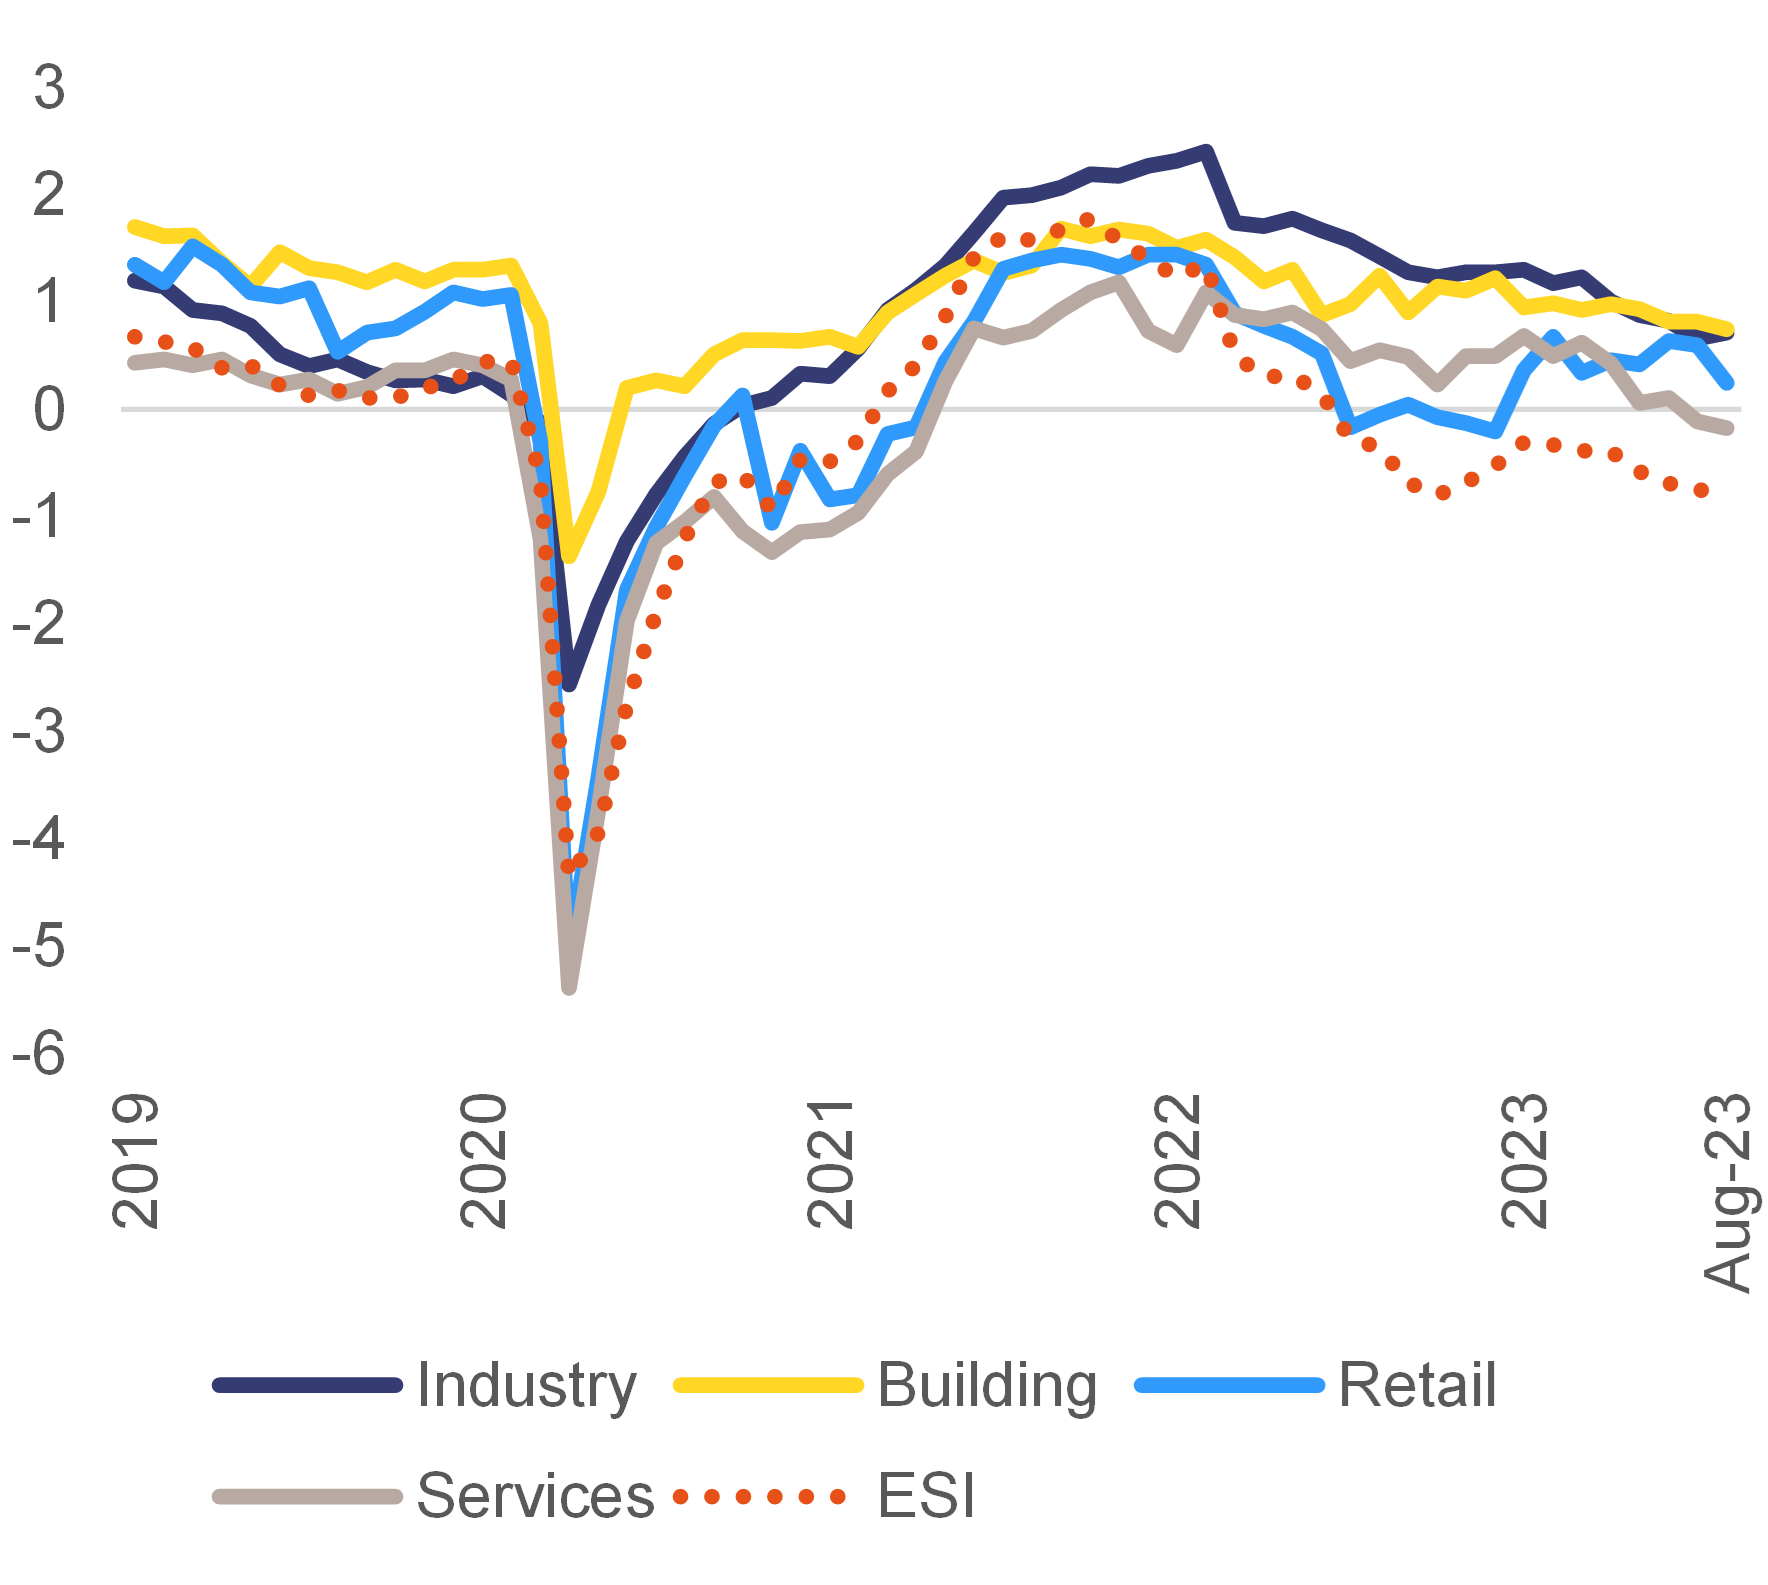
Graph 1.7: Business economic sentiment indicator (ESI) and employment expectations by sector
Additional information about graph 1.7
The chart shows, monthly, the economic sentiment indicators together with the survey-based indicators of employers hiring intentions in industry, building and retail. After a recovery towards the end of 2022 and until January 2023, overall economic sentiment and employers’ hiring intentions have been falling again in the following [four] months of 2023. Employment expectations for the following three months deteriorated in particular in the industry and retail sectors, while they have been stagnating in construction and retail.
Note
ESI, economic sentiment indicator. Seasonally adjusted standardised data.
Source
European Commission, Business and Consumer Surveys.
The most recent business surveys point to a potential slowdown of labour demand.
After a recovery towards the end of 2022, overall economic sentiment and employers’ hiring intentions fell again in the subsequent eight months of 2023 (Graph 1.7). Employment expectations deteriorated particularly in the industry and services sectors, while they have stagnated in construction and retail.
A further indication that the labour market is cooling down is provided by the evolution of new hires and by the number of vacancies posted on-line.
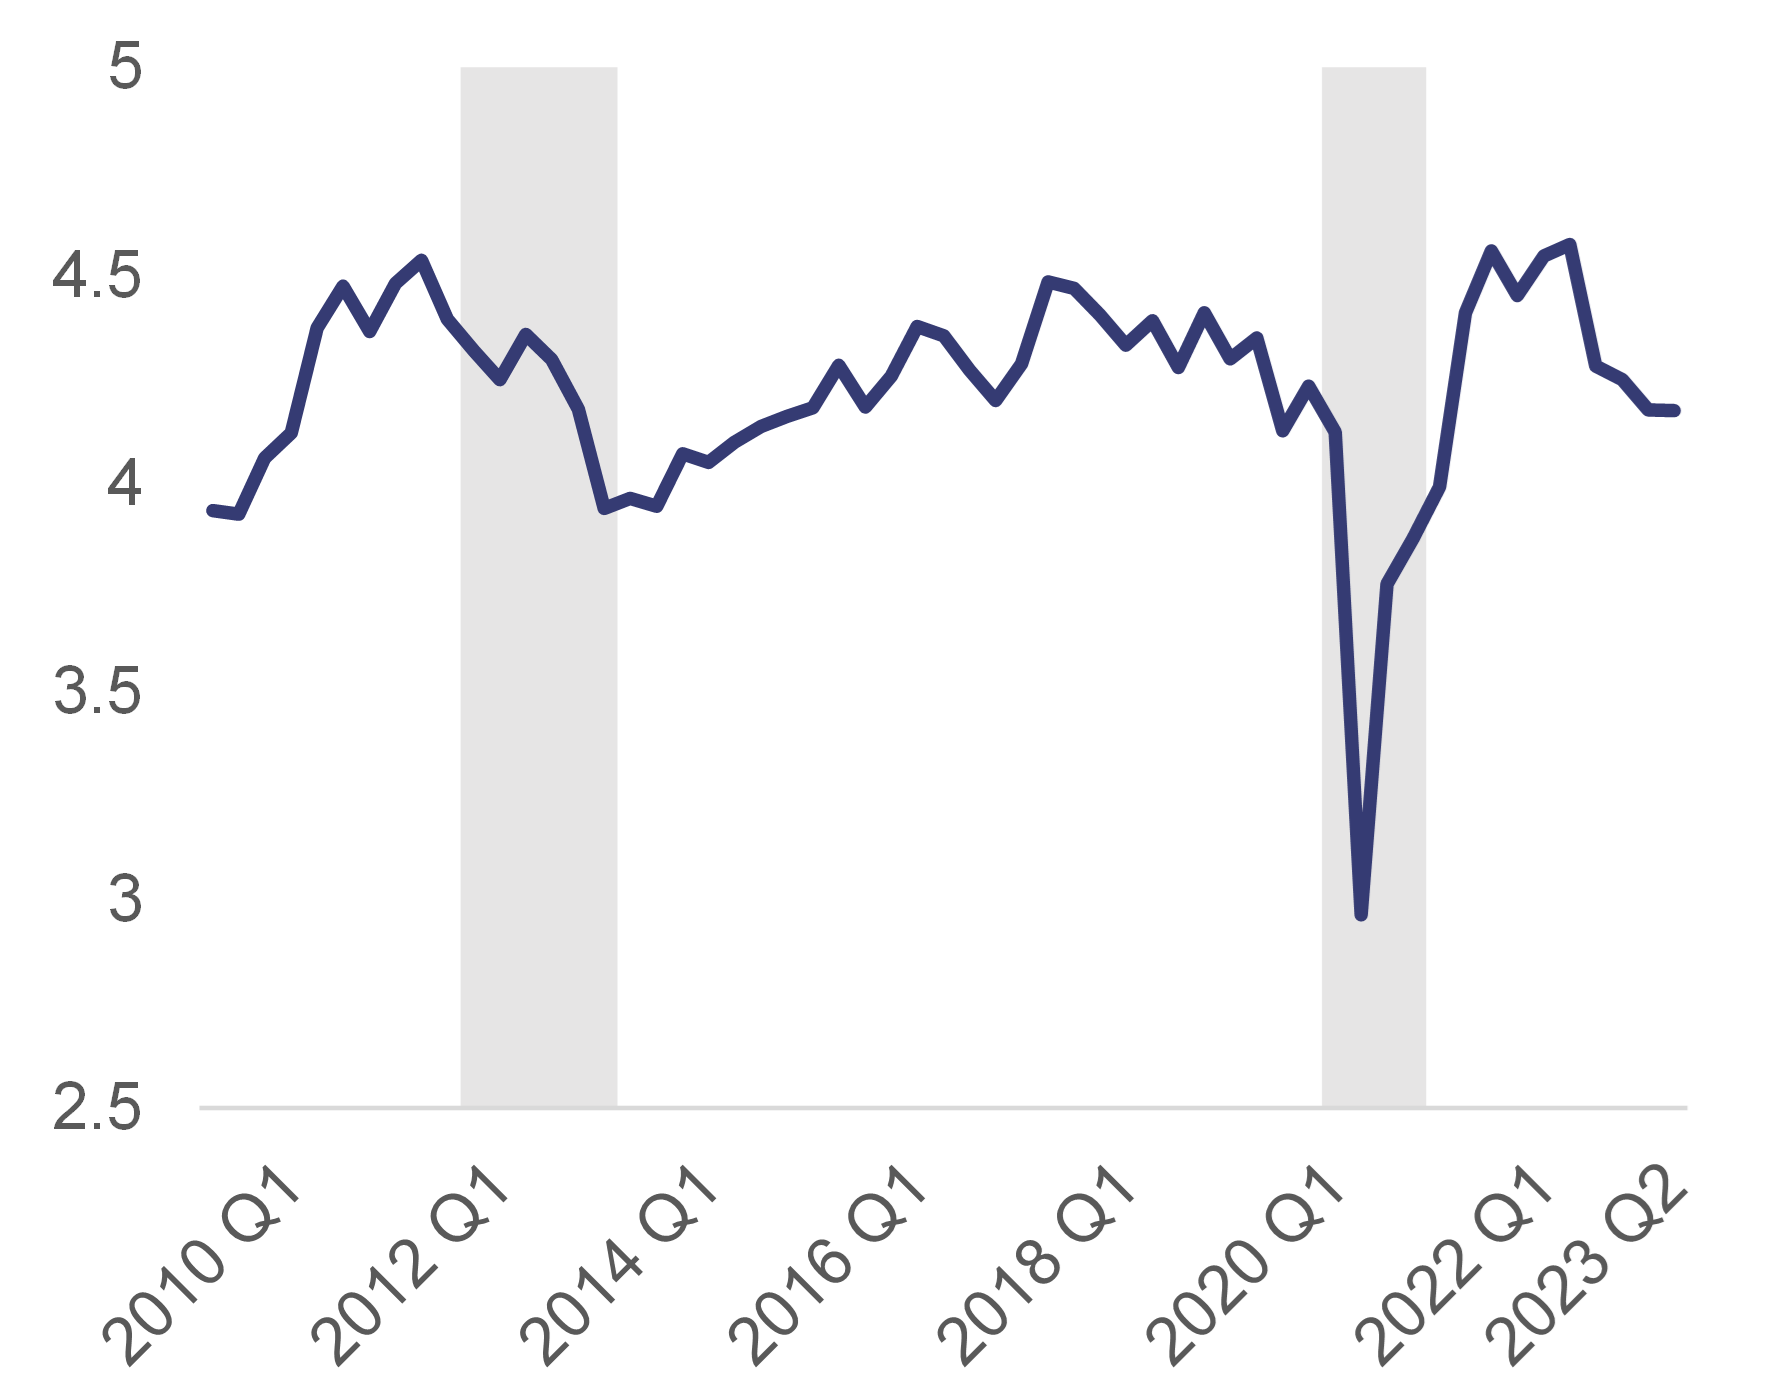
The share of recent job starters (i.e. those individuals who started their employment in the last 3 months) is a good proxy of recruiting intensity. As shown in Graph 1.8, the share of recent job starters dropped significantly in summer 2022 and stagnated until the first half of 2023, which implies that employers were less active in recruiting new personnel. This suggests that the good employment performance observed so far has been to a large extent the result of an increase in the job tenure of workers who were already employed (i.e. a reduction in the rate of dismissals) . Similarly, high-frequency data on on-line job vacancies posted on platforms such as LinkedIn show a significant decline in the first few months of 2023 (even if the ratio of job openings to active applicants was still above pre-pandemic levels) .
Graph 1.8: New job starters as a percentage of employment in the previous quarter: 2009-2023
Additional information about graph 1.8
This figure describes the share of recent jobs starters in comparison to the employed population in the previous quarter. Data is displayed from the first quarter of 2009 to the fourth quarter of 2022. The development of the graph on job starters can be divided in six phases. In a first phase, the amount of job starters rose from 3.9 % in the first quarter of 2009 to 4.5 % in the second quarter of 2011. Then it dropped again to 3.9 % in the first quarter of 2013. After that it increased slowly to 4.5 % in the second quarter of 2017, followed by another slow decrease to 4.1 % in the first quarter of 2020. During the COVID-19 pandemic, the share of recent job starters faced a sharp decrease to 3.0 % in the second quarter of 2020. The share of job starters recovered quickly, reaching a peak of 4.6 % in the third quarter of 2021. From then on, there has been a slight stagnation to 4.3 % in the fourth quarter of 2022.
Note
Recent job starters are individuals who reported starting their employment within the last 3 months before the interview.
Source
Eurostat, Labour Force Survey, Recent job starters by sex and age – quarterly data (lfsi_sta_q) and Employment and activity by sex and age – quarterly data (lfsi_emp_q).