General labour market conditions in the EU and its Member States
Outlook for unemployment
The EU unemployment rate, which is currently at its lowest levels, could be affected by the slowdown of economic growth.
As illustrated in the previous sections, the EU labour market entered 2023 in a very strong position. This good performance reflects not only the developments of labour supply and demand, but also the underlying flows into and out of unemployment. This section discusses how these factors may affect the labour market outlook. Specifically, it examines the consequences for unemployment if economic growth returns to more moderate levels after the strong post-pandemic surge, thus exploring the risks of a possible increase in unemployment due to a drop in labour demand.
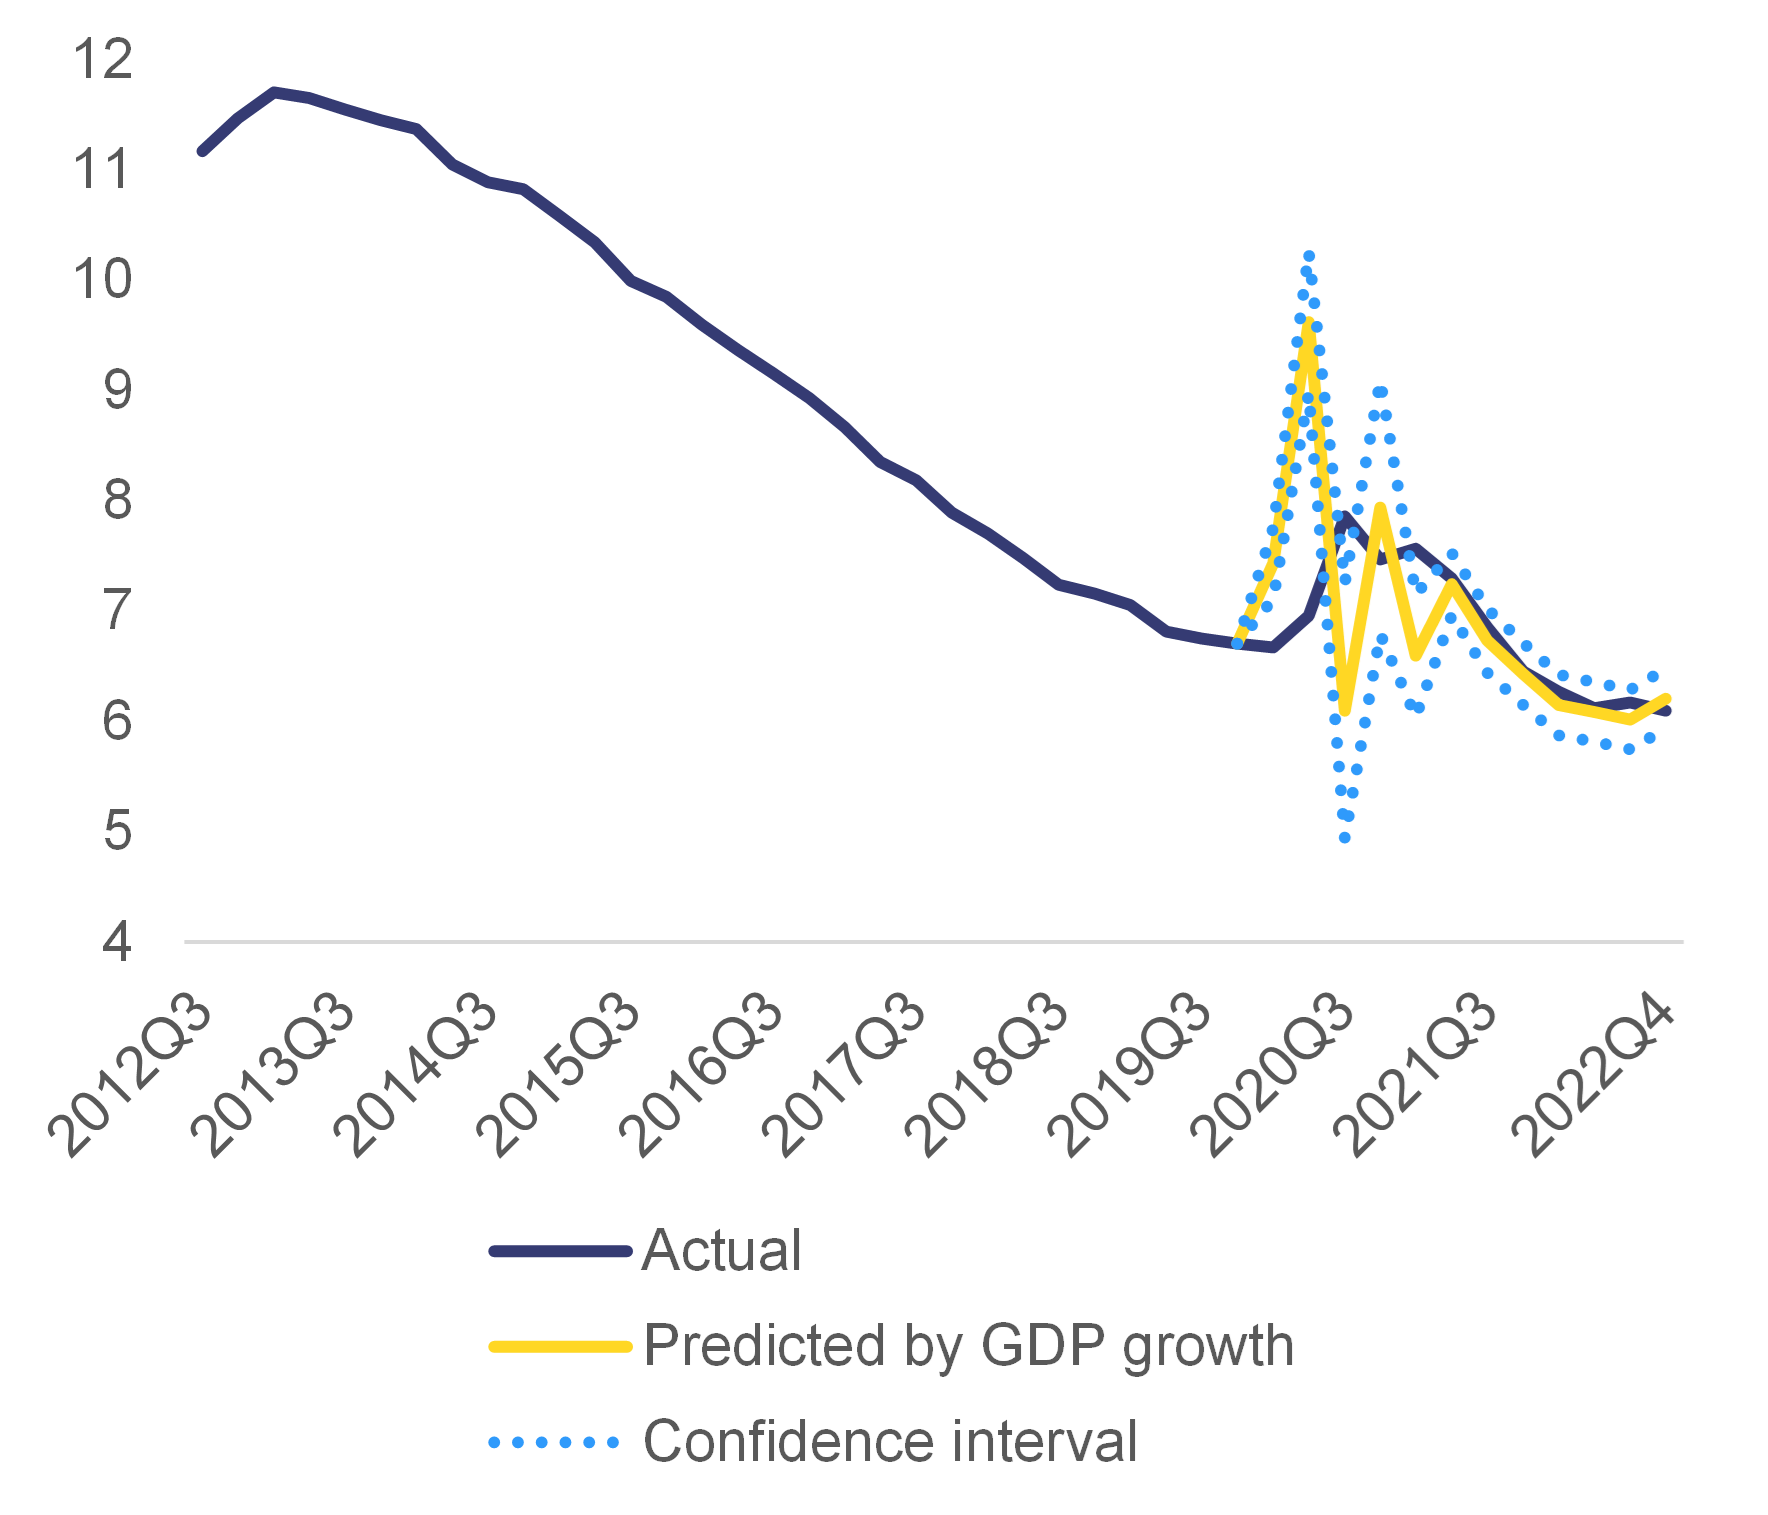
Graph 1.9: EU unemployment rate (%)
Additional information about graph 1.9
The figure plots a line showing the evolution of the EU unemployment rate over time. From a peak of 11.7% in the first quarter of 2013, actual unemployment declines steadily to reach 6.7% the first quarter of 2020. It then increases to 7.8% in the third quarter of 2020 following the Covid19 pandemic. It then falls back again as of the second quarter of 2021, stabilising at about 6% from the second quarter of 2022 onwards. From the last quarter of 2019, the graph shows an additional line plotting the unemployment rate predicted based on current and past GDP growth, as well as its confidence interval. This prediction is largely off-track during the pandemic period between the first quarter of 2020 and the first quarter of 2021, with large swings from one quarter to another (9.6% in the second quarter of 2020, down to 6.1% in the third quarter, up again to 7.9% in the fourth). Instead, from the second quarter of 2021, the predicted line tracks very closely the line depicting actual unemployment, with the latter falling within the confidence interval of the prediction.
Note
Own estimation based on Okun’s law with current and two lags of GDP growth. Estimation period is first quarter of 2000- fourth quarter of 2019.
Source
Eurostat.
Notwithstanding the economic slowdown, unemployment has been remarkably stable at a very low level since mid-2022.
The stability of unemployment at this juncture is a positive though not completely unexpected development, as the unemployment rate continues to be affected by the strong economic growth that followed the pandemic. Graph 1.9 compares the actual unemployment rate with the unemployment rate predicted by GDP growth (Okun’s law). It shows that the predicted unemployment rate was ‘off track’ only temporarily after the sharp but short-lived recession triggered by the pandemic. Since 2021, the evolution of the unemployment rate has reflected the underlying developments in economic growth quite well; this is valid not only for the whole population but also for different age and education groups (Box 1.2). This result also holds between countries, as the unemployment rate predicted by GDP growth for each Member State mirrors the actual unemployment rate quite well (See Graph 1.A1.2 in Appendix 1).
However, as the economic slowdown continues, it may become more difficult to sustain this low level of unemployment.
The unemployment rate generally increases not only during recessions, but also when economic growth is weak . This is particularly the case when the participation rate is following an increasing trend (as it is currently in the EU – see Section 1.2.2.) because a higher level of economic growth is needed to create enough new jobs for the new labour market entrants. With weak economic growth, therefore, it becomes more difficult to keep the unemployment rate at the current low levels.
Box 1.2: Response of unemployment to economic growth, by age and education
educationThe response of the unemployment rate to fluctuations in economic activity varies between demographic groups. This happens because the probability of finding or losing a job usually varies with age and responds differently to the business cycle. Young individuals are more likely to be hired with temporary contracts and are more easily dismissed during recessions (as they have shorter tenures, limited work experience and lower firing costs). At the same time, they are easier to employ because they are more adaptable and their skills are more up to date. These differences are reflected in the cyclical elasticity of youth unemployment, which has been found to be twice as that of adults (Banerji et al., 2015; Zidong et al., 2021).
This box estimates the Okun’s relationship for the EU for different age and skill groups. The relationship is specified in terms of yearly changes (i.e. the effect of year-on-year GDP growth on the year-on-year differences in the unemployment rate). The estimate is conducted on the period 2000Q1-2019Q4; this allows the identification of how unemployment has developed in comparison with its pre-pandemic relationship with economic activity. The coefficients are estimated with and without two time lags, which allows controlling for a delayed adjustment of labour demand to GDP growth.
Table 1:Dependednt variable: Diference in the unemployment rate

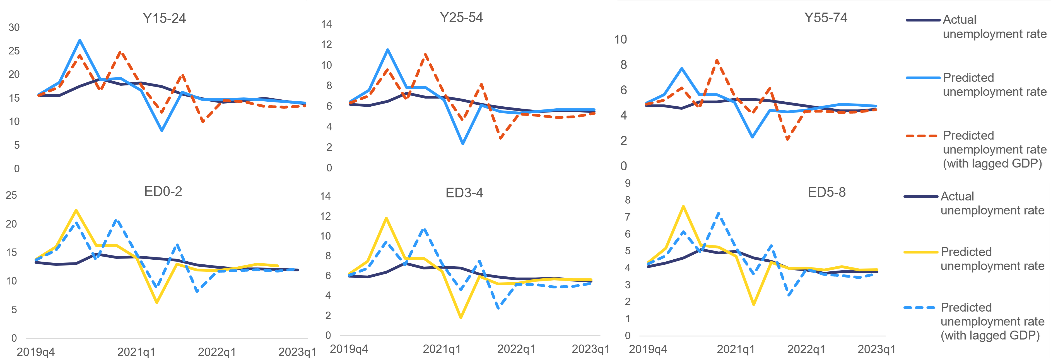
There is considerable heterogeneity in the cyclical response of unemployment across age and education levels. Table 1 shows that, for the whole population, an increase of GDP growth by 1 % leads to a decline of the unemployment rate by 0.4 percentage points, which is in the ballpark of the estimates found in the literature (e.g. Ball et al., 2017). The results of the regression analysis confirm that youth unemployment is twice as sensitive to economic growth as adult unemployment and the impact of changes in economic activity lasts up to two quarters (Graph 1). This effect is stronger for young people than for other age groups. The unemployment rate of older workers is less sensitive to the economic cycle, with a coefficient of about one third of that of young people. Similarly, the unemployment rate of people with low levels of education is more than twice as sensitive to labour demand as the unemployment rate of people with high levels of education. These findings imply that, as soon as the economic recovery gains momentum, the unemployment rates of young people and those with low levels of education should drop faster than overall unemployment; however, it also suggests a higher increase in their unempoyment rates when the economy slows down.
Graph 1: Unemployment rate, actual and predicted, by age and education level
The EU GDP growth of 0.8 % forecast for 2023 may be insufficient to prevent unemployment from rising.The (minimum) level of economic growth needed to keep unemployment stable is not constant but is influenced by past developments in GDP growth. In particular, an increase in economic activity has an effect on labour demand that tends to persist, usually for at least two quarters. Therefore, when GDP is slowing down starting from a high growth rate, labour demand can continue to expand – at least in the short-term. Indeed, between the end of 2021 and the beginning of 2022, the level of GDP growth necessary to keep unemployment stable (according to Okun’s law estimations – see Graph 1.10) was negative. In other words, during this period it was possible to observe a declining unemployment rate even with a drastic reduction in economic growth. Yet in subsequent quarters the level of GDP growth needed to keep unemployment constant increased, reaching 0.4 % on a quarterly basis in the last quarter of 2022. This implies that an annual GDP growth below 1.6 % can be expected to be accompanied by an increase in the unemployment rate. As the EU’s economic growth is forecast to be below this level, according to this analysis, the unemployment rate could start to increase over the course of 2023.
Graph 1.10: GDP growth consistent with stable unemployment (%)

Additional information about graph 1.10
The chart shows two lines. The dotted one is the growth of GDP at constant prices (so-called economic growth). The solid line shows the level of GDP growth that is consistent with a constant unemployment rate. Any change in GDP growth that keeps the former above the latter implies a falling unemployment rate. In particular, an increase in economic activity has an effect on labour demand that tends to persist, usually for at least two quarters. Therefore, when GDP is slowing down from high growth rates labour demand can continue to expand. Similarly, an increase in economic activity that keeps actual GDP growth below the level consistent with stable unemployment rate is insufficient to reduce the jobless rate.
Between the end of 2021 and the beginning of 2022, the level of GDP growth necessary to keep unemployment stable was negative. During this period, it was possible to observe a declining unemployment rate even with a drastic reduction of economic growth.
Note
Okun's law implies that there is a threshold level of GDP growth required to generate sufficient employment to absorb the increase in labour supply and keep unemployment unchanged. The unemployment rate drops when actual GDP is above the GDP threshold and rises when GDP is below this threshold.
Source
Own calculation based on Okun’s law estimate.
Nevertheless, because labour market conditions are very tight, the possible increase in unemployment is not expected to be significant. The dynamics of the labour market can be analysed through the negative relation between unemployment and vacancies (the ‘Beveridge curve’ – see Graph 1.11). The current economic slowdown is occurring in a context of a very tight labour market, with a high vacancy-to-unemployment ratio. In such conditions, a reduction in labour demand (as discussed in Section 1.2.3.) should not have a significant impact on unemployment. Intuitively, this is because employers are expected to first close unfilled vacancies before resorting to dismissing workers, while (the currently few) jobseekers would still have relatively high chances of finding a job. In addition, the process of matching jobseekers with vacancies appears to have been particularly efficient in the EU labour market until the end of 2022 (see Appendix 2).
Graph 1.11: EU Beveridge curve, 2005-2022
Additional information about graph 1.11
The dynamics of the labour market can be analysed through the relation between the unemployment rate (horizonal axis) and the vacancy rate (vertical axis). This relationship is usually negative over the business cycle: an increase in the demand for labour is accompanied by an increase in the job vacancy rate and a decline in the unemployment rate. This relation may also shifts over time. An increase in the unemployment rate at a given job vacancy rate is usually associated with a deterioration of the process linking vacant jobs to job seekers. The rightward shift observed between 2013 and 2019 is usually associated to a deterioration of matching. The current economic slowdown is occurring in a context of a very tight labour market, with a high vacancy-to-unemployment ratio. In such conditions, a reduction in labour demand (as discussed in the previous section) should not have a significant impact on unemployment.
Note
The vacancy rate is proxied by the number of firms that declared labour as a factor limiting their production, as percentage of the labour force. The survey covers construction, industry and services (excluding wholesale and retail trade and public administration, education and health).
Source
Eurostat, EU Labour Force survey, and EU Business and Consumer Survey.
However, as uncertainty remains high, it is useful to investigate under which conditions the economic slowdown may lead to more sizeable increases in unemployment. The potential effects on unemployment of an economic slowdown depend on the relevance of the factors that influence the flows into and out of unemployment – notably, the probabilities of jobseekers finding jobs, and of workers losing their jobs. In turn, these probabilities depend on the overall level of unemployment, the overall number of vacancies, and the efficiency with which jobseekers and vacancies are matched . Through the Beveridge curve framework (see Appendix 2), it is possible to assess the relative importance of the factors that could influence the unemployment rate by looking at changes in the vacancy rate, job dismissal rate, and matching efficiency separately – and taking as a starting point the current situation, which is characterised by very low unemployment and a high number of vacancies.
- In the case of a reduction in labour demand that would translate into a decline in the number of vacancies, but without further changes to dismissal rates nor to matching efficiency (i.e. the scenario discussed above), simulations confirm that the possible increase in unemployment would be limited. Specifically, a reduction in the vacancy rate by 30 % (i.e. back to the level it was at in the third quarter of 2021) would lead to an increase in the unemployment rate (to a new steady state) of less than 1 percentage point.
- In the case of an increase in the rate at which workers lose their jobs – for instance, if a new sharp rise in energy prices or recurrent supply chain disruptions increase pressure to restructure – the increase in unemployment could be more pronounced, even without substantial changes in the number of vacancies. Specifically, if the dismissal rate increased to its average for the period 2005-2010, simulation results point to an increase in unemployment of about 2 percentage points.
- Finally, in the case of a worsening of matching efficiency (e.g. due to rising skills or occupational mismatches), employers would encounter more difficulties in filling open vacancies while jobseekers would have a lower probability of being recruited. Simulation results show that a deterioration in matching efficiency to the levels observed during the 2008-2012 economic crisis – with the same level of vacancies and without a change in the dismissal rate – would be associated with an increase in unemployment of 4 percentage points.
Policies sustaining labour demand and favouring a more effective job-matching process can help avoid large rises in unemployment if these risks materialise.In addition to providing targeted support to those sectors most directly affected by the disruptions arising from Russia’s war of aggression against Ukraine (including through direct subsidies and job-retention measures), sustained labour demand can be achieved by fostering investment and enhancing the competitiveness of European businesses. Recent Commission initiatives, such as the Green Deal industrial plan (which aims to strengthen the EU’s capacity to develop and manufacture the clean technologies needed to make the green transition possible) and the communication on EU competitiveness beyond 2030 (which identifies the key drivers that would allow the competitiveness of the EU economy to be fostered going forward), are steps in this direction . Supporting jobseekers and investing in the upskilling and re-skilling of the workforce to address possible skills mismatches and shortages not only helps to sustain the labour supply (as discussed in Section 1.2.2.), but can also improve the efficiency of the job-matching process. This has been the focus of the initiatives of the European skills agenda – among them the pact for skills and the Council recommendations on individual learning accounts, micro-credentials and vocational education and training – and of the European Year of Skills . Investment in human capital is recognised as a key driver of long-term competitiveness, and the Green Deal industrial plan also includes a pillar on enhancing skills in support of the twin green and digital transitions.