Appendix 1
Regression results
Table 3.A1.1:Individual-level determinants of average usual hours of work for each Member States, 2021

Note
Cross-section ordinary least squares regression with standard errors clustered by country. Shading reflects statistical significance.
Source
EU Labour Force Survey.
Table 3.A1.2:Individual-level determinants of average usual hours of work in the EU in 2021, with interaction terms

Note
Cross-section ordinary least squares regression with standard errors clustered by country. Shading reflects statistical significance.
Source
EU Labour Force Survey.
Table 3.A1.3:Demographic characteristics of workers who work outside working hours in the EU, 2021

Note
Logit regression with standard errors clustered by country. Shading reflects statistical significance.
Source
EU Labour Force Survey 2021.
Table 3.A1.4:Aspects of job quality, as influenced by hours of work and other demographic variables

Note
Cross-section ordinary least squares regression with standard errors clustered by country and logit for the first regression. Shading reflects statistical significance.
Source
EU Labour Force Survey.
Table 3.A1.5:Individual- and institution-level determinants of usual weekly hours of work, 2008–2021

Source
EU LFS and OECD data.
Table 3.A1.6:Individual and institution-level determinants of annual hours worked, 2008–2021

Source
EU Labour Force Survey and OECD data.
Table 3.A1.7:Individual and institution-level determinants of average usual weekly hours worked by female workers, 2008–2021

Note
Panel regression with country and year fixed effects.
Source
EU Labour Force Survey and OECD data.
Table 3.A1.8:Individual and institution-level determinants of average usual weekly hours worked by male workers, 2008–2021

Note
Panel regression with country and year fixed effects
Source
EU Labour Force Survey and OECD data
Appendix 2
The EU's Working Time Directive (2003/88/EC)
Directive 2003/88/EC of the European Parliament and of the Council of 4 November 2003 concerning certain aspects of the organisation of working time sets the minimum standards currently applicable throughout the EU. It requires EU Member States to guarantee the following rights for all workers.
- A limit for weekly working hours. The average working time for each 7-day period must not exceed 48 hours, including overtime. Depending on national legislation and/or collective agreements, the 48-hour average is calculated over a reference period of up to 4, 6 or 12 months.
- A rest break during working hours. This is required if the worker is on duty for longer than 6 hours.
- A minimum daily rest period. In every 24 hours, a worker is entitled to a minimum of 11 consecutive hours of rest.
- A minimum weekly rest period. For each 7-day period, a worker is entitled to a minimum of 24 uninterrupted hours in addition to the 11 hours’ daily rest.
- Paid annual leave. The leave must be of at least 4 weeks per year.
- Extra protection in the case of night work. The average working hours must not exceed 8 hours per 24-hour period. Night workers must not perform heavy or dangerous work for more than 8 hours in any 24-hour period; night workers also have the right to free health assessments and, under certain circumstances, to transfer to day work.
The working time directive allows for derogations from most of these rights. These can be applied for specific categories of workers or sectors under certain circumstances and with due regard to the protection of the health and safety of workers. The directive also allows for individual opt-outs . The working time directive also contains special rules that apply to certain categories of workers (mobile workers, offshore workers and workers on board seagoing fishing vessels). In specific transport sectors (air, rail, sea and inland waterways), separate directives on working hours for certain workers apply.
Table 3.A2.1:Working hours: weekly and daily statutory limits and annual normal hours, EU Member States, 2020

Note
The average over a period of 4 months cannot exceed 48 hours. The limit for a 6-day work schedule is 48 hours. Public holidays covers all except those falling on Sundays. Annual leave covers statutory minimum paid annual leave and collectively aggred (CB). Weekly normal hours covers collectively agreed hours or, where not specified, statutory weekly hours.
Source
Eurofound (2021).
Appendix 3
Measuring working time
Annual hours of work refers to the total number of hours worked by an individual over the course of a year. It is influenced by both the intensive and extensive margin of employment and differences in the composition of hours worked, characterised by the share of part-time workers and self-employed people. This measure is often used to compare labour inputs between countries and over time and is fundamental to productivity analyses. It is reported in national accounts, which rely on various survey sources (including labour force surveys and establishment and time-use surveys), and is subject to harmonisation, as it needs to be reconciled with other variables such as output and compensation of employees, thus leading to potential discrepancies with the results of individual survey sources. The measurement might not fully capture the actual hours worked, as factors such as unpaid overtime are not considered.
Average actual weekly working hours refers to the number of hours worked by a person in the reference week and usual weekly working hours refers to those worked during a ‘normal’ week.These measures are often used to understand work patterns within a week and can be obtained from labour force surveys or establishment surveys, but rarely from administrative sources (Fleck, 2009). The EU Labour Force Survey provides a holistic picture that includes all sectors of the economy and types of employment; it captures the variability and irregularity of hours worked, including paid and unpaid overtime. It is also important to note that the EU Labour Force Survey’s measure of actual hours worked is not yet harmonised at the EU level and is thus less comparable between countries and should be best analysed as a trend rather than a level.
Graph 3.A3.1: Average number of usual weekly hours of work (main job), 20–64 years old, EU Member States, 2008–2022


Source
EU Labour Force Survey.
Appendix 4
Average weekly hours decomposition
In this appendix, we briefly present the methodology behind the decomposition of the changes in average weekly hours and their determinants shown in Graphs 3.3 and 3.7 in Chapter 3, and Graphs 3.3 to 3.3 in this appendix. If AW(t) is the average weekly working hours, FT(t) is the average weekly working hours of full-time employees, PT(t) is the average weekly working hours of part-time employees, SE(t) is the average weekly working hours of self-employed people, s(t) is the share of self-employed people in the total active population and p(t) is the share of part-time employees in the employed labour force, then the following equation defines their relationship for each time, t.
If ΔX(t) denotes a time difference X(t) – X(t – 1) for each variable X(t), we can express the change in the average working week as in the following equation. We are working with annual Eurostat Labour Force Survey data and the annual changes in all variables are two orders of magnitude smaller than the variables themselves, so any multiplication of two or more annual change variables is negligible, which simplifies our decomposition.
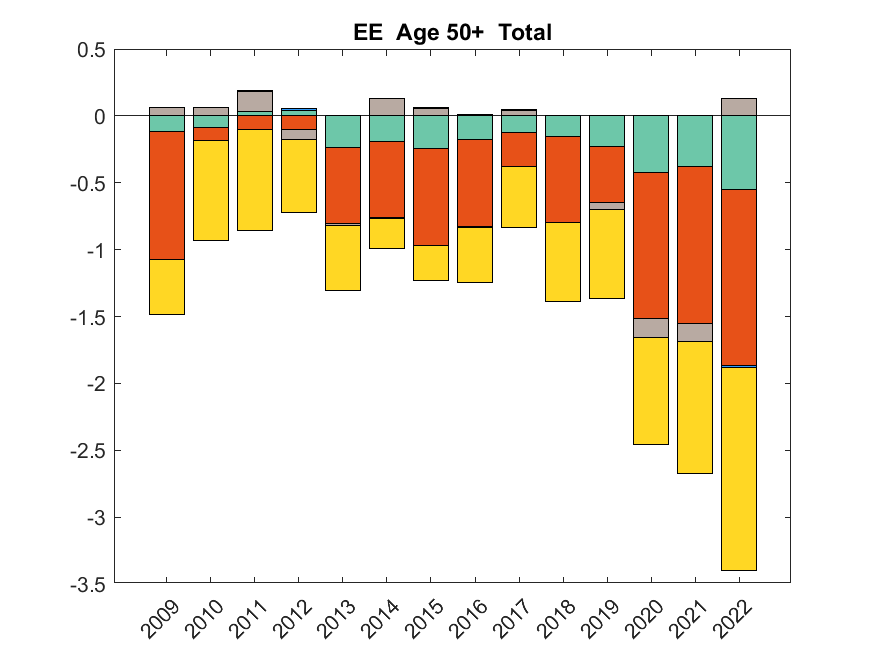
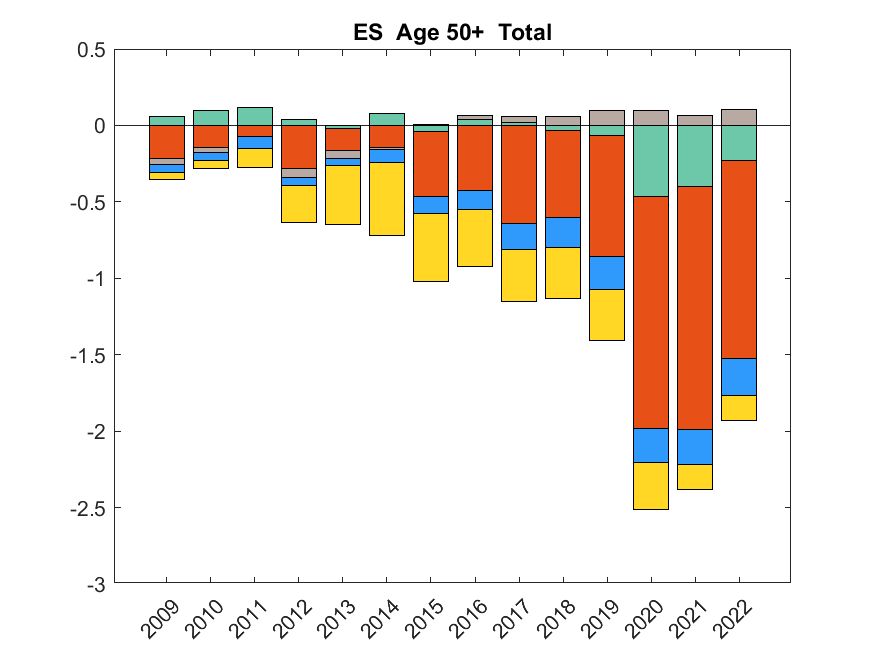
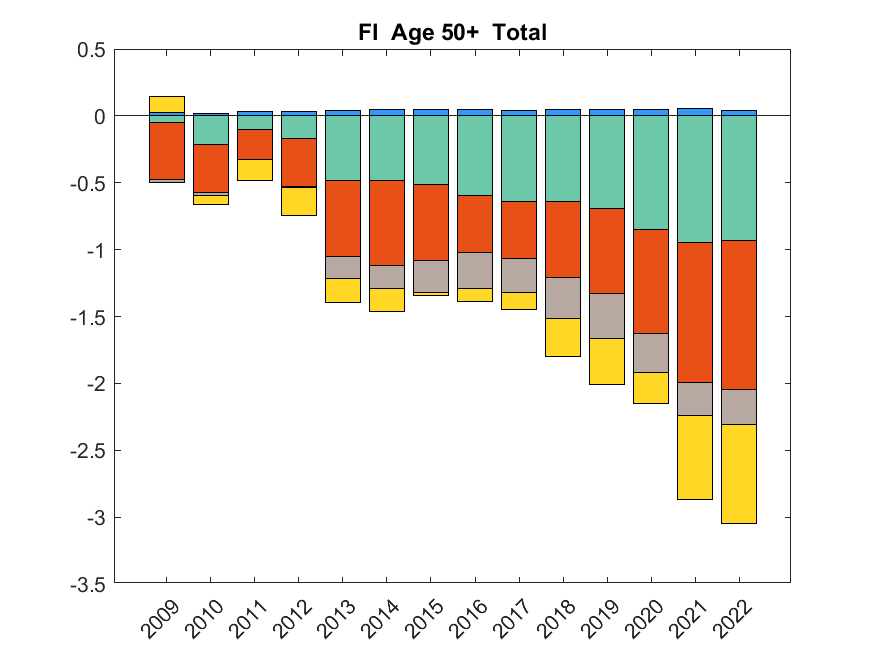
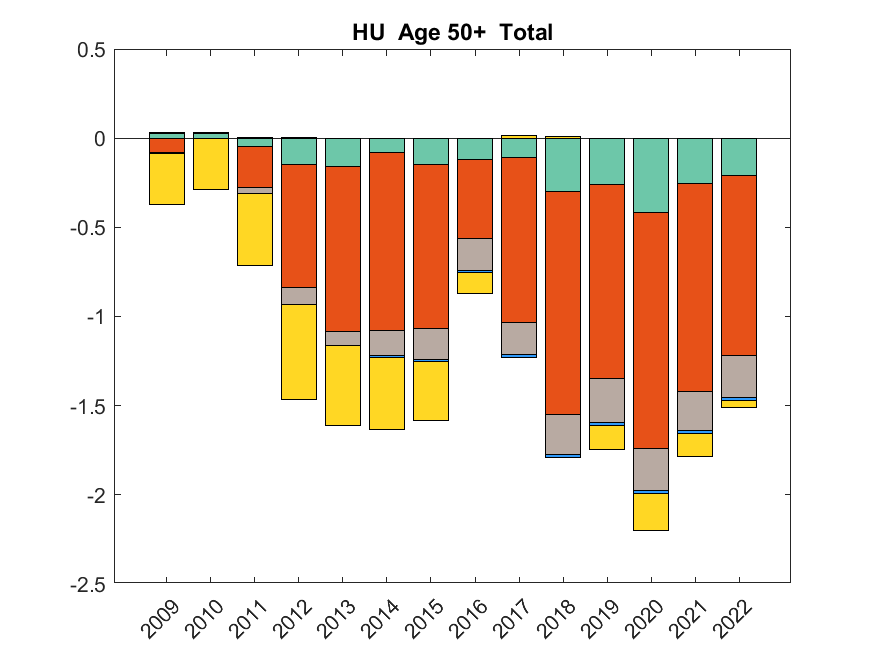
The first three additive elements represent the direct effect of changes in average full-time, part-time and self-employed weekly hours. The fourth and fifth elements represent the impact of changes in the composition of the active population: the fourth element represents the changes in the share of self-employed people in the total active population and the fifth element represents the changes in the share of part-time workers in the employed workforce. In Graphs 3.A4.1 to 3.A4.6, the disaggregated factors are calculated for each age group and gender and are presented as cumulative effects.
Graph 3.A4.1: Overall average working week change decomposition, EU Member States


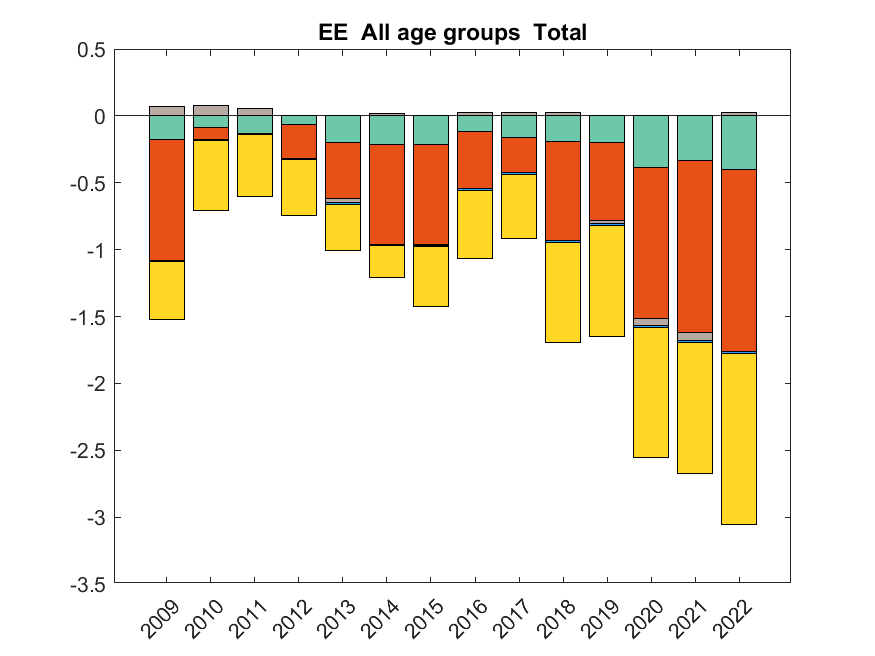


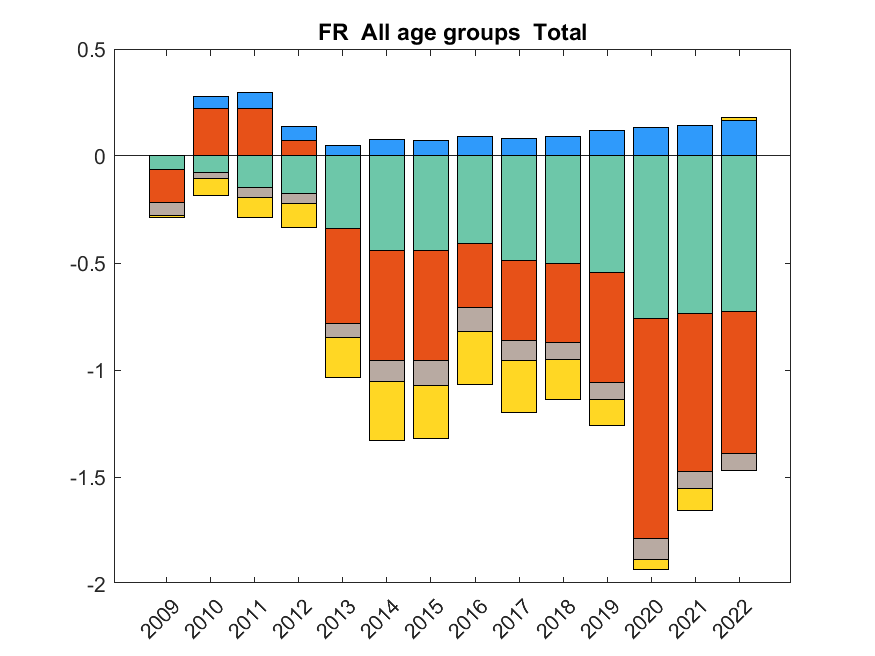
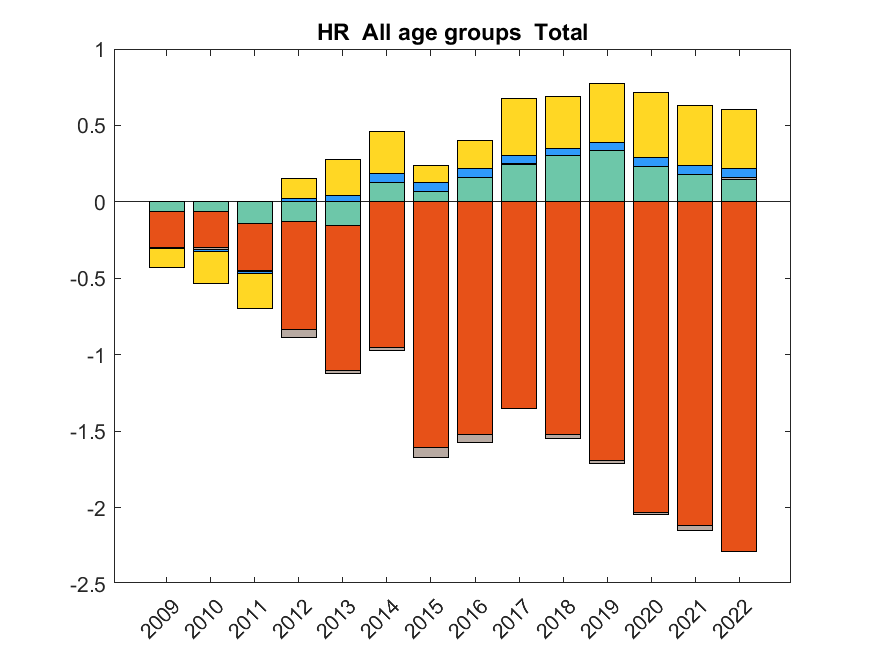


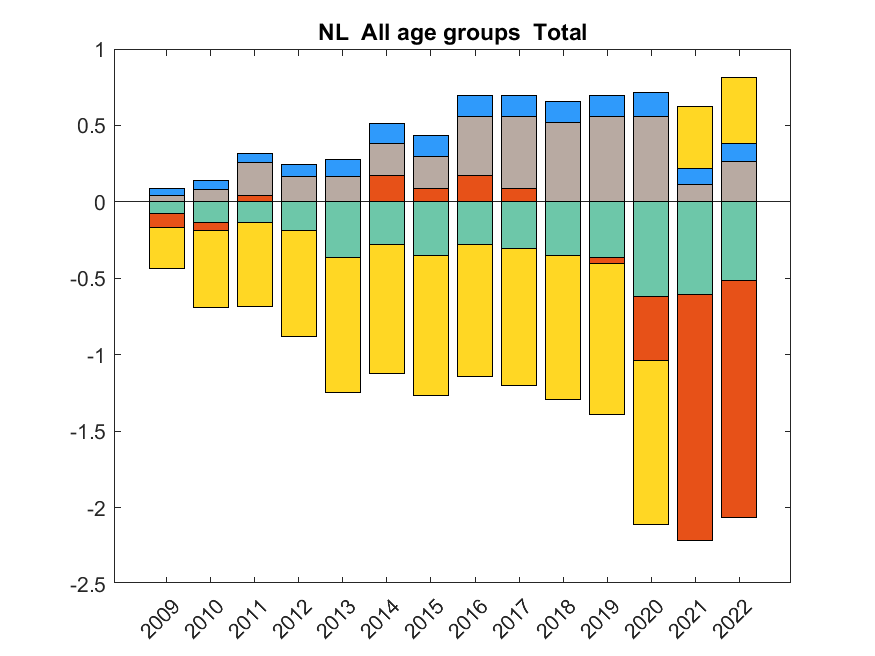


Source
Own calculations based on Eurostat Labour Force Survey data.
Graph 3.A4.2: Female average working week change decomposition, EU Member States


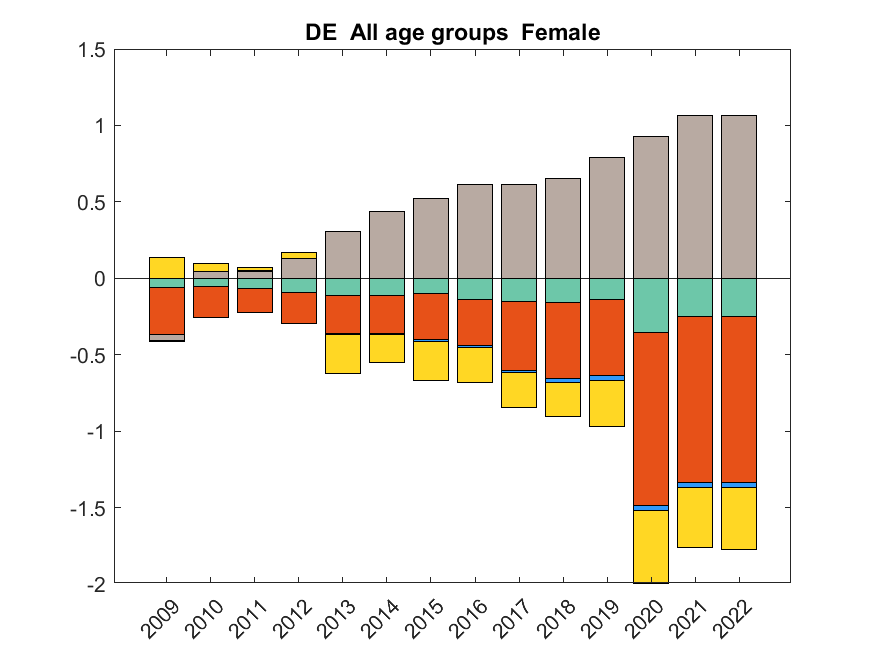
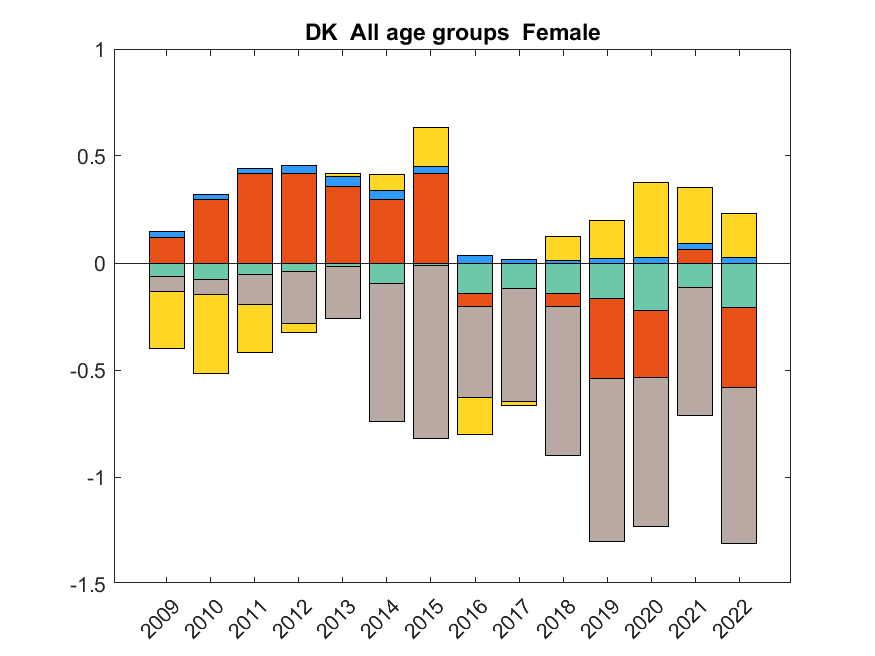
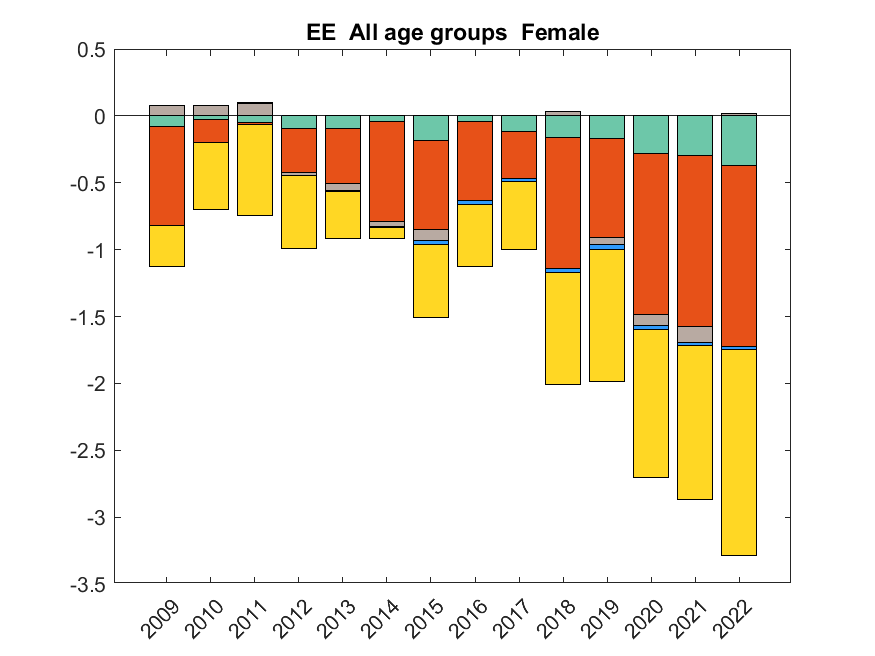
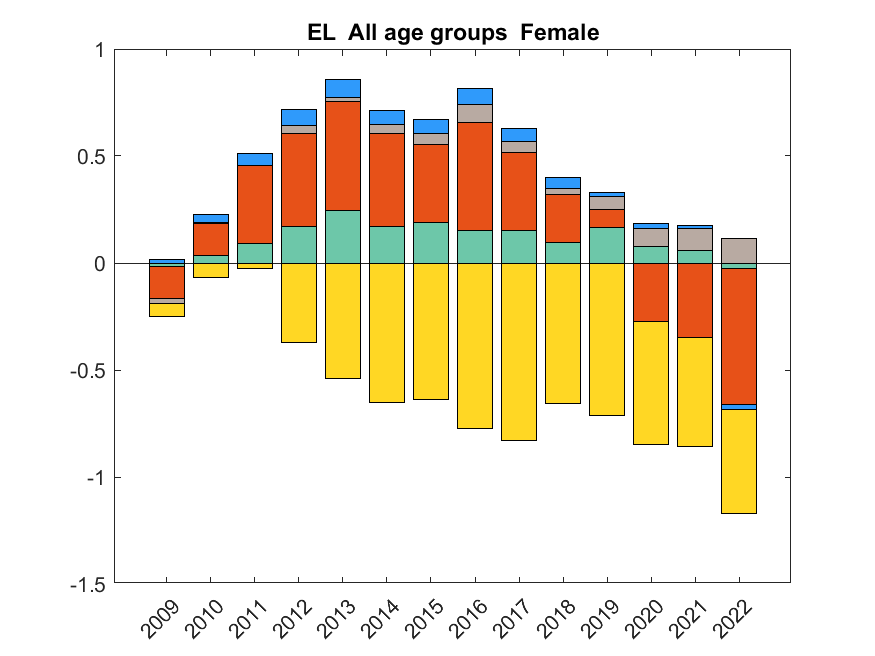


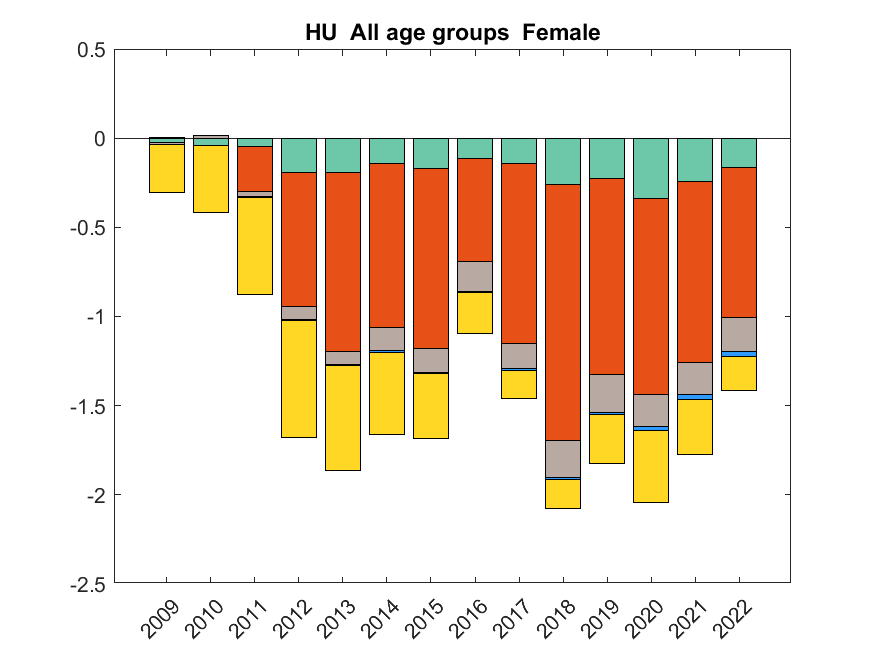


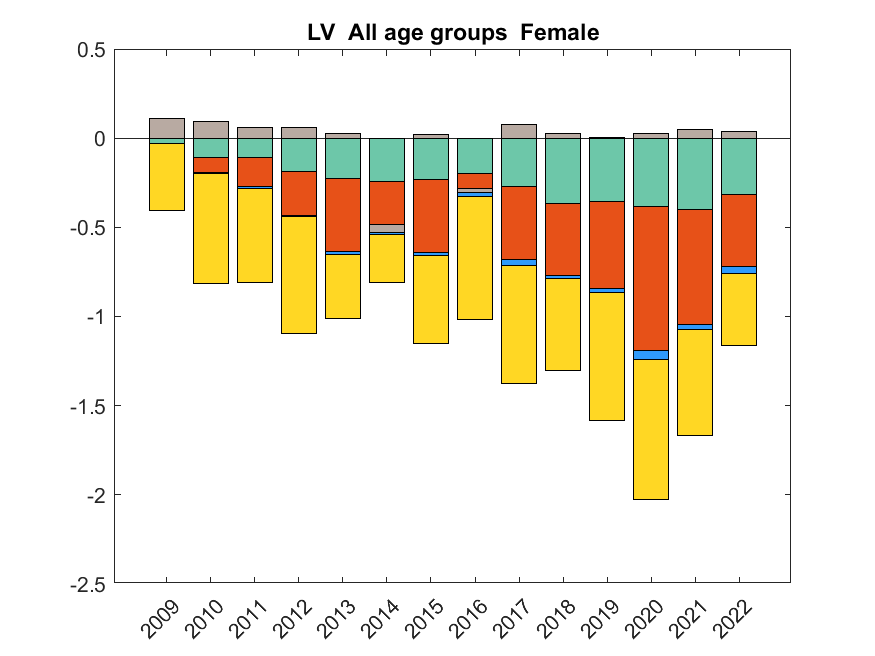

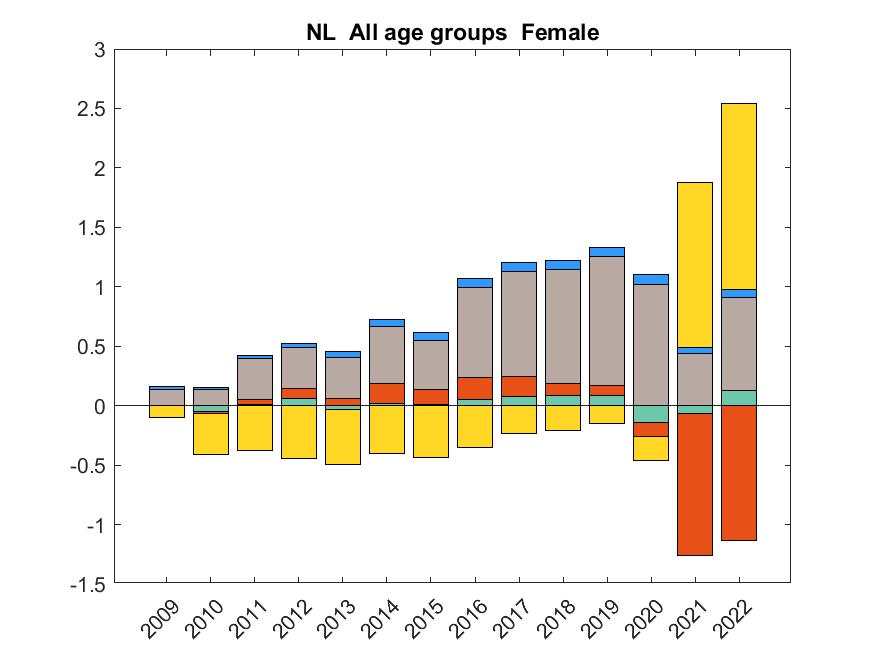


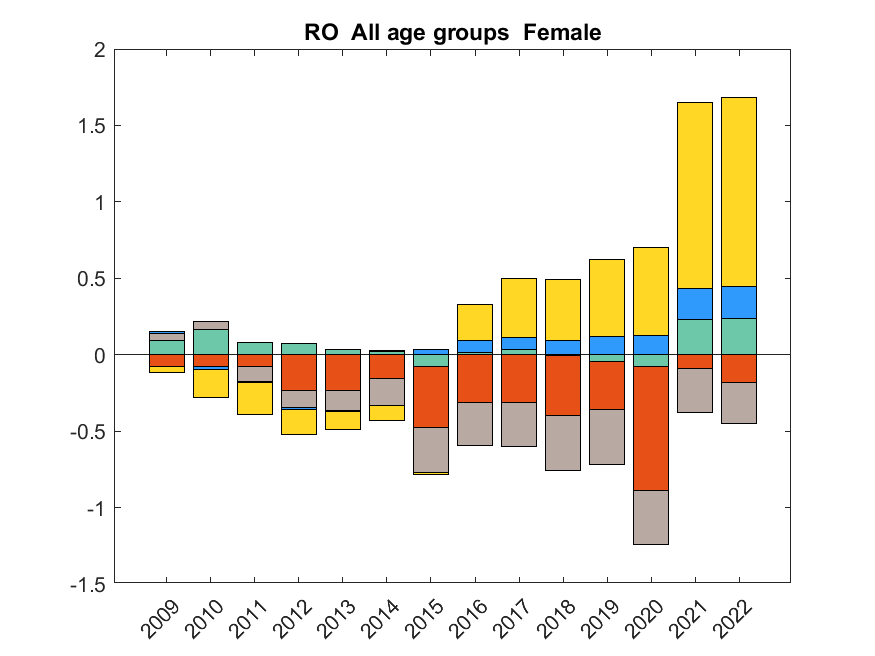
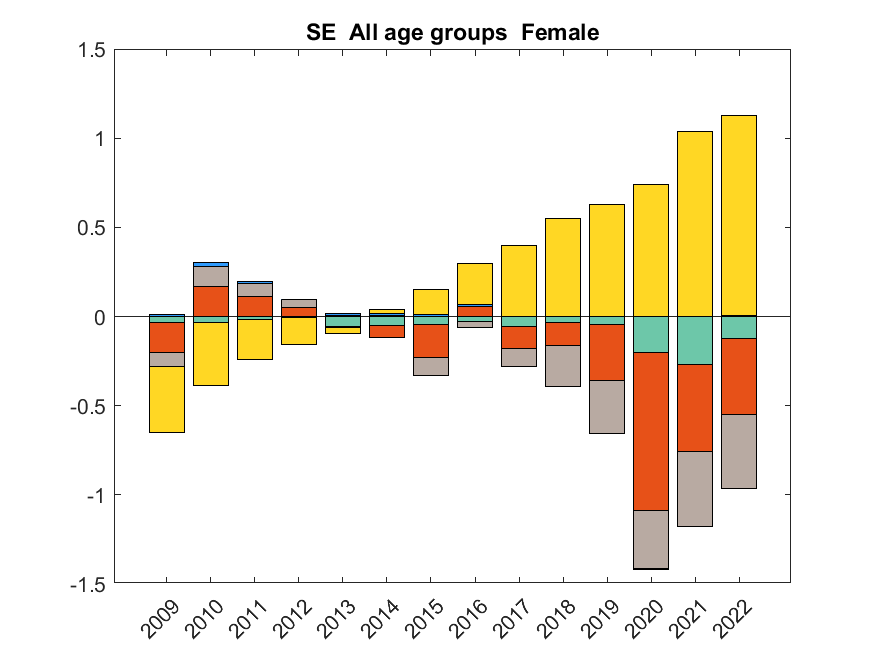


Source
Own calculations based on Eurostat Labour Force Survey data.
Graph 3.A4.3: Male average working week change decomposition, EU Member States

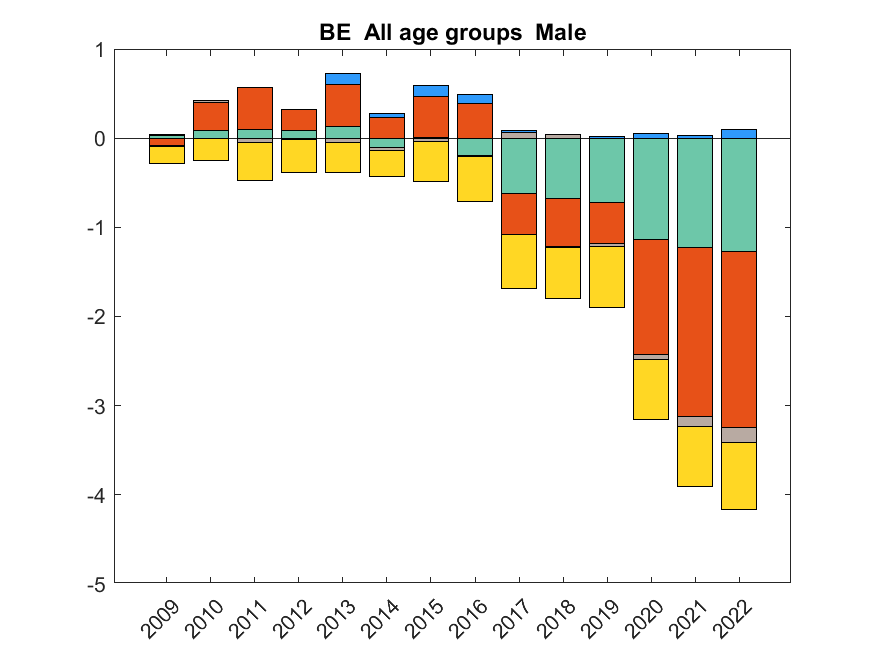


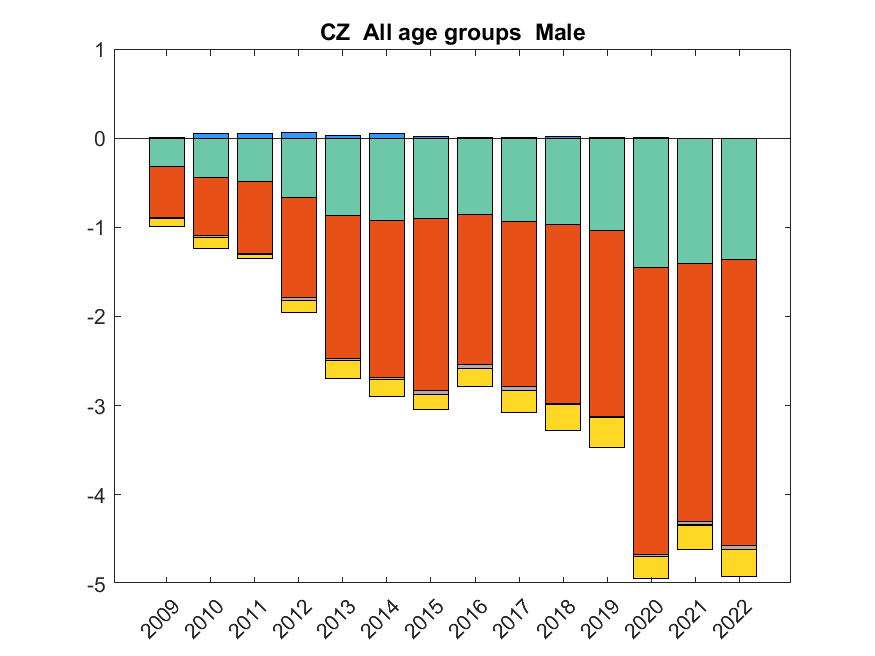


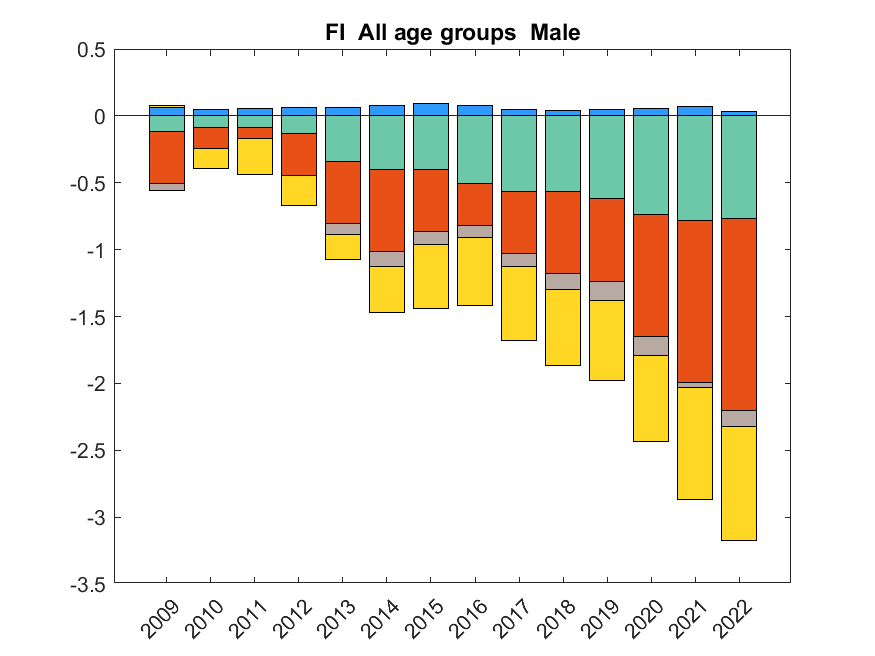


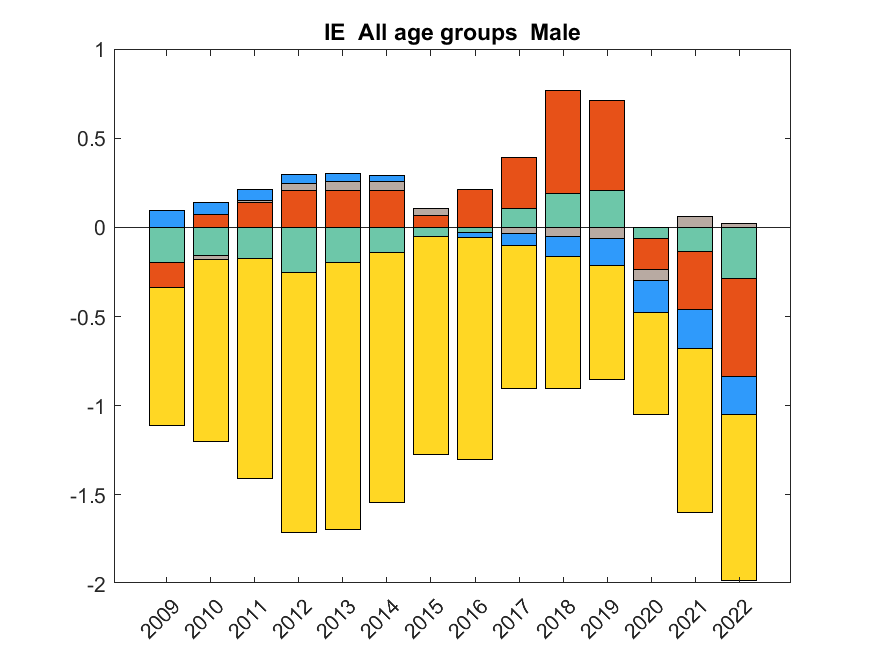

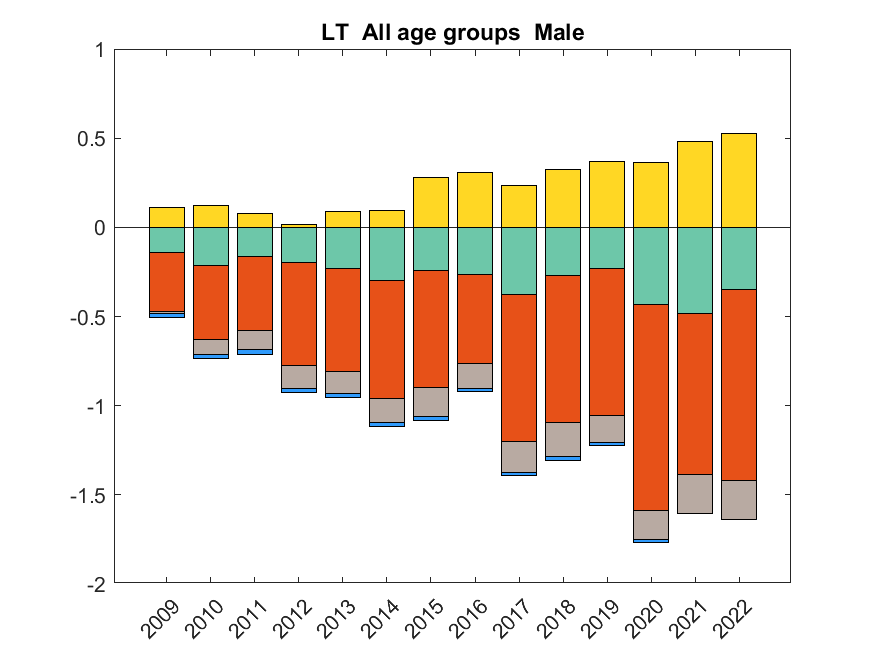


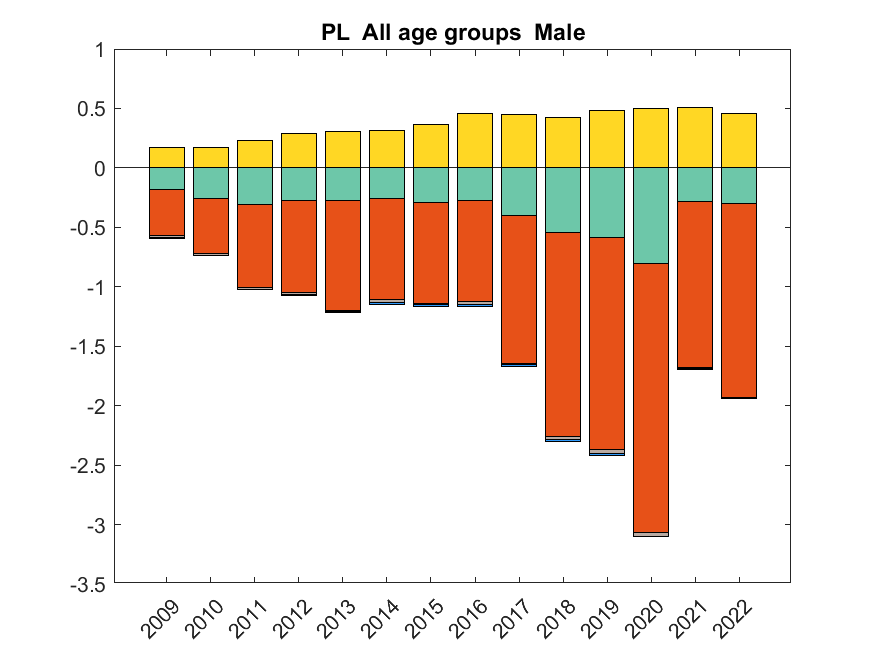


Source
Own calculations based on Eurostat Labour Force Survey data.
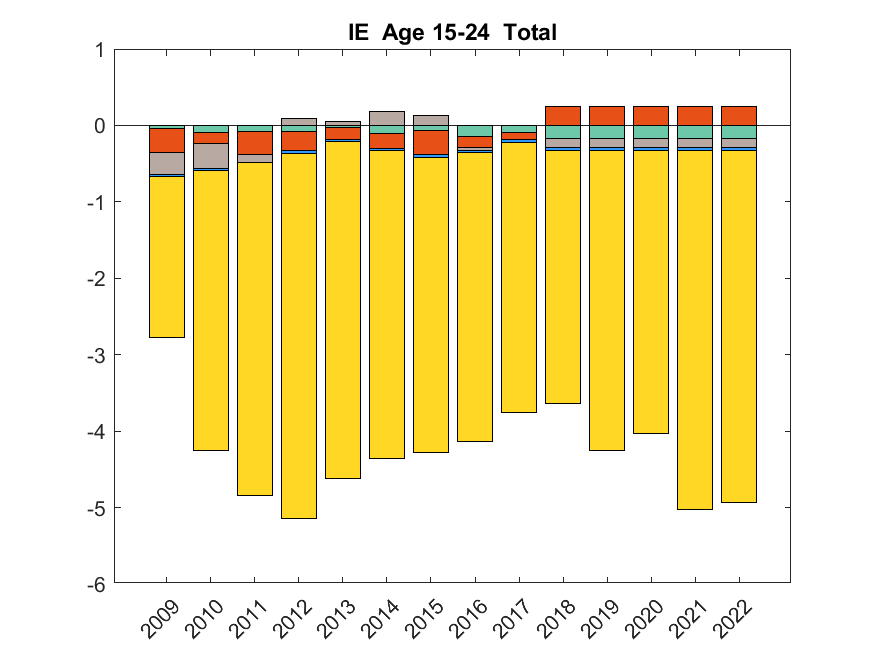
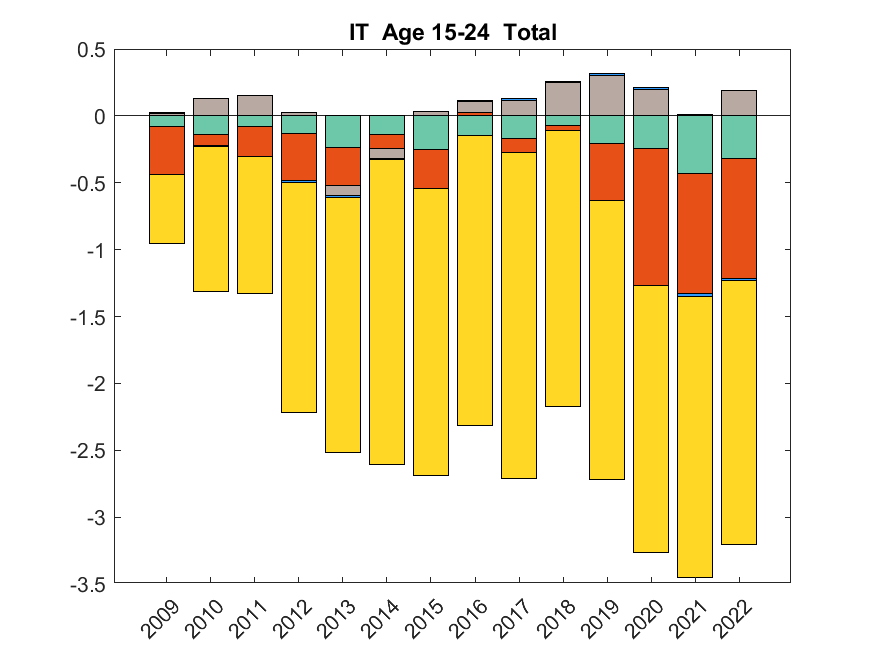
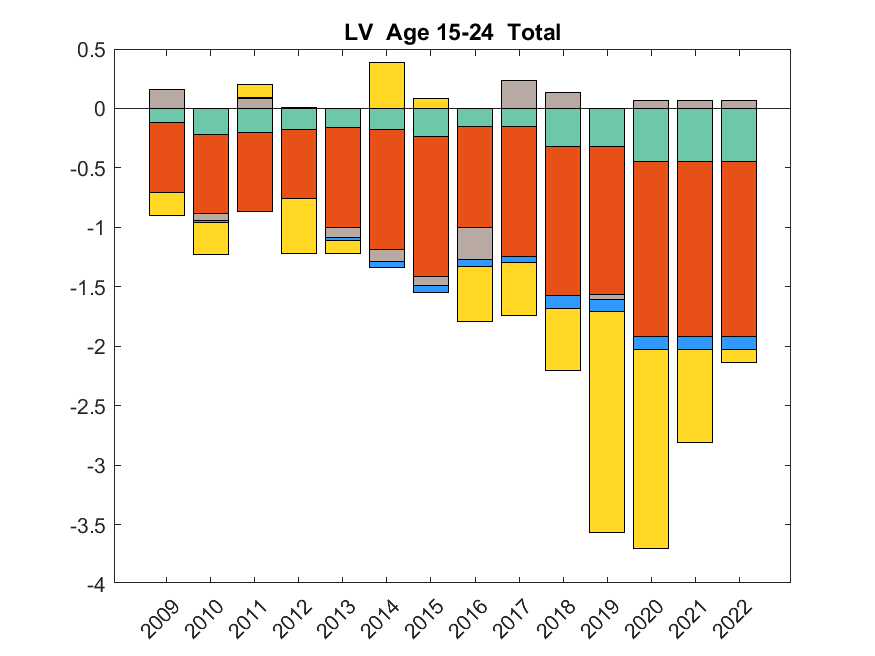
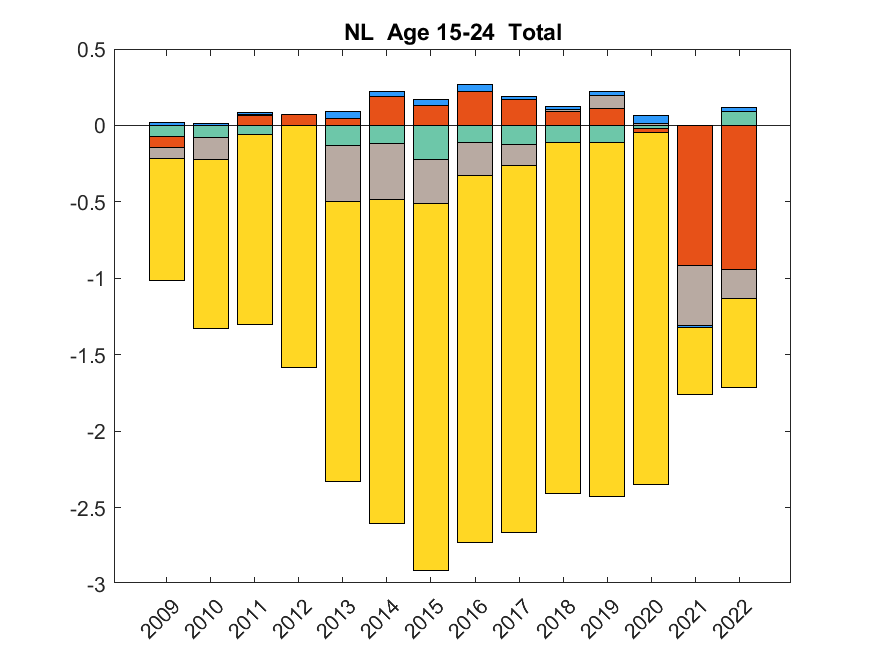
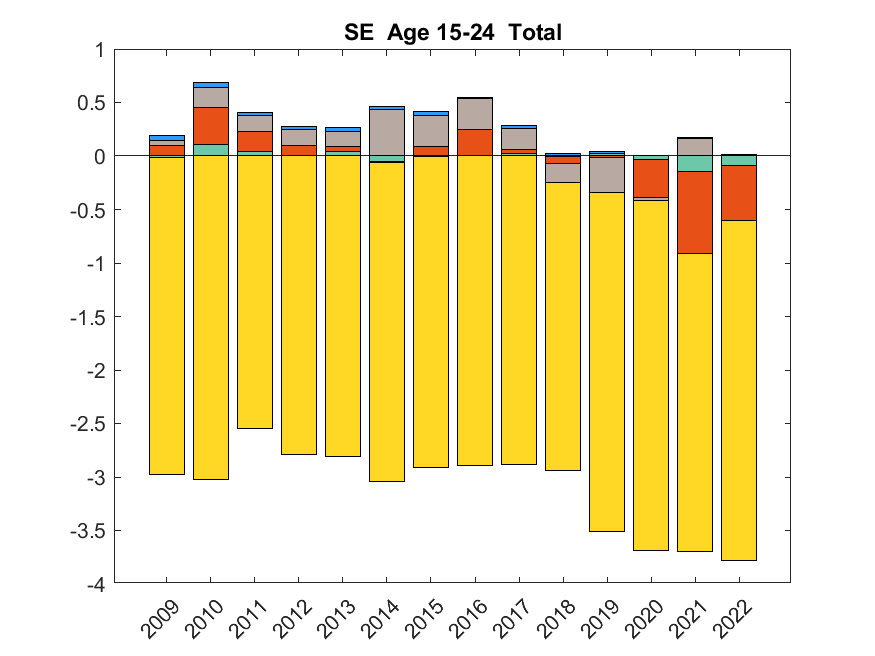
Graph 3.A4.4: 15-24 age group average working week changes decomposition, EU Member States
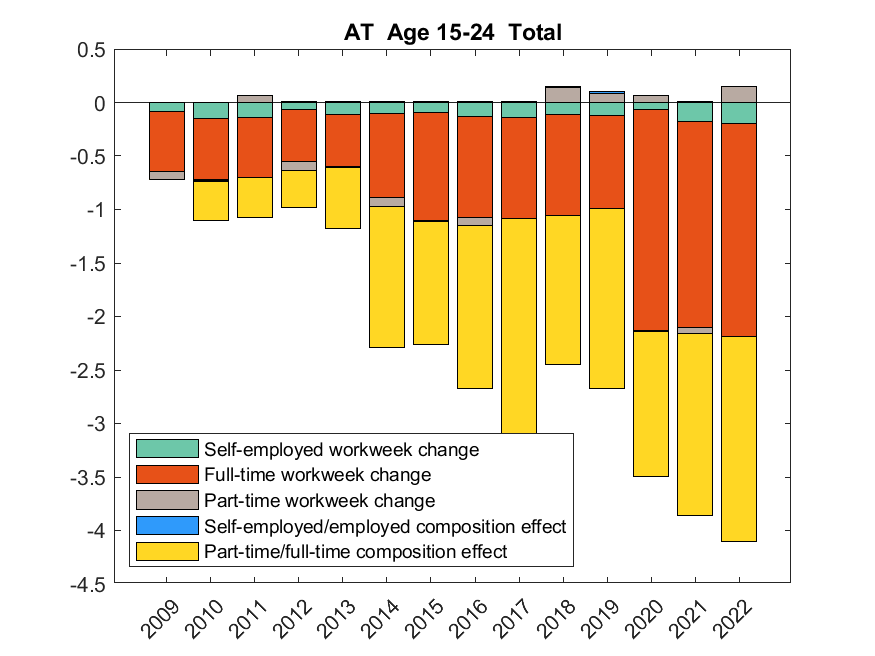


Source
Own calculations based on Eurostat Labour Force Survey data.
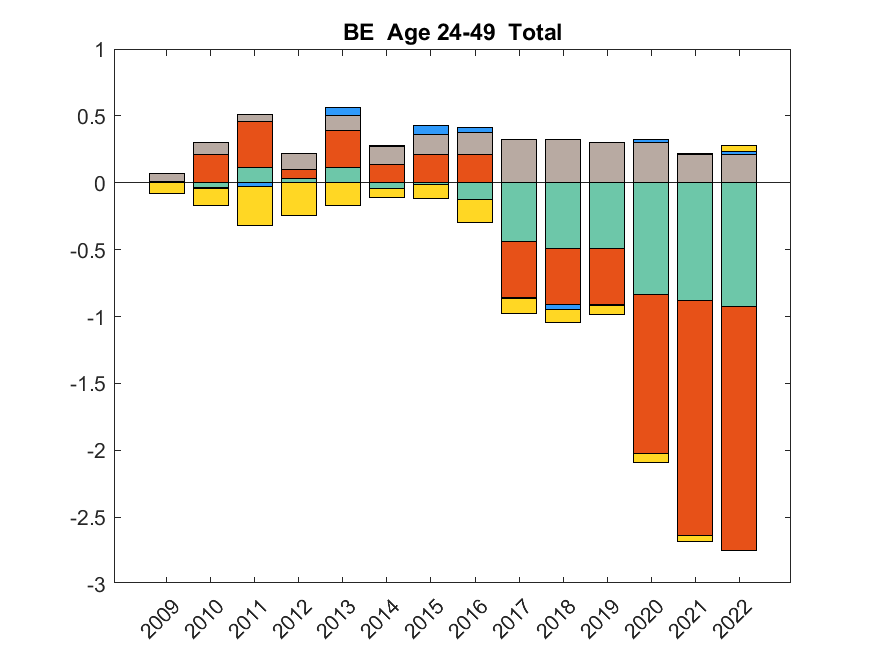
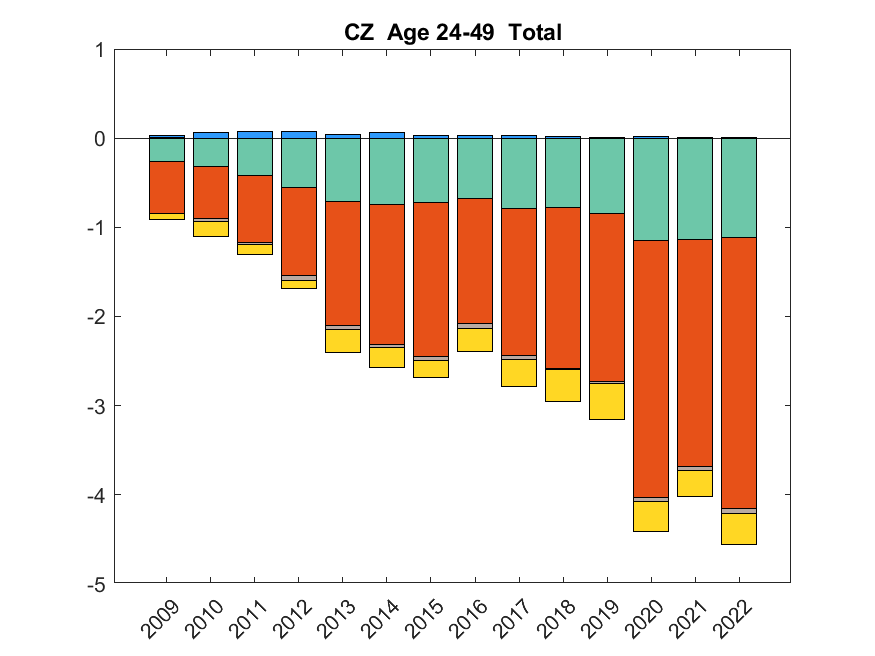
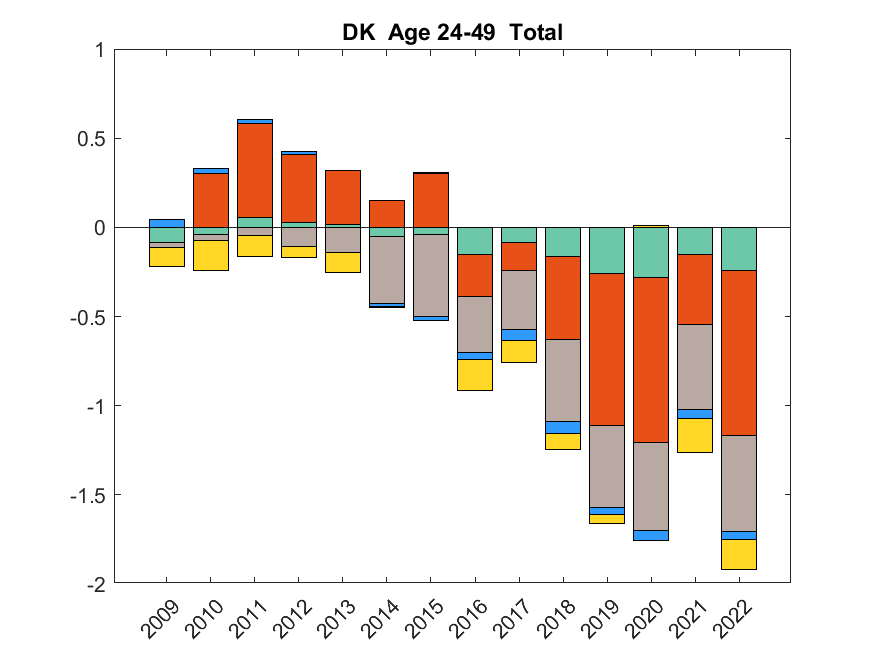
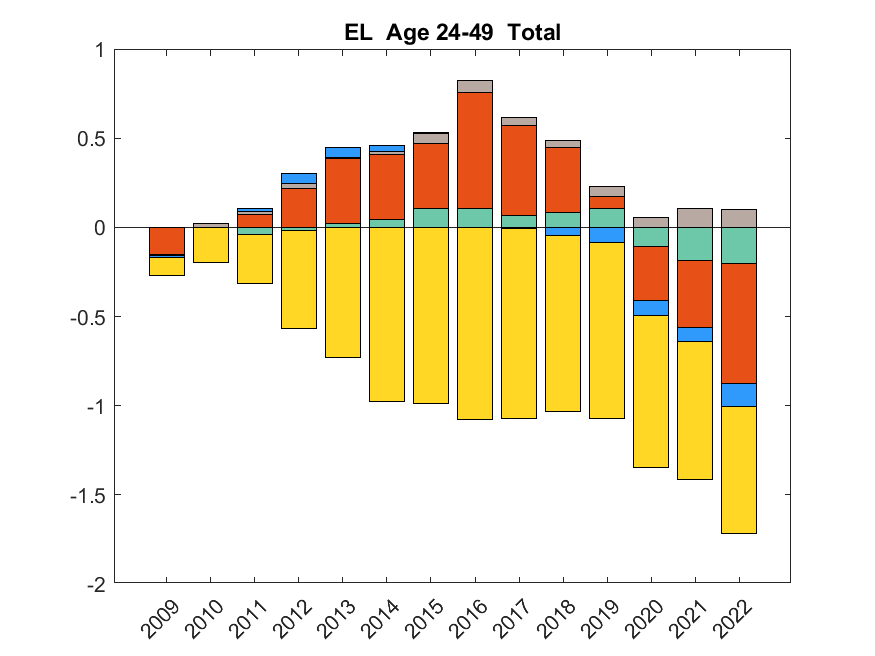
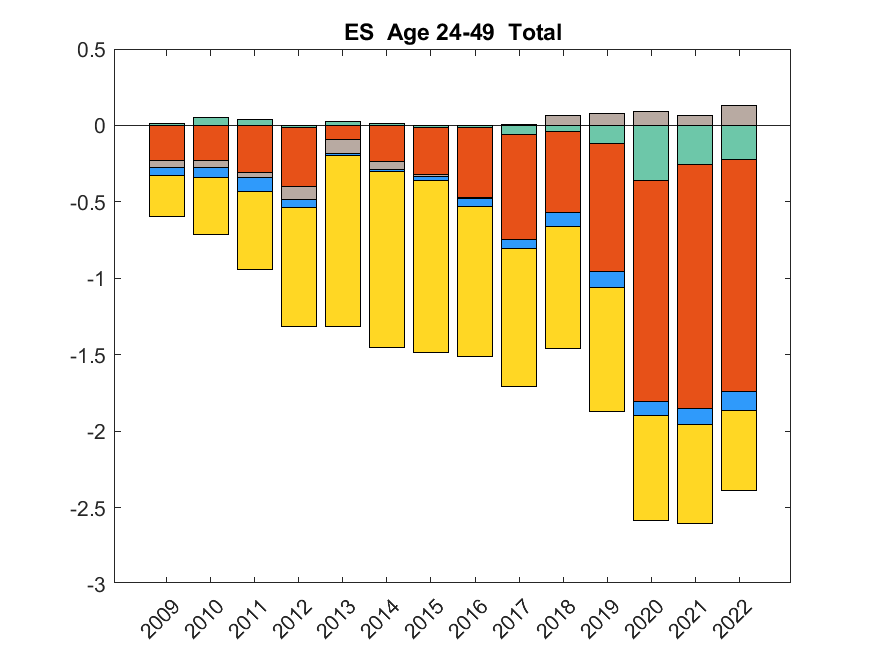
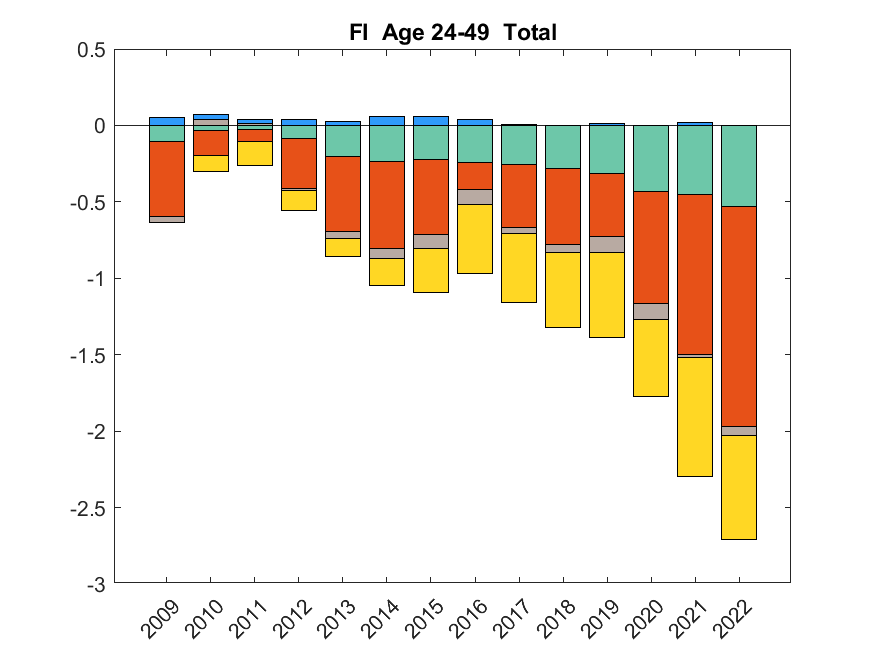
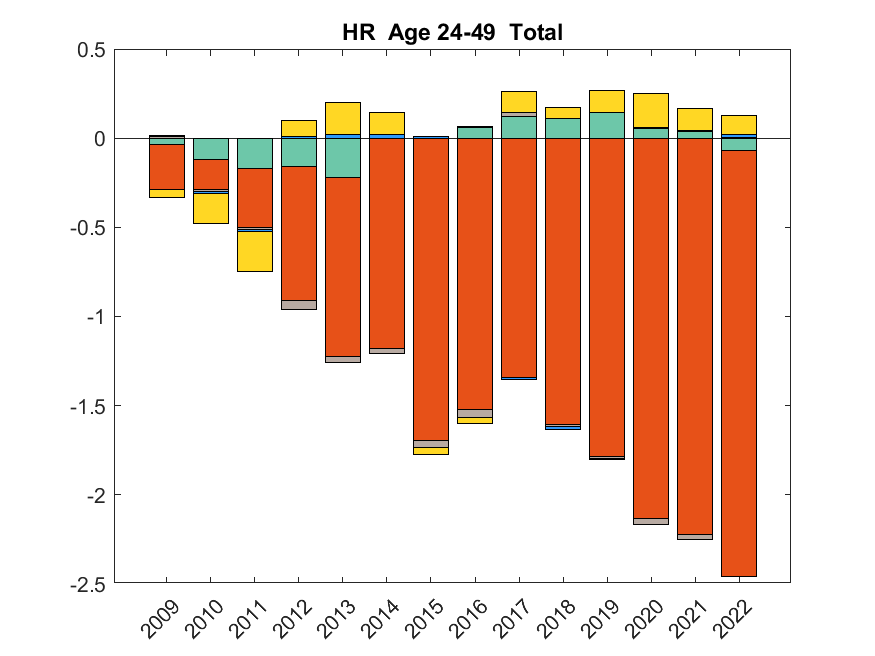
Graph 3.A4.5: 25-49 age group average working week changes decomposition, EU Member States


Source
Own calculations based on Eurostat Labour Force Survey data.
Graph 3.A4.6: 50+ age group average working week changes decomposition, EU Member States


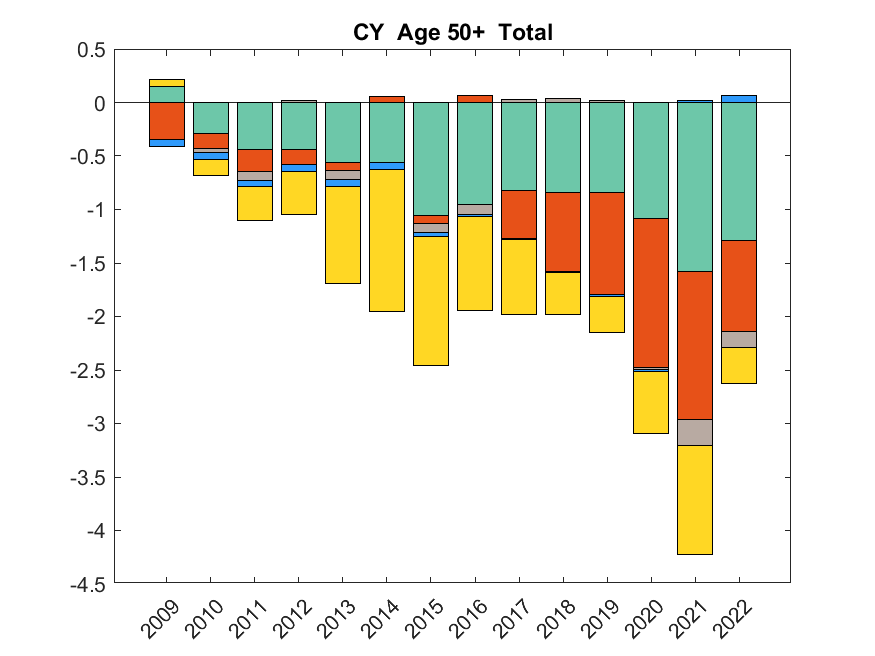


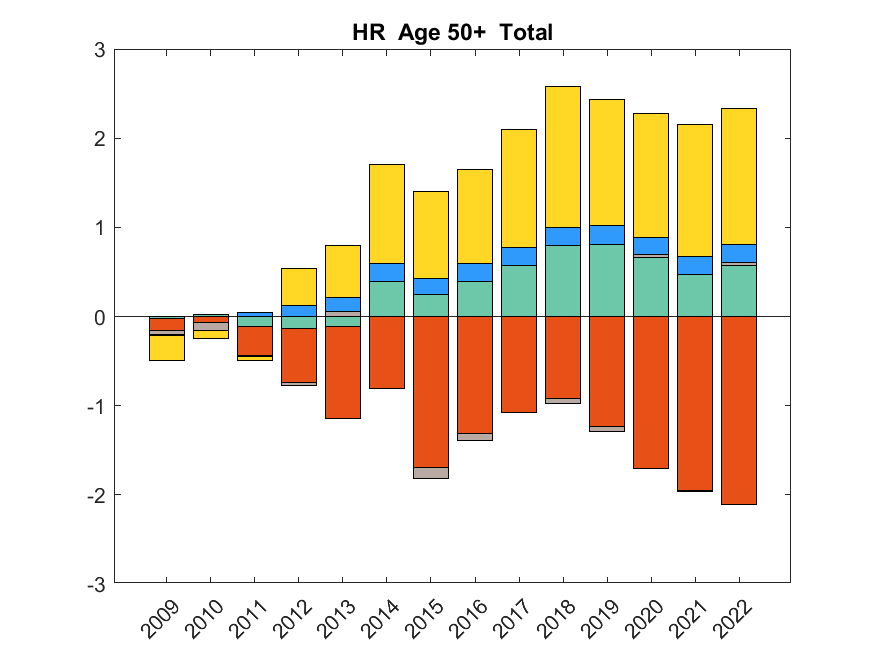


Source
Own calculations with Eurostat Labour Force Survey data.
Appendix 5
Propensity score matching
Propensity score matching is used to deal with the confounding of treatment effects in an observational setting. In the first step, the analysis relies on a logistic regression to estimate the propensity score – the probability of the individual receiving the ‘treatment’, depending on the covariates. In a second step, nearest neighbour matching is implemented to reduce confounding. Thus, individuals are selected from the treatment and control groups and paired based on their similar propensity scores. Finally, the treatment effect is estimated, comparing the average outcomes of the individuals in the treatment group with the control group.
The analysis is using the outcomes (Y) usual working hours and preferred change in working hours. The treatment variables (T) are having difficulties in making ends meet in the household, gender, having a second job, working long hours and having low or high levels of education. The predictors of the propensity scores in the logistic regression (X1, X2, etc.) are household size, age, amount of unpaid domestic work and International Standard Classification of Occupations one-digit occupational group. International Standard Classification of Education level, gender and difficulties in making ends meet in the household are also included as predictors when they are not the treatment variable. Usual hours worked is a predictor in the estimation of the impacts of treatment variables on preferred hours worked.