The long-term process of wage convergence between Member States
This section reviews the process of wage convergence between Member States in the last decade, both in nominal terms (Subsection 2.5.1.) and in PPS (Subsection 2.5.2.). All in all, it suggests persistent large gaps and a stalling wage convergence.
Wage convergence in nominal terms
Average wage levels vary considerably between Member States, ranging from about 30 % to 200 % of the EU average .This variation reflects differences in income per capita and therefore productivity. However, in some countries, wage levels are well behind what could be expected from their productivity levels (notably by about 20 % in Hungary and 15 % in Romania on average over 2019–2022; see Graph 2.10) .
Graph 2.10: Average salary and average productivity, 2019-2022

Additional information about graph 2.10
This figure illustrates to what extent the average wage in a Member State correlates with its level in labour productivity. Indeed, the higher a country is economically advanced, the higher its labour productivity tends to be, which tends to translate in higher wages. The figure shows that average wage levels vary considerably between Member States, ranging from about 30 % to 200 % of the EU average (the figure are based on average full time adjusted salary per employee in current euros from 2019 to 2022, relative to the EU average). This variation reflects in particular differences in labour productivity (shown in the figure as the average GDP per person employed from 2019 to 2022, relative to the EU average). At the same time, in some countries, wage levels remain well behind what could be expected from their productivity levels, based on linear relationship between average wages and productivity.
Note
Amounts in euro.
Source
Own calculations based on Eurostat, Average full time adjusted salary per employee (nama_10_fte), GDP and main components (output, expenditure and income) (nama_10_gdp), and Population and employment (nama_10_pe).
In the last decade, some upward nominal wage convergence has taken place, but this has left aside many southern European countries .The upward convergence is shown by the decline in the coefficient of variation for nominal wages and the rise in average wages (Graph 2.11) . When looking at long-term wage developments, Member States can be classified into three groups: western European, southern European and central and eastern European countries . Wage convergence within the EU has been mainly driven by the convergence of wages between these groups. In particular, higher wage growth has been observed in central and eastern European countries (reflecting the catching-up process, higher inflation rates and tight labour markets). By contrast, wage convergence between southern European and western European countries has stalled since the 2007–2008 financial crisis (Graph 2.A1.5 in Appendix 1).
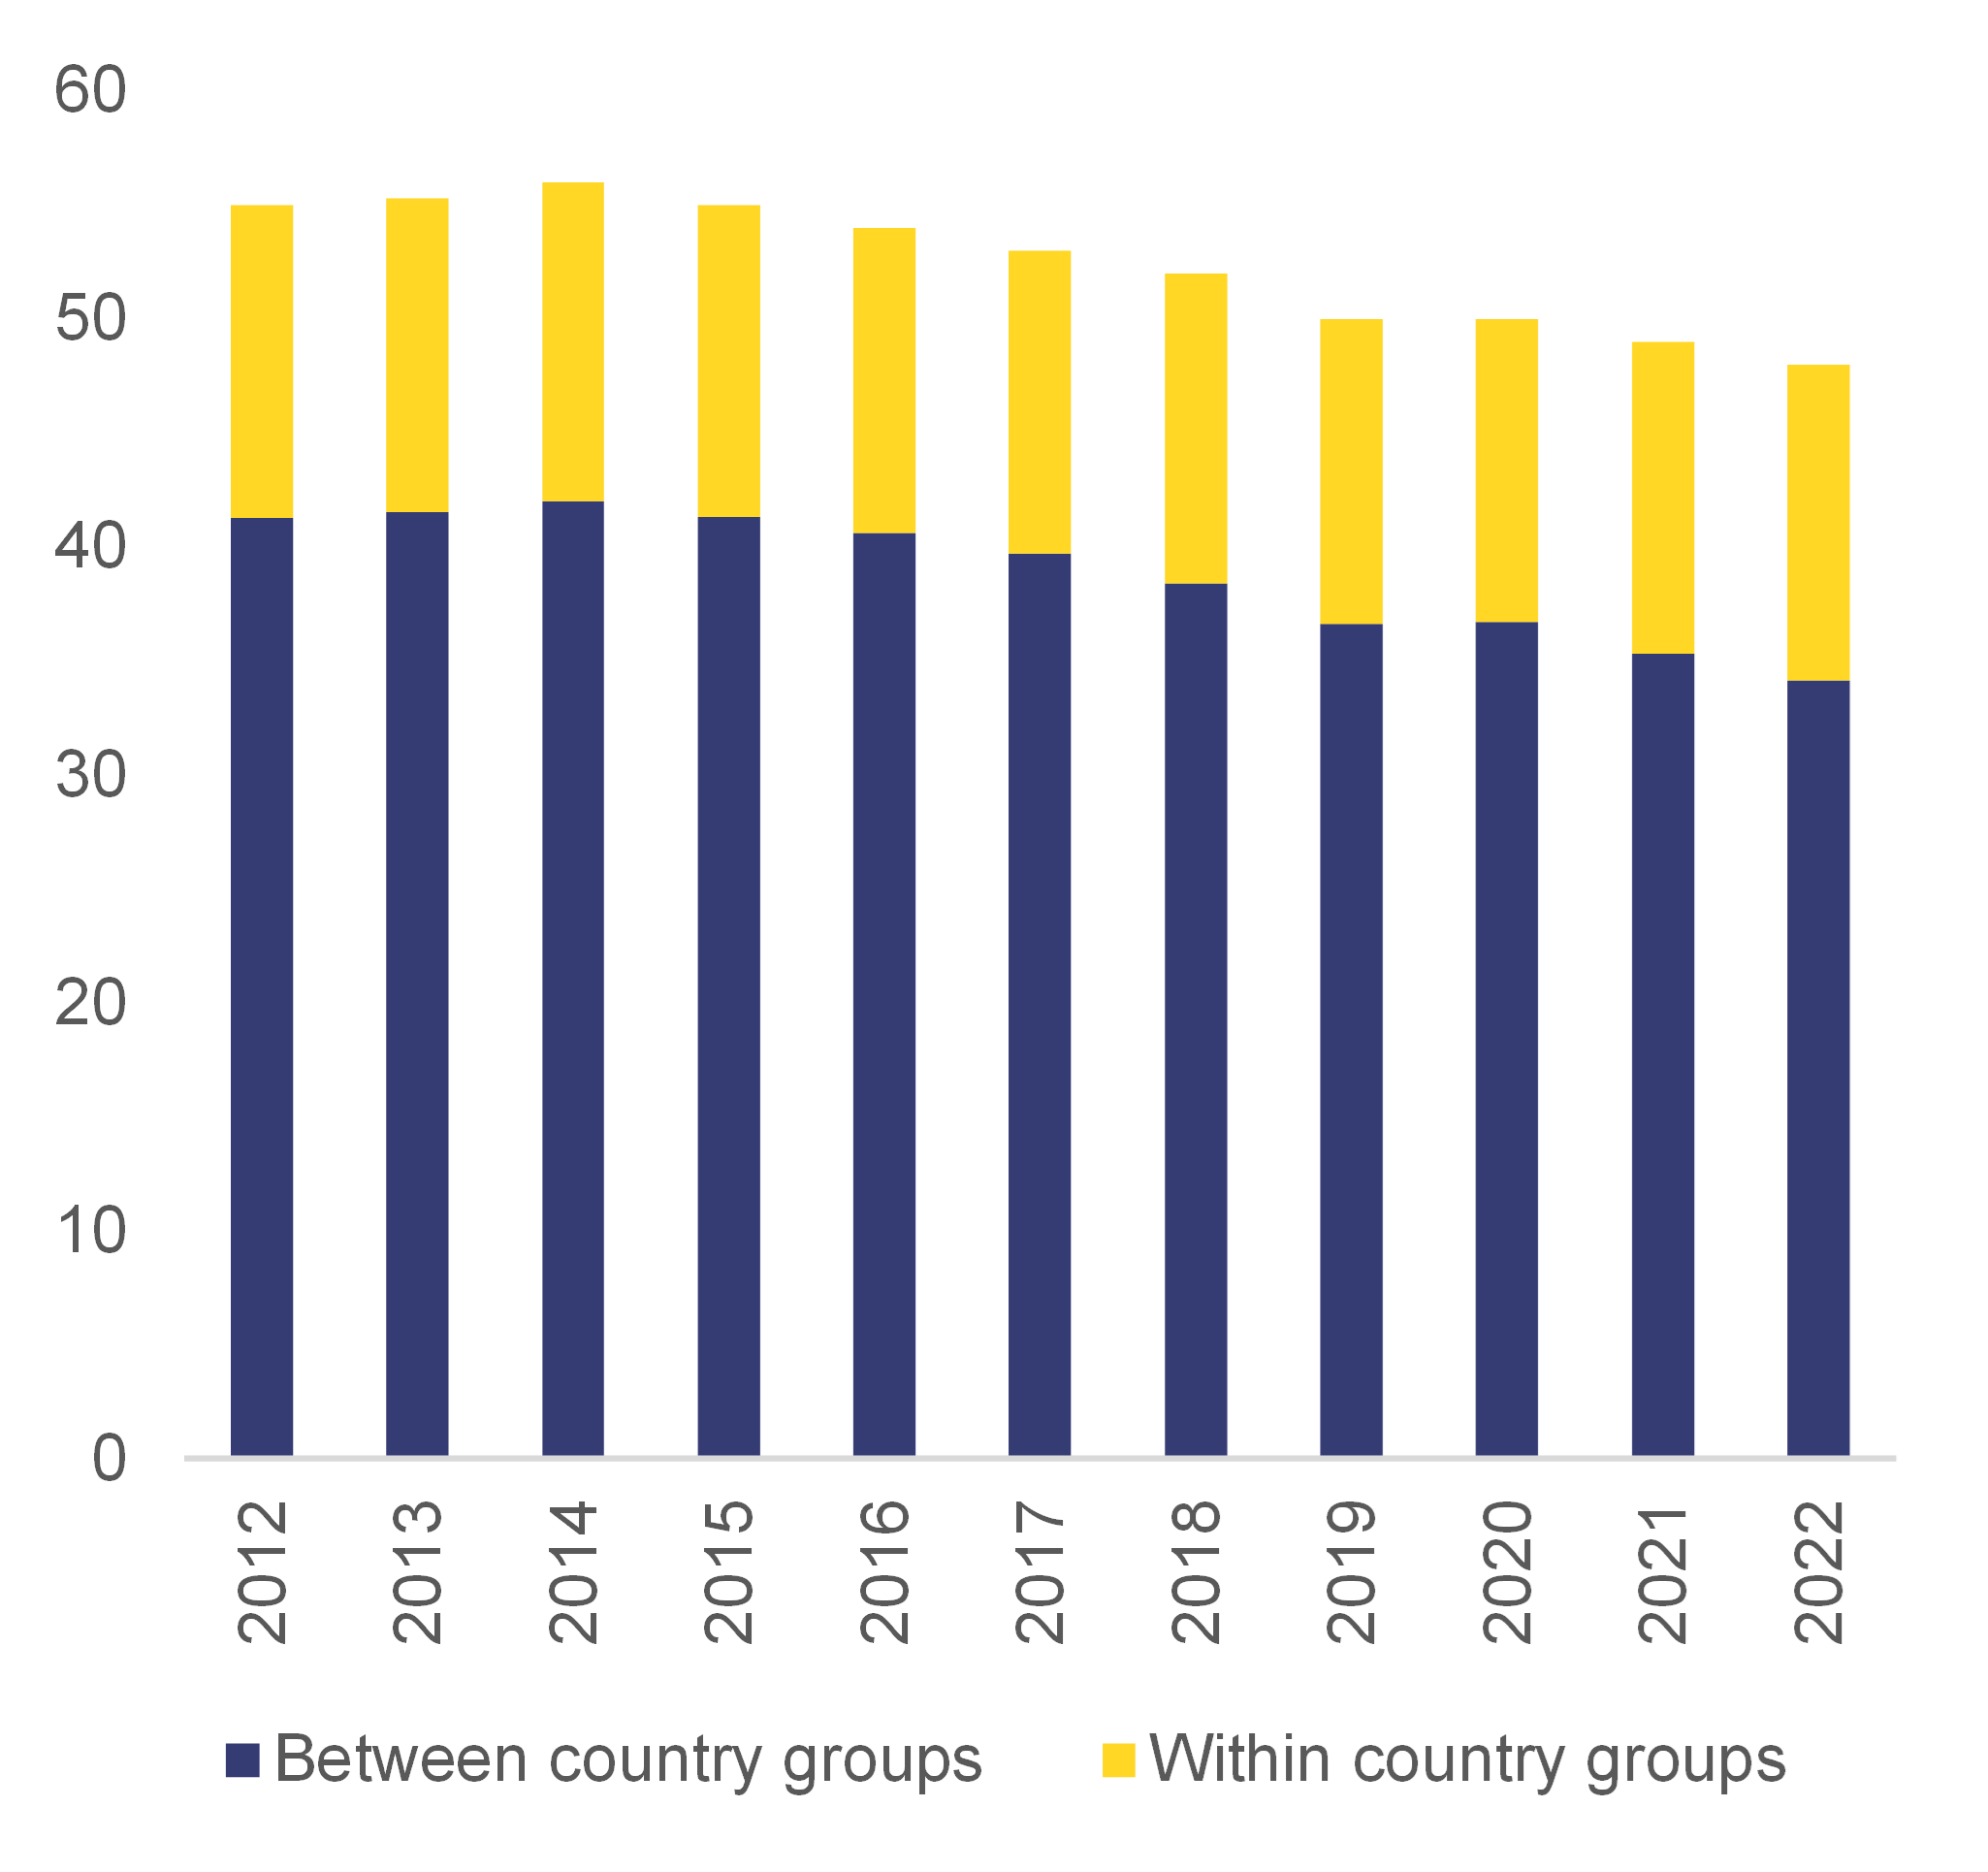
Graph 2.11: Variation of nominal compensation per employee in euro, 2000-2022
Additional information about graph 2.11
The Figure shows the development of an indicator of wage convergence over 2012-2022, and its breakdown in two components (between countries and within countries). Wage convergence is assessed using a coefficient of variation that represents the standard deviation normalised by the level of average wages. The standard deviation of wages is normalised, as it tends to mechanically increase with the increase in nominal wages over time. Normalising it allows for the comparison of dispersion across time periods.
The figure first shows that in the last decade, some upward nominal wage convergence has taken place in the EU. Such upward wage convergence is shown by the decline in the coefficient of variation for nominal wages (after 2014), associated with the rise in average wages. Regarding the breakdown of the coefficient of variation in a between and within component, Member States are classified into three groups: western European, southern European and central and eastern European countries. The figure also shows that wage convergence within the EU has been mainly driven by the convergence of wages between these groups. In particular, higher wage growth has been observed in central and eastern European countries (reflecting the catching-up process, higher inflation rates and tight labour markets). By contrast, wage convergence between southern European and western European countries has stalled since the 2007–2008 financial crisis.
Note
The coefficient of variation is defined as the ratio of the standard deviation to the mean. In particular, the coefficient of variation is a scale-invariant measure that allows for the comparison of dispersion across time periods.
Source
AMECO, own calculations.
In addition, heterogeneity persists within these groups of Member States.Over the last decade (2012–2022), the heterogeneity of nominal wages remained stable among southern European countries and somewhat increased among western European countries, as shown by the coefficients of variation . By contrast, in central and eastern European countries, a within-group convergence took place, notably due to higher wage growth in Bulgaria, Latvia, Lithuania and Romania – the Member States with the lowest initial wage levels – than in Czechia, Croatia and Slovenia – the Member States with the highest initial wage levels in this group.
Wage inequality also tends to be high within countries, between both regions and categories of workers.Based on data available for 15 Member States , wage convergence between regions in the EU appears to have been driven mainly by the convergence of capitals and large cities. Therefore, observed convergence between Member States was not accompanied by a convergence within most Member States (i.e. between capitals / wealthier regions and rural areas). When examining wage convergence at NUTS 1 (nomenclature of territorial units for statistics) regional level, regional wage divergence occurred notably in Bulgaria, Denmark and Romania. By contrast, some regional wage convergence occurred in Hungary, Finland and Sweden. A recent study also suggests a higher persistence of low pay at the individual worker level in central and eastern European countries (on top of lower average wages) than in the other EU Member States, indicating that wages for segments of the labour market are not experiencing an upward convergence .
Wage convergence in terms of purchasing power standard
In terms of PPS, the process of wage convergence has stalled since 2019(Graph 2.12 (a)) . In central and eastern European countries, the catch-up of nominal wages vis-à-vis western European countries took place less quickly than the price convergence. More precisely, from 2019 to 2021 nominal wage growth slowed down sizeably in some central and eastern European countries (notably Czechia, Croatia, Hungary and Romania). Then, from 2021, inflation increased significantly, while nominal wage growth increased less in all central and eastern European Member States. This has resulted in a persistent wage gap (in PPS) between central and eastern European countries and western European countries (Graph 2.12 (b)) . In southern European countries, while both wage growth and inflation increased after the pandemic, wages have remained more constrained, leading to a widening wage gap (in PPS) between these countries and western European countries. For both central and eastern European and southern European countries, reaching the levels of western European countries will take a long time. Assuming a hypothetical constant wage growth in PPS terms − representing the average growth since 2021 for each Member State − central and eastern European countries and southern European countries will, on average, reach similar wage levels by 2050, but they will remain more than 20 % below the average levels of western European countries.
Graph 2.12: (a) Convergence of compensation per employee in PPS, 2000–2022, and (b) average wages in PPS, by country group

Additional information about graph 2.12
The graph is composed of two panels.
The first panel displays a line illustrating the evolution of the coefficient of variation of average compensation per employee, over the period 2000-2022. A lower coefficient of variation implies a cross-country convergence of compensation per employee, measures in purchasing power standard. The line shows a steady declining trend from a value of 0.43 in 2000 to 0.33 in 2008. Then, there is a period of stability, with the coefficient remaining constant at 0.32 until 2015. The declining trend resumes in 2016, lasting until 2020. From 2020 until 2022, the coefficient of variation remains stable 0.27.
In the second panel, Member States are divided into three groups: ‘Western European countries’, ‘southern European countries’ and ‘Central and Eastern European countries’. The figure consists of a line chart displaying the evolution of average compensation per employee for these three groups, between 2000 and 2022. To begin with, in 2000 average compensation per employee is the highest in the first group (Western European countries, at 29.10), and the lowest in the third group (Central Eastern European countries, at 11.5). The second group (Southern European countries) is in between, at 22.2. Over time, average compensation grows in all three groups, but at different rates. In particular, it remains rather flat between 2008 and 2017 in Southern European countries, while the other two groups grow at a similar rate. As a consequence, the Central and Eastern European group of countries (at 29.5 in 2022) almost catches up with the group of Southern European countries (at 32.8 in 2022), while the distance from the group of Western European countries remains (47.7 in 2022) roughly the same.
Source
AMECO, own calculations.
Upward wage convergence is far from being automatic, which points to a key role for policies in facilitating it.Not only is a quick convergence in productivity levels across Member States not granted, but also workers do not necessarily reap the benefits of such productivity gains . Wage developments do not depend solely on productivity but on several other factors, such as economic structures and labour market institutions and policies (inter alia collective bargaining, skills and active labour market policy and the tax–benefit system). This indicates a prominent role for policies in the long run in facilitating upward wage convergence in the EU.