Nominal wage developments and prospects
This section looks at recent developments in average nominal wages and their growth prospects. It highlights the recent peak in wage growth, which reflects both high inflation and tight labour markets (Section 2.2.1.), looks at differences in recent wage developments between Member States (Section 2.2.2.) and underlines that wage growth is likely to increase in the coming quarters, despite the economic slowdown (Section 2.2.3.).
Recent trends in nominal wage growth
Wage growth in the EU was robust over 2022 and peaked in the first half of 2023 in almost all Member States. At the EU level, the annual growth in nominal compensation per employee reached 5.1 % in 2022 . It rose to 6 % in the second quarter of 2023 (compared to the same quarter of 2022) (Graph 2.1). Most Member States registered annual growth rates in the first half of 2023 that were the highest levels since 2000. The peaks in annual wage growth were reached in the fourth quarter of 2022 in Bulgaria, Denmark, Ireland, Italy and Malta and in the third quarter of 2022 in Poland. These growth rates are historic highs and significantly higher than before the pandemic (1.9 % from 2013 to 2019).
Graph 2.1: Nominal compensation per employee, annual percentage change
Additional information about graph 2.1
The figure consists of a bar chart showing the change in nominal compensation per employee in each Member State for 2021, 2022 and in the second quarter of 2023. The changes are all positive, and they increase over time in a majority of Member States. In the latest period, i.e. second quarter of 2023, the highest changes are found in Romania (19%) and Hungary (17%), followed by Slovenia, Poland, Latvia, Croatia and Lithuania who also record double-digit increases between 13% and 11%. The average for the EU is 6%. The smallest changes are found in Malta (1.5%) Sweden, Italy and Denmark (just above 3%). In these four countries, the growth of nominal compensation was higher in 2022 and 2021 (between 4% and 5%). Bulgaria also stands out, as very high growth (at 18.3%) was registered in 2022, while this was down to 7.5% in the second quarter of 2023 – not far from the EU average. For all countries except Malta, the values are well above the EU average for the period 2013-2019, which was 1.9%.
Note
EA-20, the 20 countries that have adopted the euro. Nominal compensation per employee is calculated as the total compensation of employees divided by the total number of employees.
Source
AMECO database and Eurostat, National accounts [namq_10_gdp, namq_10_a10_e].
These developments in nominal wages reflect high inflation and tight labour markets. In the EU, headline inflation reached 9.2 % for 2022 as a whole, peaking at 11.5 % in October 2023 (on a year-on-year basis), and stood at 5.9 % in August 2023 (latest data available). As discussed in Chapter 1., labour market conditions also remained very tight, with the EU unemployment rate and the labour market slack indicator hitting record lows in the second quarter of 2023 (6.0 % of the active population and 11.9 % of the extended labour force, respectively) and high labour shortages being reported . At the same time, wage growth was mitigated by a number of factors, including increased uncertainty about labour market prospects and an increased labour supply through higher labour market participation. While the recovery in the number of hours worked following the pandemic was the main driver behind high nominal wage growth in 2021, this played a smaller role in 2022 .
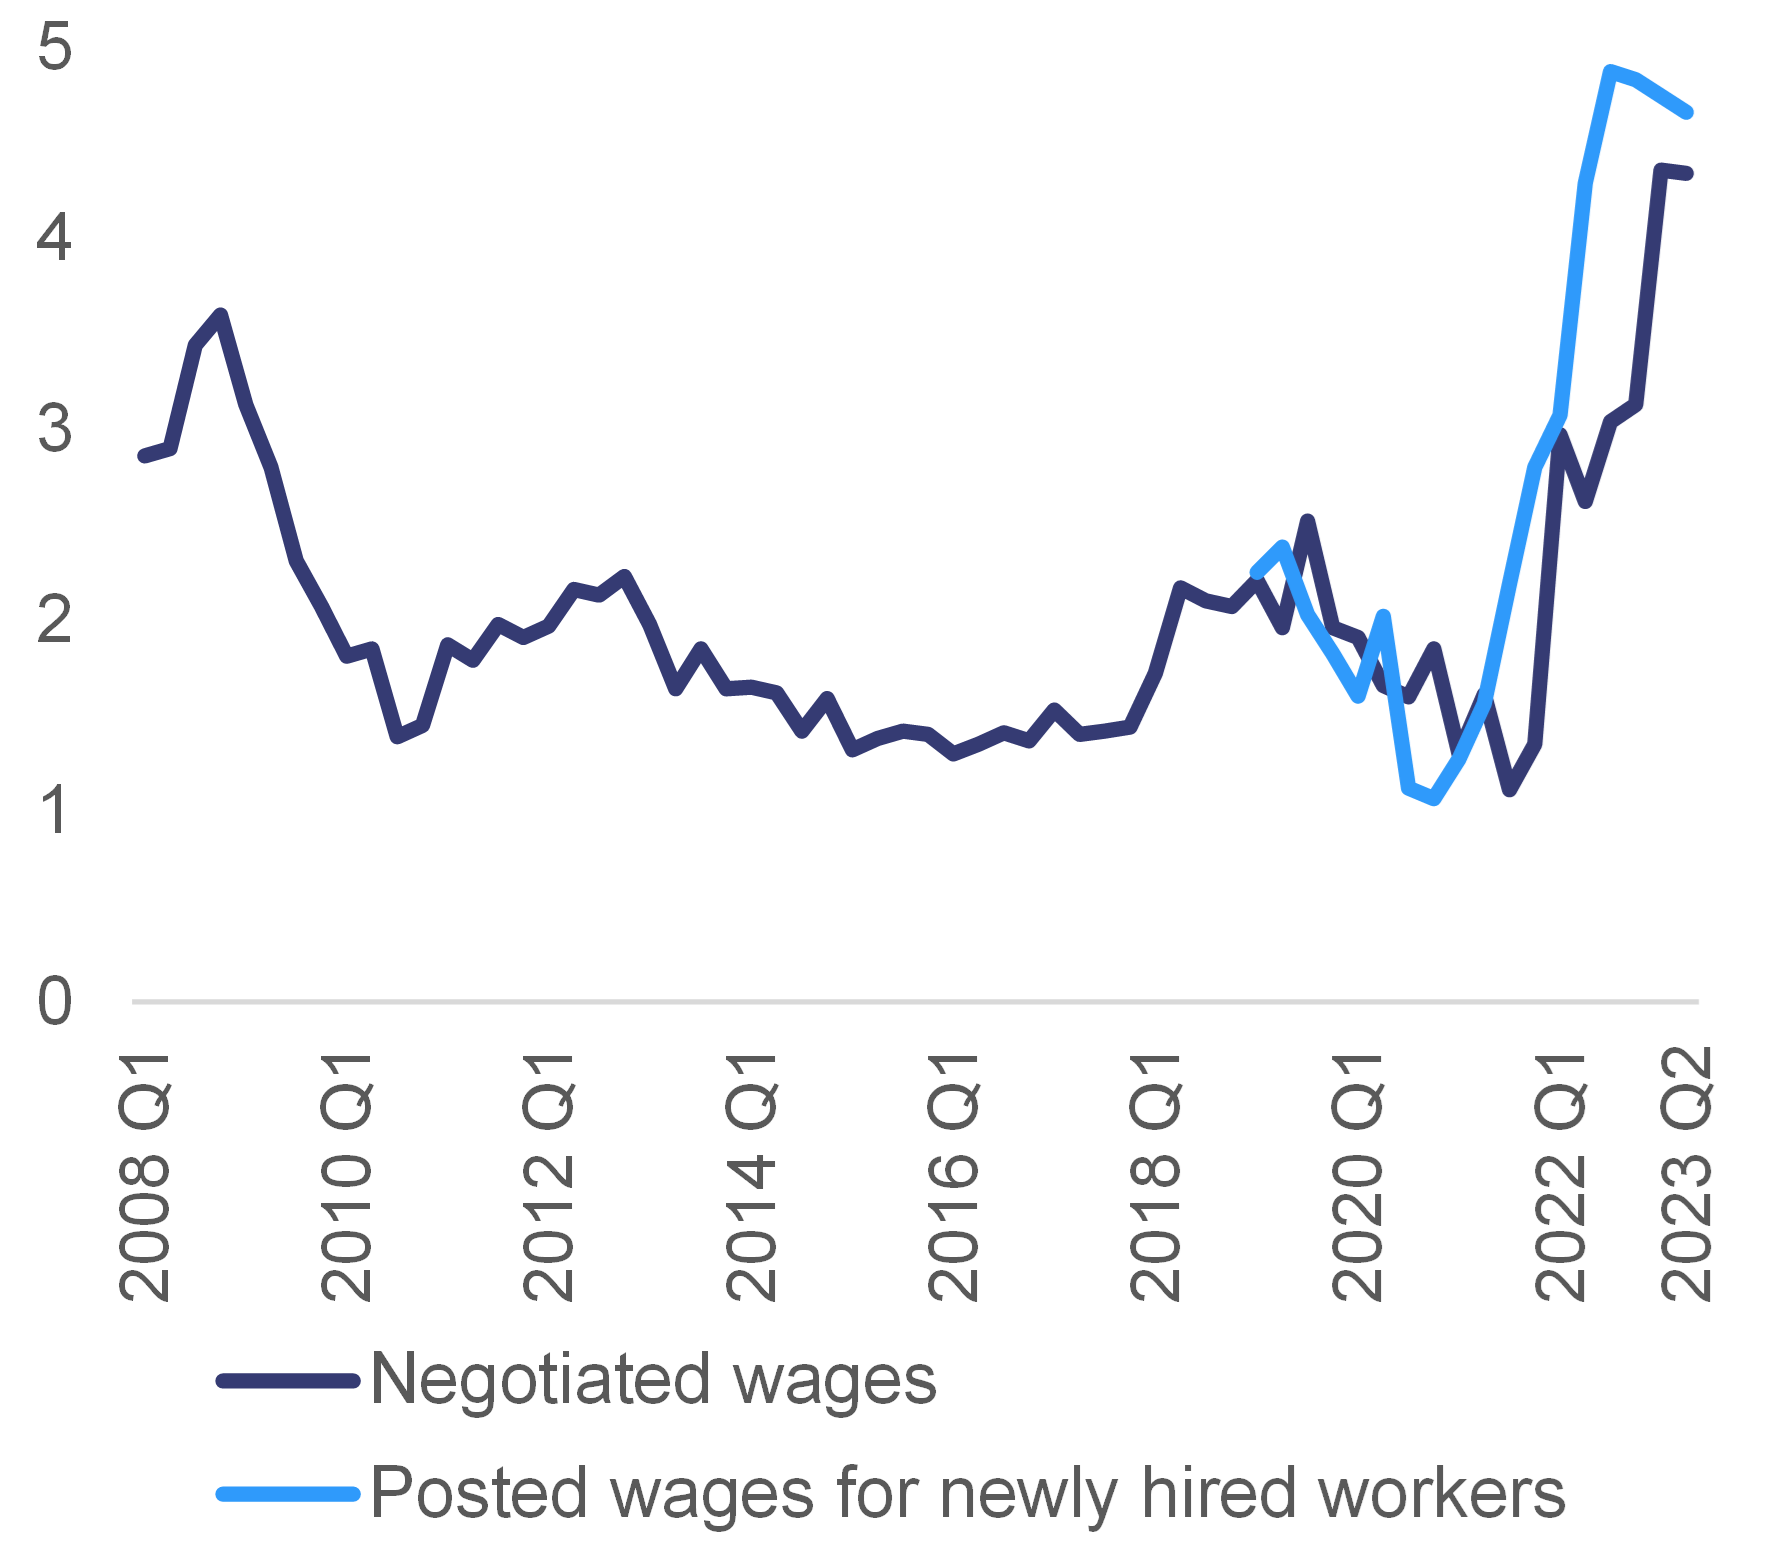
Negotiated wages in the euro area also continued to grow at a record high pace .They increased by 4.3 % (on an annual basis) both in the first and second quarters of 2023, significantly above the growth rates observed in the previous quarters (between 2.6 % and 3.1 % over 2022) (Graph 2.2). These rates were the highest since 2009, in a context where calls to compensate for purchasing power losses have become a pivotal element in wage negotiations. The rates reflect not only permanent pay increases, but also large one-off payments – notably in Germany – particularly in the chemical and pharmaceutical industries and the engineering/metal sector .
Graph 2.2: Growth of negotiated wages and of wages in job postings (%), euro area
Additional information about graph 2.2
The figure shows the annual growth rate (as a percentage) of negotiated wages in the euro area, as well as of wages in job postings in the Indeed website for six of the largest euro area countries - Germany, France, Italy, Spain, the Netherlands and Ireland). Data on negotiated wages cover the wages offered to incumbent workers, while data on wages in job posting concern new hired workers only. Compared with wages paid, negotiated wages are not sensitive to the number of hours worked and in some sectors they represent a wage floor.
Developments in negotiated wages are shown for the period between 2008Q1 and 2023Q2, while those for posted wages (for newly hired workers) are shown for the period between 2019Q1 and 2023Q2. As regards the growth of negotiated wages, one can observe a marked slowdown between 2008 and 2010 (from almost 4% to around 1%) in the context of the great financial crisis. After that, negotiated wages grew at moderate rates (between 1.5% and 2%) until 2020Q1, when they went back to growing by 1%. In 2022Q1, the growth of negotiated wages increased again, in a context of high inflation and tight labour markets, reaching 4.3% in 2023Q1. Regarding wages in job postings, the graph illustrates the decile in their growth rate went from 2% to 1% during the Covid pandemic, and their rebound afterwards (as growth rate reached 5% in 2023Q1).
Note
The wages in job postings or the “wage growth tracker” is an indicator developed by the Central Bank of Ireland. It reflects the pay offered to a new hired worker in six of the largest euro area countries (Germany, France, Italy, Spain, the Netherlands and Ireland). The negotiated wages indicator also covers the wages offered to incumbent workers.
Source
European Central Bank [STS.Q.U2.N.INWR.000000.3.ANR] and Central Bank of Ireland.
Drivers of recent wage developments across Member States
Recent wage growth significantly varies between Member States, notably due to significant differences in inflation and in labour demand and supply. The highest nominal wage growth in the second quarter of 2023 was witnessed in central and eastern European Member States, such as Romania (19 %), Hungary (17 %), Slovenia (13.3 %) and Poland (13.2 %) (see Graph 2.1). These countries were characterised by high inflation and tight labour markets. By contrast, wage growth was the lowest in Denmark (3.4 %), Italy (3.3 %), Sweden (3.3 %) and Malta (1.5 %), where inflation is relatively lower.
Country-specific labour market features have played a role in wage developments.Automatic wage indexation covers a large share of the economy in Belgium, Cyprus, Luxembourg and Malta. It contributed to high wage growth in Belgium, but not in Luxembourg, where indexation was suspended between June 2022 and April 2023. By contrast, in Cyprus and Malta inflation was relatively low, so the effect of wage indexation has not been as significant. In addition to indexation mechanisms, in Italy, forward-looking inflation measures (which exclude energy) are used as a basis for wage negotiations at the sectoral level . As inflation is expected to decline, this feature may partly explain the relatively moderate wage growth in Italy. By contrast, in central and eastern European Member States, fast wage growth may have resulted from market forces (such as the long-running catch-up process, initially lower wages and very high inflation), rather than from institutional features of the labour markets (since these countries are characterised by more fragmented wage bargaining and lower collective bargaining coverage) .
Wage growth prospects
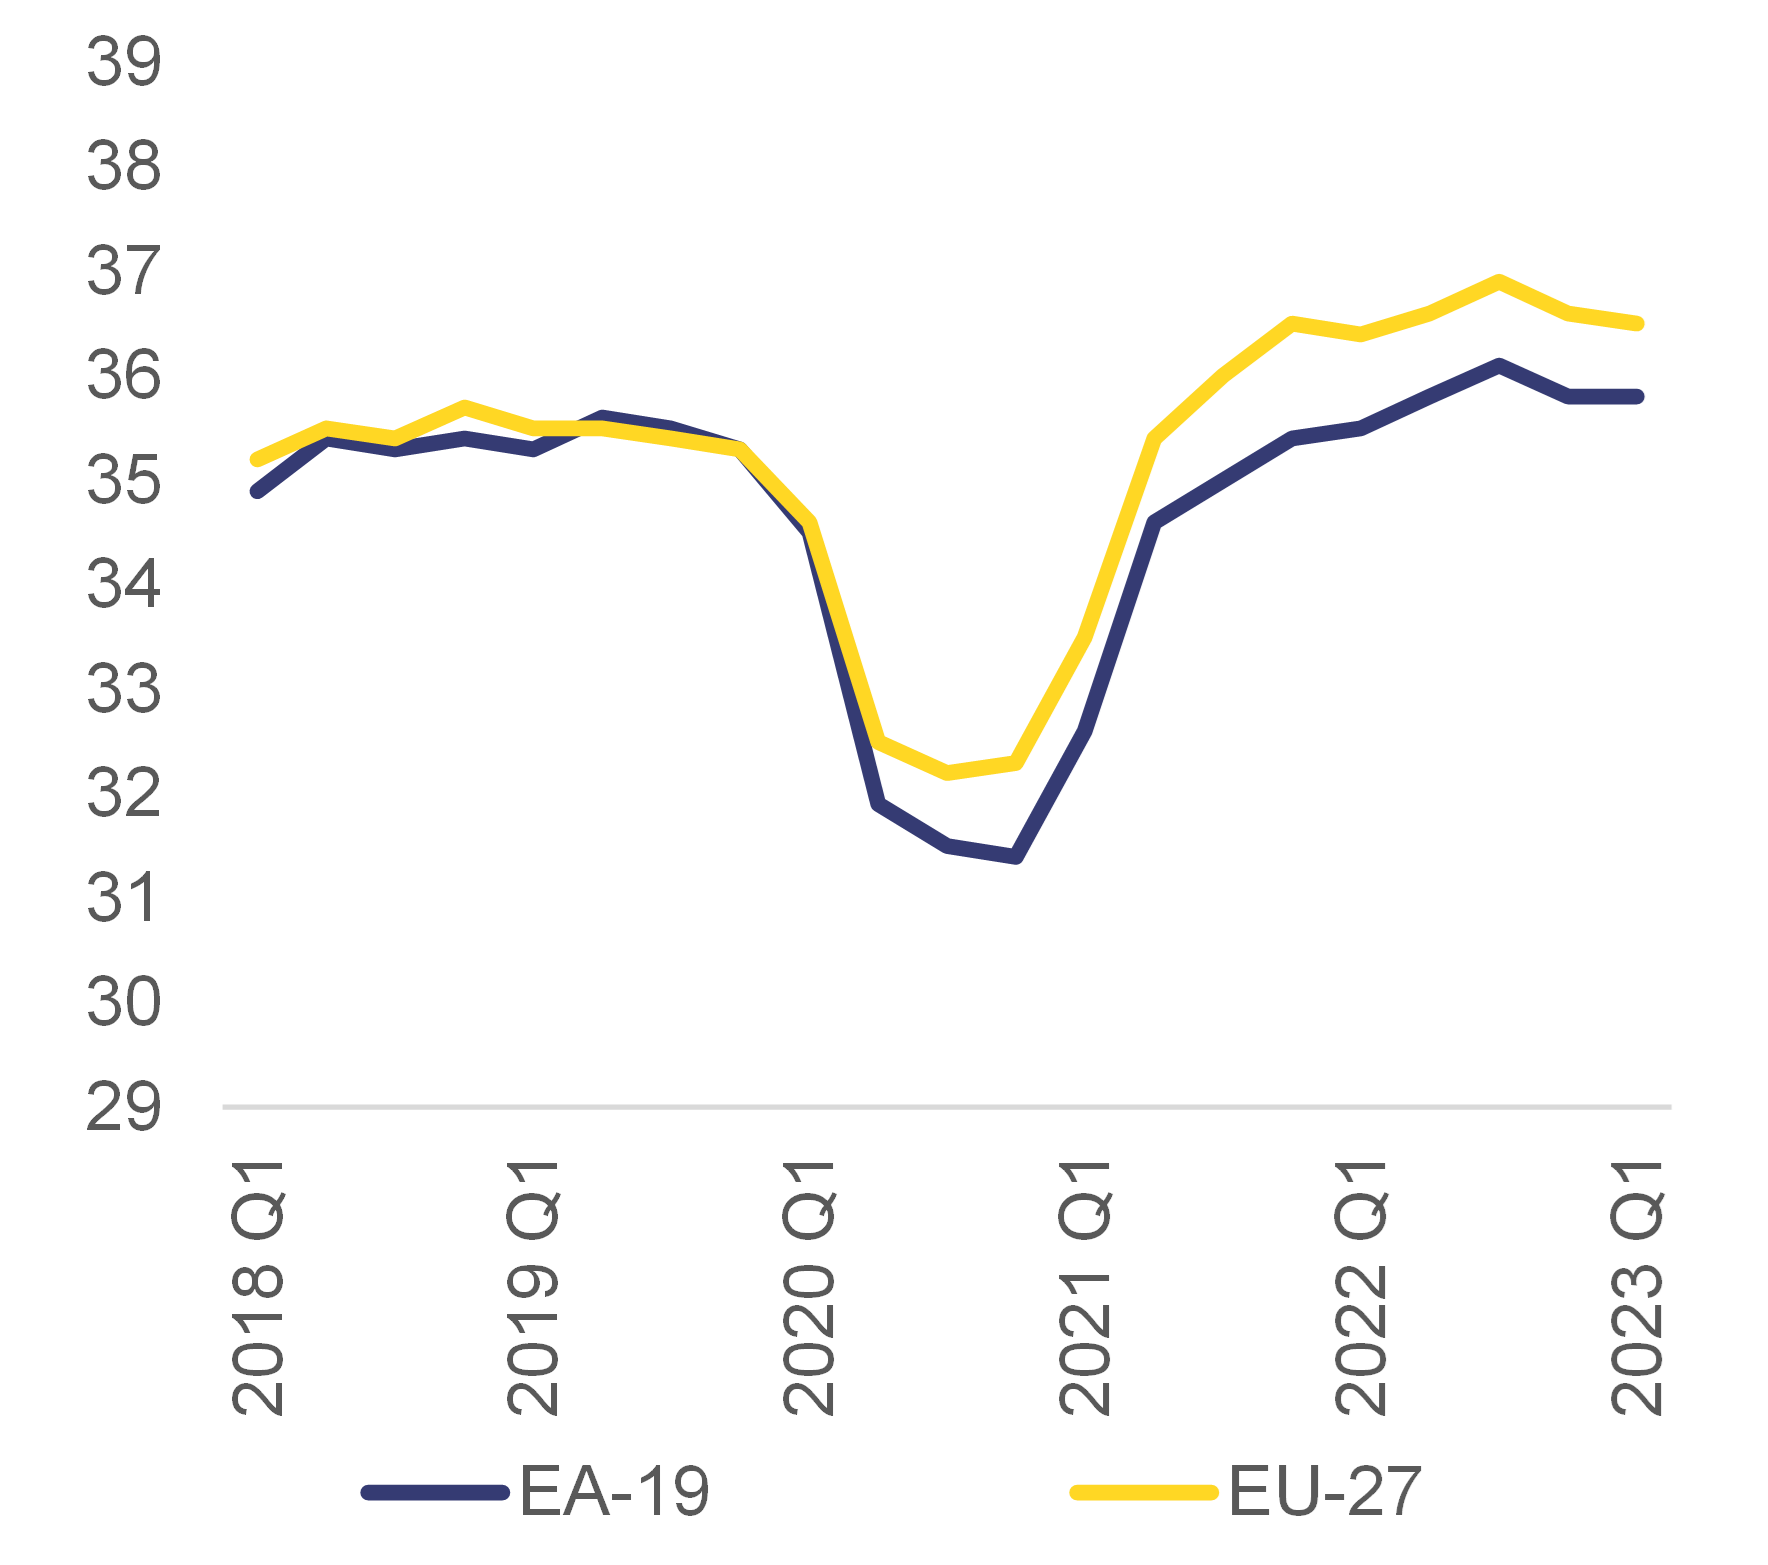
Wage growth is likely to remain high over the coming quarters despite the economic slowdown. While inflation and labour shortages showed signs of attenuation in the first quarter of 2023, as discussed in Chapter 1., they remain high. In addition, wages tend to have a delayed reaction due to the staggered nature of wage negotiations . Furthermore, firms in some sectors appear to have room to absorb wage increases without increasing consumer prices, notably thanks to resilient profit margins (Graph 2.3) . Therefore, high wage growth is expected to persist over the coming quarters of 2023, also in light of workers’ demand to recoup lost purchasing power. This is reflected in the 2023 spring European economic forecast, which predicts compensation per employee to grow by 5.9 % in 2023, after an increase by 5.1 % in 2022 (Graph 2.A1.1 in Appendix 1). In 2024, wage growth may slow down (forecast at 4.6 %), notably due to declining inflation and somewhat less job-rich economic growth. However, uncertainty remains high regarding the outlook of both growth and inflation, which can significantly affect wage developments in both directions.
Graph 2.3: Net income ratio of non-financial corporations in the euro area and the EU (%)
Additional information about graph 2.3
This graph illustrates developments in the net income ratio of non-financial corporations in the euro area and the EU between 2018Q1 and 2023Q1. One can observe that the net income ratio for both the euro area and the EU remained stable at around 35% until 2020Q1, but then rapidly decreased during the Covid pandemic. The fall was slightly more pronounced for the euro area (down to around 31.5%) than it was for the EU (down to around 32.5%). In 2021Q1, the net income ratio of non-financial corporations rebounded to pre-pandemic levels for both the EU and the euro area. It then went somewhat above these levels (notably for the EU) and remained relatively stable until 2023Q1 (at around 35% for the euro area and at around 36% for the EU).
Note
EA-19, the 19 countries that had adopted the euro before 2023. Data represent the net entrepreneurial income as a percentage of net value added, based on four-quarter-cumulated sums. Net entrepreneurial income can be derived from net operating surplus by adding all property income received and withdrawing interest and rents paid.
Source
Eurostat, National accounts [nasq_10_nf_tr], and European Central Bank.
Wage growth is expected to remain strong, but prospects differ between Member States.The indicators of nominal wage growth in job postings (i.e. for newly hired workers) in selected euro-area Member States grew at a stable rate (around 4.7 %) in the second quarter of 2023 (see Graph 2.2), markedly above the indicator of negotiated wages (that also includes the wages offered to incumbent workers) since the third quarter of 2021. This suggests that negotiated wages in the euro area may increase further in the coming months . However, patterns differ between Member States. Over the last few months (up to July 2023), while the growth of wages in job postings (thus, for newly hired workers) remained stable or increased in France, Germany, Spain, France and the Netherlands, it decreased markedly in Ireland and Italy (Table 2.A1.1 in Appendix 1).
Recent wage agreements also point to significant pay increases in the coming quarters, notably in services. The increases are expected to outpace current inflation, since negotiations have also focused on partially recovering purchasing power losses. For instance, in Germany large wage increases were agreed for public-sector workers at Deutsche Post . Other examples of noteworthy wage agreements in services include those concerning healthcare workers in Estonia and Spain, workers at the Schiphol airport and in regional transport in the Netherlands, and the postal services in Austria . In manufacturing, negotiated pay rises tend to fall short of inflation . However, as mentioned above, one-off payments to workers have also helped to mitigate purchasing power losses, notably in Germany but also in Czechia, Italy and Finland. Finally, in Luxembourg, the automatic wage indexation, postponed in June 2022 until April 2023, has now been reactivated as planned.