Wages and labour costs developments in the EU and its Member States
Annex 2.1: selected graphs
Graph 2.15: Compensation per employee in purchasing power standards (PPS)

Note:
(1) Data for total economy in 1.000 EUR.
Source:
Ameco [5 0 0 0 HWWDW, 5 0 0 0 ZCPIH]
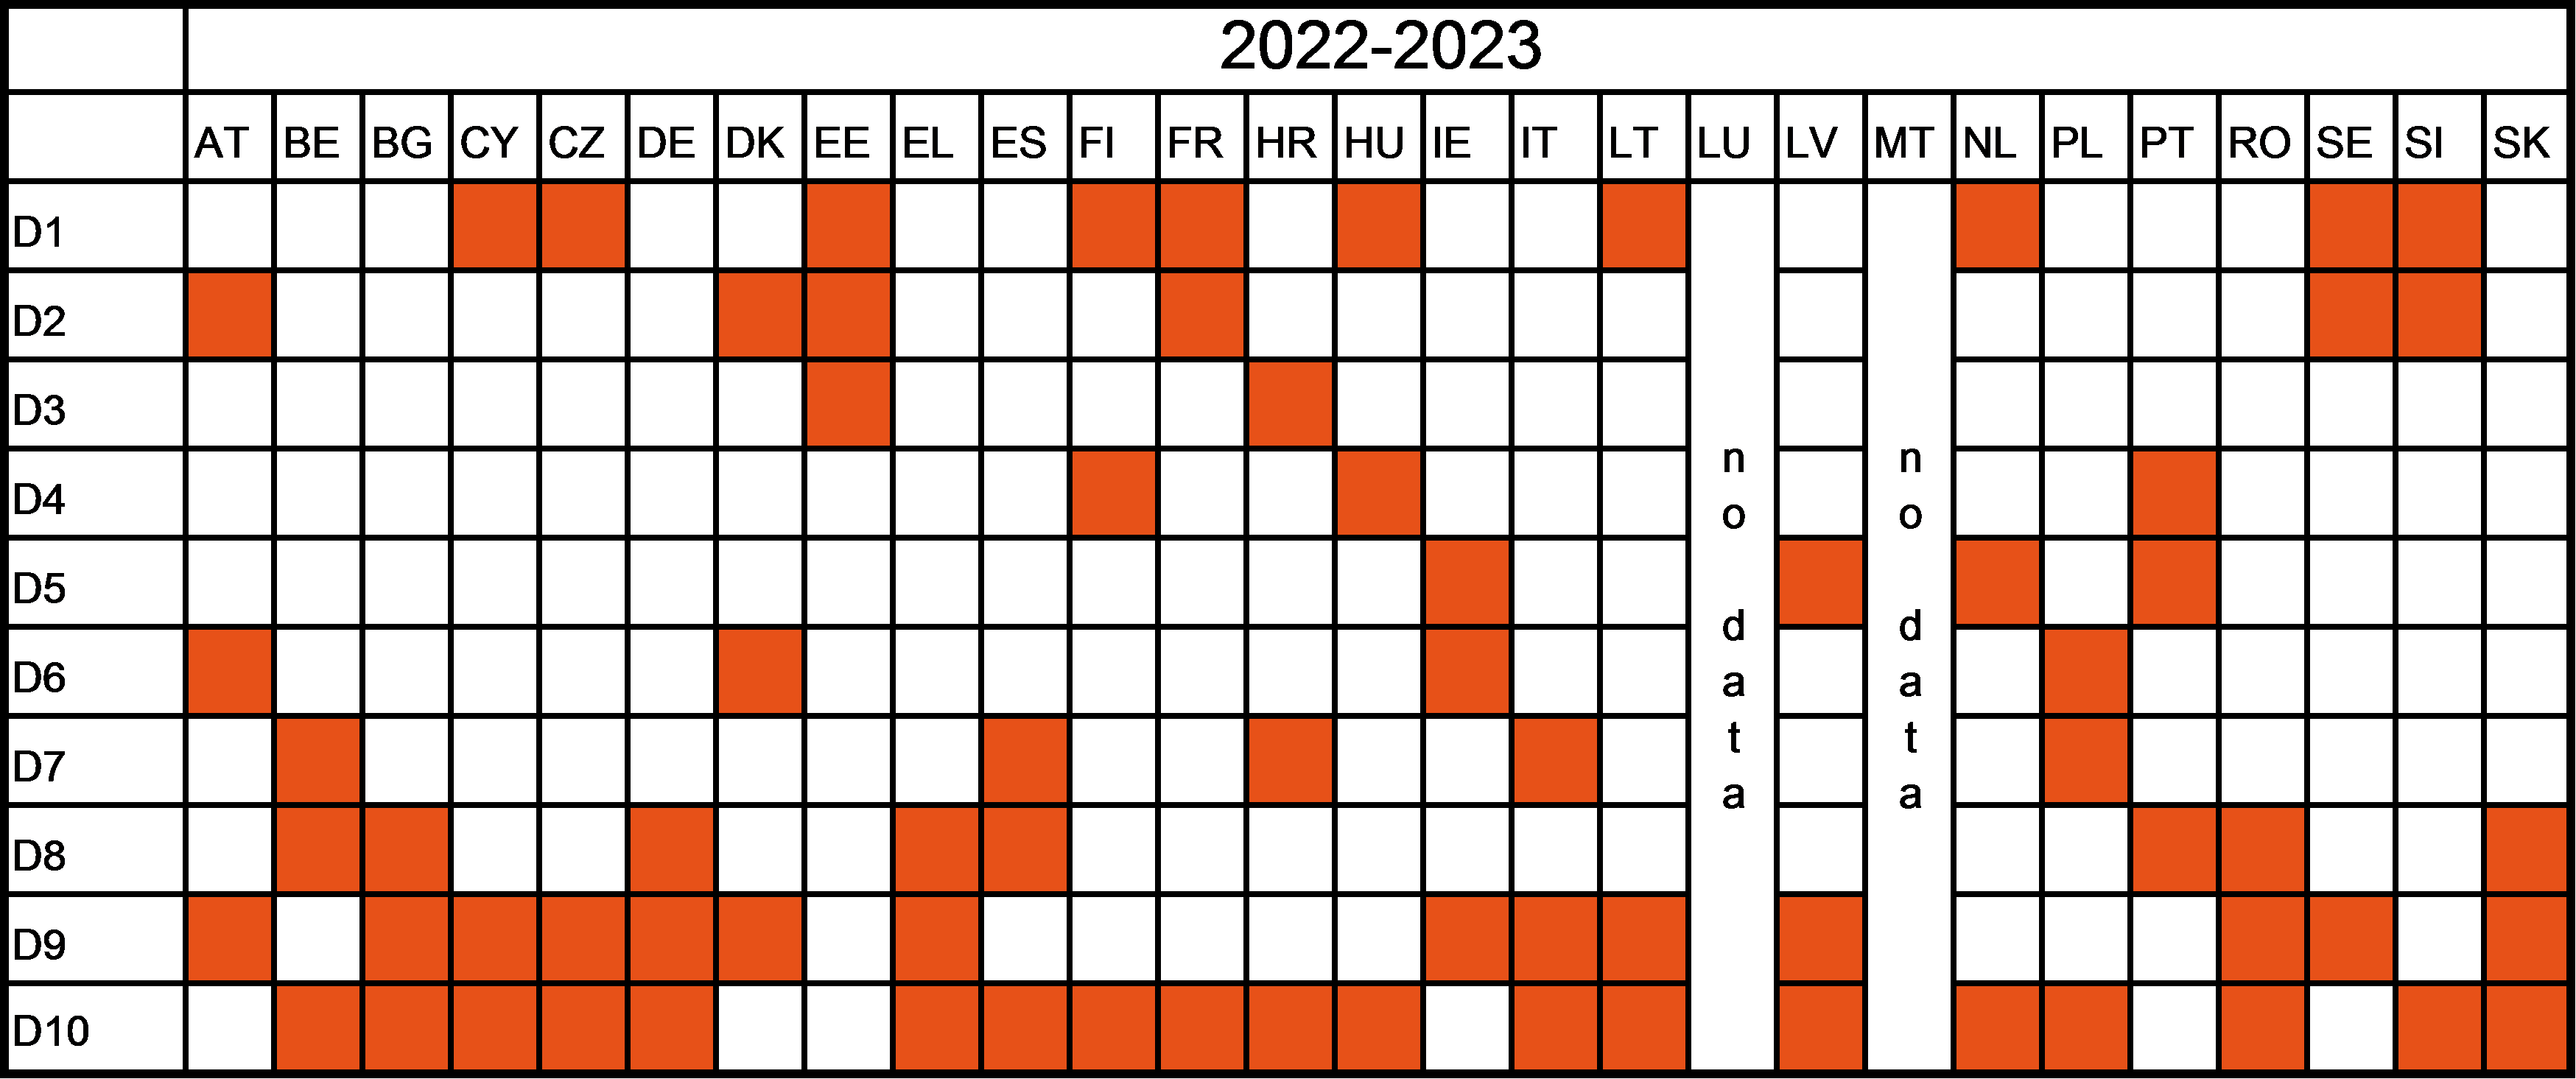
Table 2.1: The three income deciles with lowest increase across 2022 and 2023 per Member State

Note:
(1) Data for Luxemburg and Malta not available for 2023. Growth rates between country specific capping incomes for each decile were calculated for 2021-2022 ad 2022-2023. The three deciles with the lowest growth rates were highlighted in orange.
Source:
EU-SILC and ECHP Survey, Eurostat [ilc_di01]
Table 2.2: The income deciles with lowest increase per Member State for 2022 and 2023

Note:
(1) Growth rates between country specific capping incomes for each decile were calculated for 2021-2022 and 2022-2023. The three deciles with the lowest growth rates were highlighted in red.
Source:
EU-SILC and ECHP Survey, Eurostat [ilc_di01]
Graph 2.16: Wage levels (2021) and hourly growth rates (based on labour cost index)

Note:
(1) 2021 refers to the hourly real wage in EUR (left scale), Average Q1 2022 - Q4 2024 refers to the Labour Cost Index (right scale). Sectors are ranked according to average full-time adjusted salaries per employee in 2019 calculated by multiplying wages per employee with the ratio of average number of usual weekly hours worked full-time versus total employment weighted by employment in sectors to correspond to sector groups of compensation per hour worked. Average full-time adjusted salary per employee was then deflated using the harmonized index of consumer prices (hicp). Hourly growth rates calculated based on increases in labour cost index.
Source:
Eurostat [nama_10_a10, nama_10_a10_e, lfsa_ewhun2, prc_hicp_midx].
