

Every Member State, all of us, have to know and to understand that it is not possible to stop the virus, but it is possible and of utmost importance to slow down the spread of the virus. That is doable.
Ursula von der Leyen, President of the European Commission
- content
-
EU Datathon 2020 - COVID-19 COVID-19 data for EU Datathon Webinars on COVID-19 data EU activities related to COVID-19 COVID-19 dataset Visualisations about COVID-19 Media monitoring Data monitoring Air quality monitoring Webinar about COVID-19 maps

COVID-19 data for EU Datathon
If we work together and we stay united, we are stronger against COVID-19 pandemic.
We are encouraging submissions for COVID-19 by applying the data to the four challenges.
Webinars on COVID-19 data
Webinar dedicated to COVID-19 data
Recorded on 8 April 2020
Presented by the European Centre for Disease Prevention and Control

Webinar on COVID-19 and media and data monitoring
Recorded on 22 April 2020
Presented by the Joint Research Centre of the European Commission

Webinar on COVID-19 and air quality
Recorded on 23 April 2020
Presented by the European Environment Agency
EU activities related to COVID-19
The European Commission has taken several actions to tackle the outbreak of Coronavirus:
- providing daily updates;
- giving guidance to governments, health professionals and the public;
- supporting the development and approval of vaccines & treatments;
- helping with crisis coordination (including repatriation and humanitarian aid);
- putting border controls in place;
- helping with supply chain control and consular coordination.
The Commission is also tackling the situation with EU-funded research like on CORDIS.
We must work together to ensure that [this shock] is as short and as limited as possible, and that it does not create permanent damage to our economies.
Ursula von der Leyen, President of the European CommissionCOVID-19 dataset
The European Centre for Disease Prevention and Control is publishing a dataset about COVID-19 on the EU Open Data Portal.
The dataset contains the latest available public data on COVID-19 including a daily situation update, the epidemiological curve and the global geographical distribution (EU/EEA and the UK, worldwide). On 12 February 2020, the novel coronavirus was named severe acute respiratory syndrome coronavirus 2 (SARS-CoV-2) while the disease associated with it is now referred to as COVID-19. ECDC is closely monitoring this outbreak and providing risk assessments to guide the EU Member States and the European Commission in their response activities.
The dataset also offers a visualisation about the worldwide situation and about the geographical distribution.
The European Data Portal publishes datasets about COVID-19 from European countries here.
Visualisations about COVID-19
The following visualisations are done by the Publications Office of the European Union by using the ECDC COVID-19 dataset.
Number of new confirmed COVID-19 cases per day
Number of confirmed COVID-19 cases per day (cumulative)
Number of confirmed COVID-19 cases per day in Europe (cumulative)
Media monitoring about COVID-19
Medical Information System
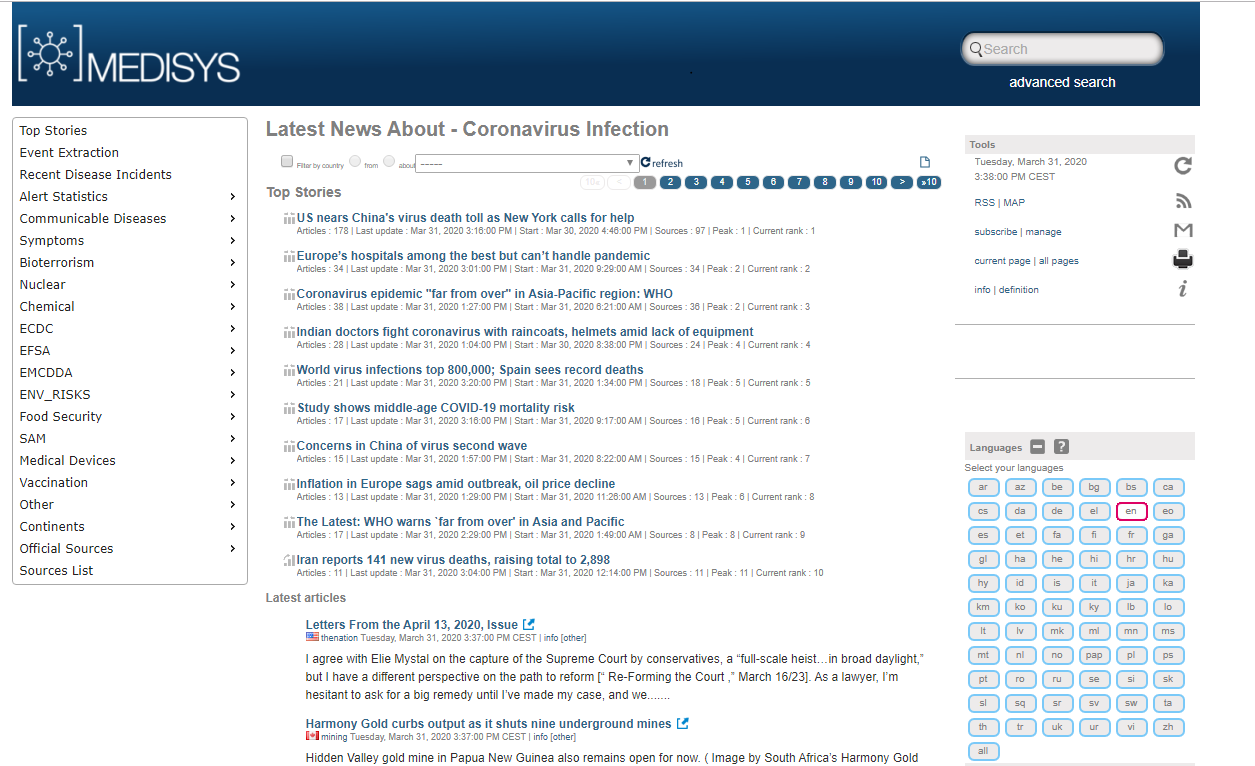
MEDISYS is a media monitoring system providing event-based surveillance to rapidly identify potential public health threats using information from media reports. The system displays only those articles with interest to public health (e. g. diseases, plant pests, psychoactive substances), analyses news reports and warns users with automatically generated alerts.
It provides a live news feed about COVID-19 and a live RSS feed associated with coronavirus. It is publicly available, and anyone can build applications on top of that.
The information processed by MEDISYS is derived from the Europe Media Monitor (EMM).
Europe Media Monitor (EMM)
The freely accessible Europe Media Monitor (EMM) is a fully automatic system that analyses both traditional and social media. It gathers and aggregates about 300,000 news articles per day from news portals world-wide in up to 70 languages.
EMM-NewsBrief
EMM-NewsBrief groups related items, categorises them into thousands of classes, extracts information, produces statistics, detects breaking news and sends out alerts. NewsBrief is updated every 10 minutes, 24 hours per day.
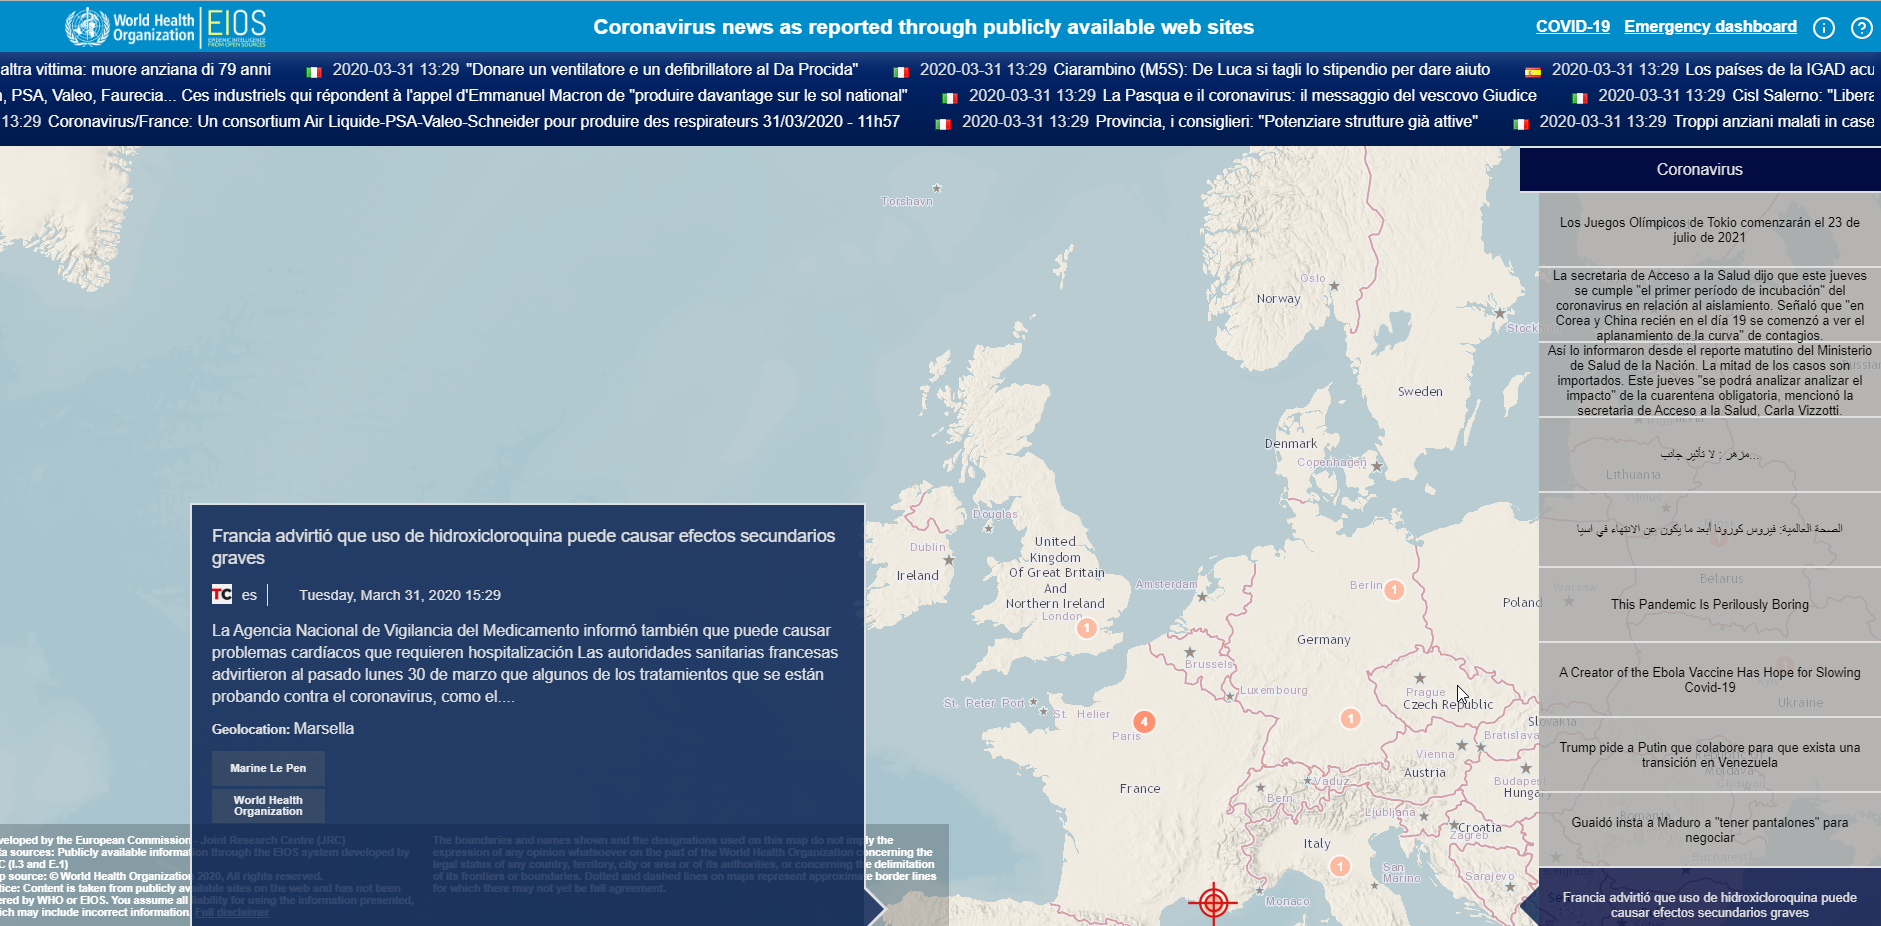
This technology has been used to develop a coronavirus big-screen map application for WHO), using data from EIOS.
A big-screen map for social-political media monitoring is available here.
All applications are developed by the European Commission’s Joint Research Centre (JRC).
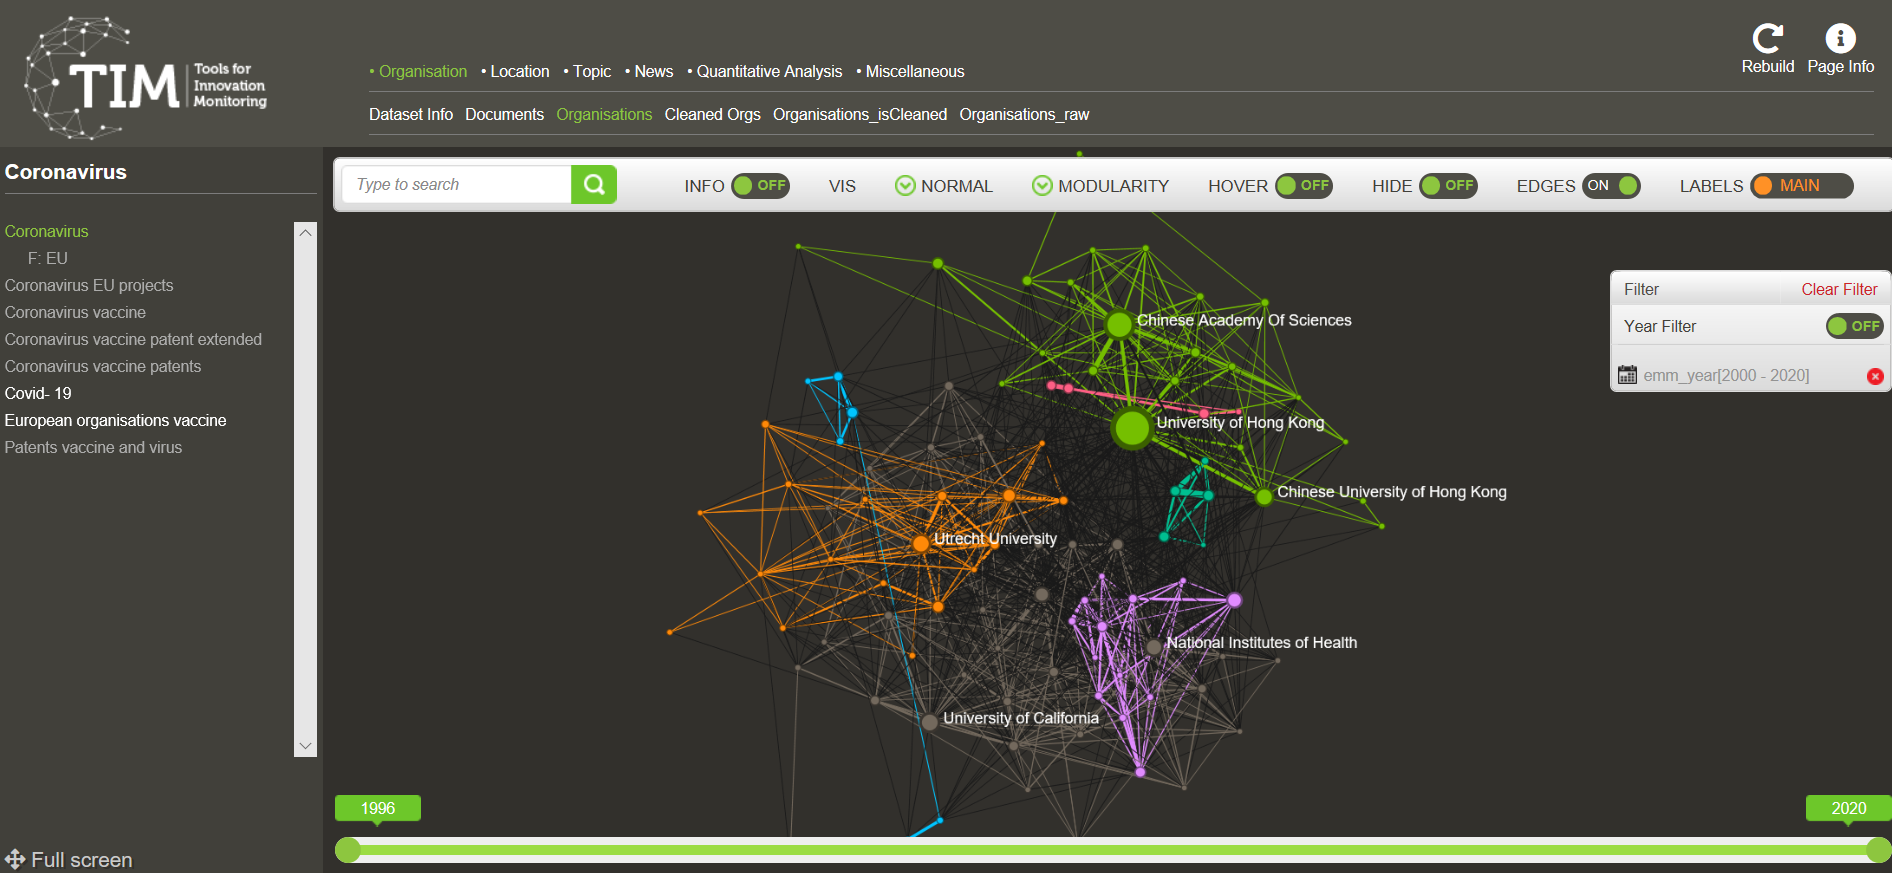
Monitoring the research landscape on Coronavirus with Tools for Innovation Monitoring (TIM)
The effect of the coronavirus on society and the global economy is unprecedented and it will need to trigger extraordinary research efforts.
The Joint Research Centre is monitoring the research landscape on Coronavirus with TIM analytics, which relies on datasets containing scientific publications, patents, and EU-funded R&D projects.
The interactive tool allows the user to navigate the data and customise the visualisation using filters, showing cumulated values, bar charts.
A Coronavirus public space in TIM has been made available for anybody to explore and navigate the data.
Data monitoring about COVID-19
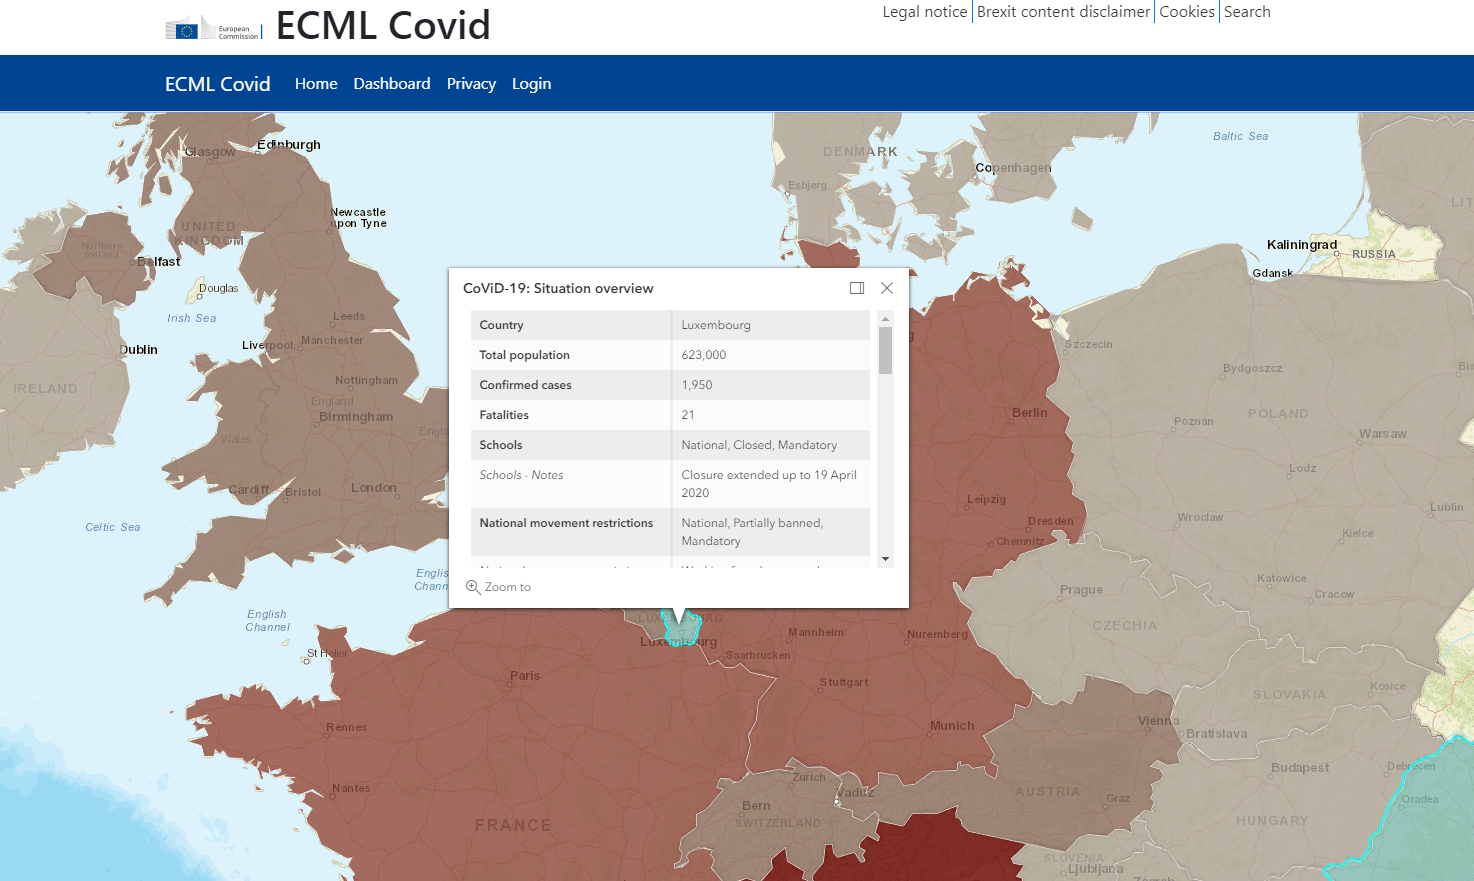
European Crisis Management Laboratory - COVID - Data monitoring and national measures
Since the outbreak of the COVID-19 crisis, the Joint Research Centre (JRC) has been supporting the European Commission in multidisciplinary areas to understand the COVID-19 emergency, anticipate its impacts, and support contingency planning. This activity forms part of a broader effort by JRC to contribute through crisis coordination mechanisms with the detection, monitoring and analysis of the COVID-19 outbreak.
The tool provides an overview of the monitoring in the area of the 34 European Union Civil Protection Mechanism (UCPM) participating states plus Switzerland, related to:
- sub-national data (admin level 1) on numbers of contagious and fatalities by COVID-19, collected directly from the National Authoritative sources (National monitoring websites, when available);
- containment measures adopted by National Authorities to reduce transmission of COVID-19, daily updated.
Information is crucial to further developing and assessing epidemiologic models for forecasting caseloads in different containment and exit scenarios, to support the National Authorities and to build a European response to COVID-19. Moreover, the sub-national granularity of the data allows having a fit-for-purpose model to early capture the local spread and response to the COVID-19.
Webinar on data and media monitoring
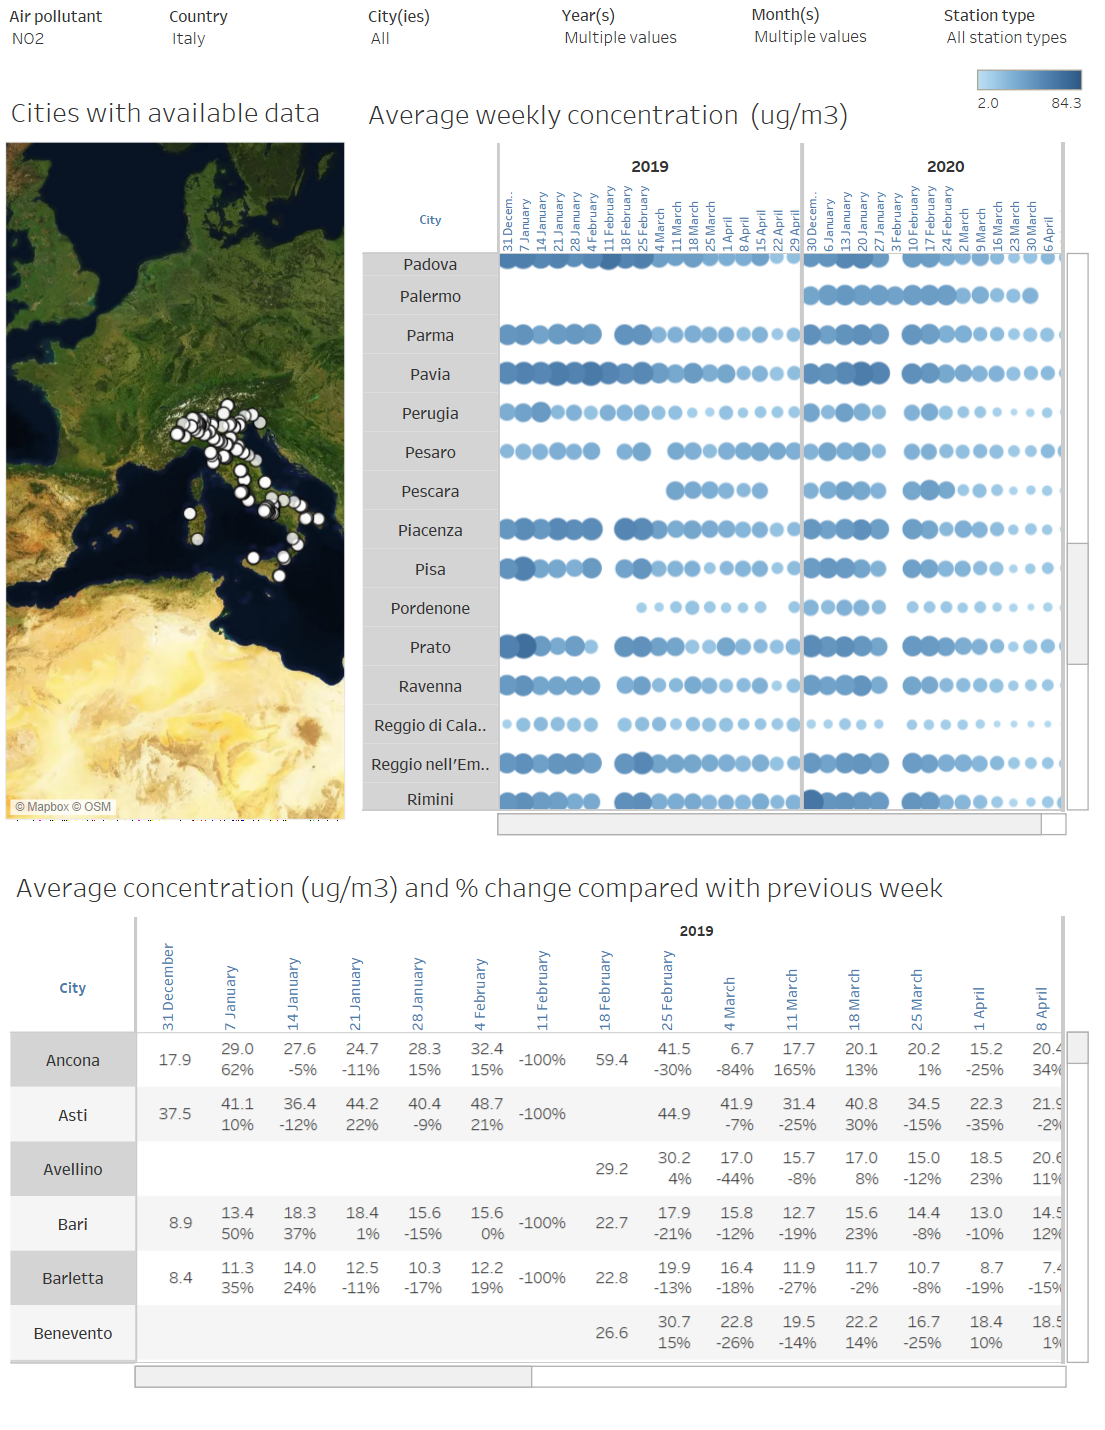
Air quality monitoring and COVID-19
The lockdown and related measures implemented by many European countries to stop the spread of COVID-19 have led to a sudden decrease in economic activities, including a drop in road transport in many cities. To assess how this has affected concentrations of air pollution, the European Environment Agency has developed a viewer that tracks the weekly average concentrations of nitrogen dioxide (NO2) and particulate matter (PM10 and PM2.5). The European Environment Agency’s data is measured hourly, on the ground, at about 3.000 monitoring stations across European countries.
Air quality data can be downloaded through dedicated service and also viewed on the map in the visualisation based on up-to-date air quality data. The complete list of the air quality datasets is available on the EU Open Data Portal.
Webinar on air quality monitoring
Webinar about COVID-19 maps
See also expert advise on how to visualise data related to coronavirus.


