EU DataViz 2019
Serving citizens through better data visualisation
This was EU DataViz 2019
Photos of the conferenceAbout the conference
EU DataViz 2019 is an international conference organised by the Publications Office of the European Union.
It addresses for the first time the specific needs of the community engaged in data visualisation for the public sector in Europe, bringing together experts, practitioners and solution seekers.
Where
European Convention Center
Luxembourg
When
12 November 2019
News
EU DataViz 2019 – let’s democratise data!
Black holes, histograms, ethics and storytelling…what do they all have in common? They were all part of mind-blowing presentations that took place in the EU DataViz: the first conference in Europe on data visualisation for the public sector. The goal? ‘Serving citizens through better data visualisation’.
EU DataViz 2019, took place at the European Convention Center in Luxembourg on 12 November. Organised by the Publications Office of the European Union and supported by the ISA² programme of the European Commission, the event brought together more than 500 international experts, professionals and solution-seekers and addressed for the first time in Europe the specific needs of the public sector data visualisation community. Several DGs and services of the European Commission have been actively involved with presentations, keynote speeches and moderation of thematic sessions. Proving that data visualisation is a hot topic, EU Dataviz 2019 was sold-out quickly but if you missed it, do not worry: all presentations and recordings of the main sessions are published below on the conference website.
Why is data visualisation a ‘hot’ topic?
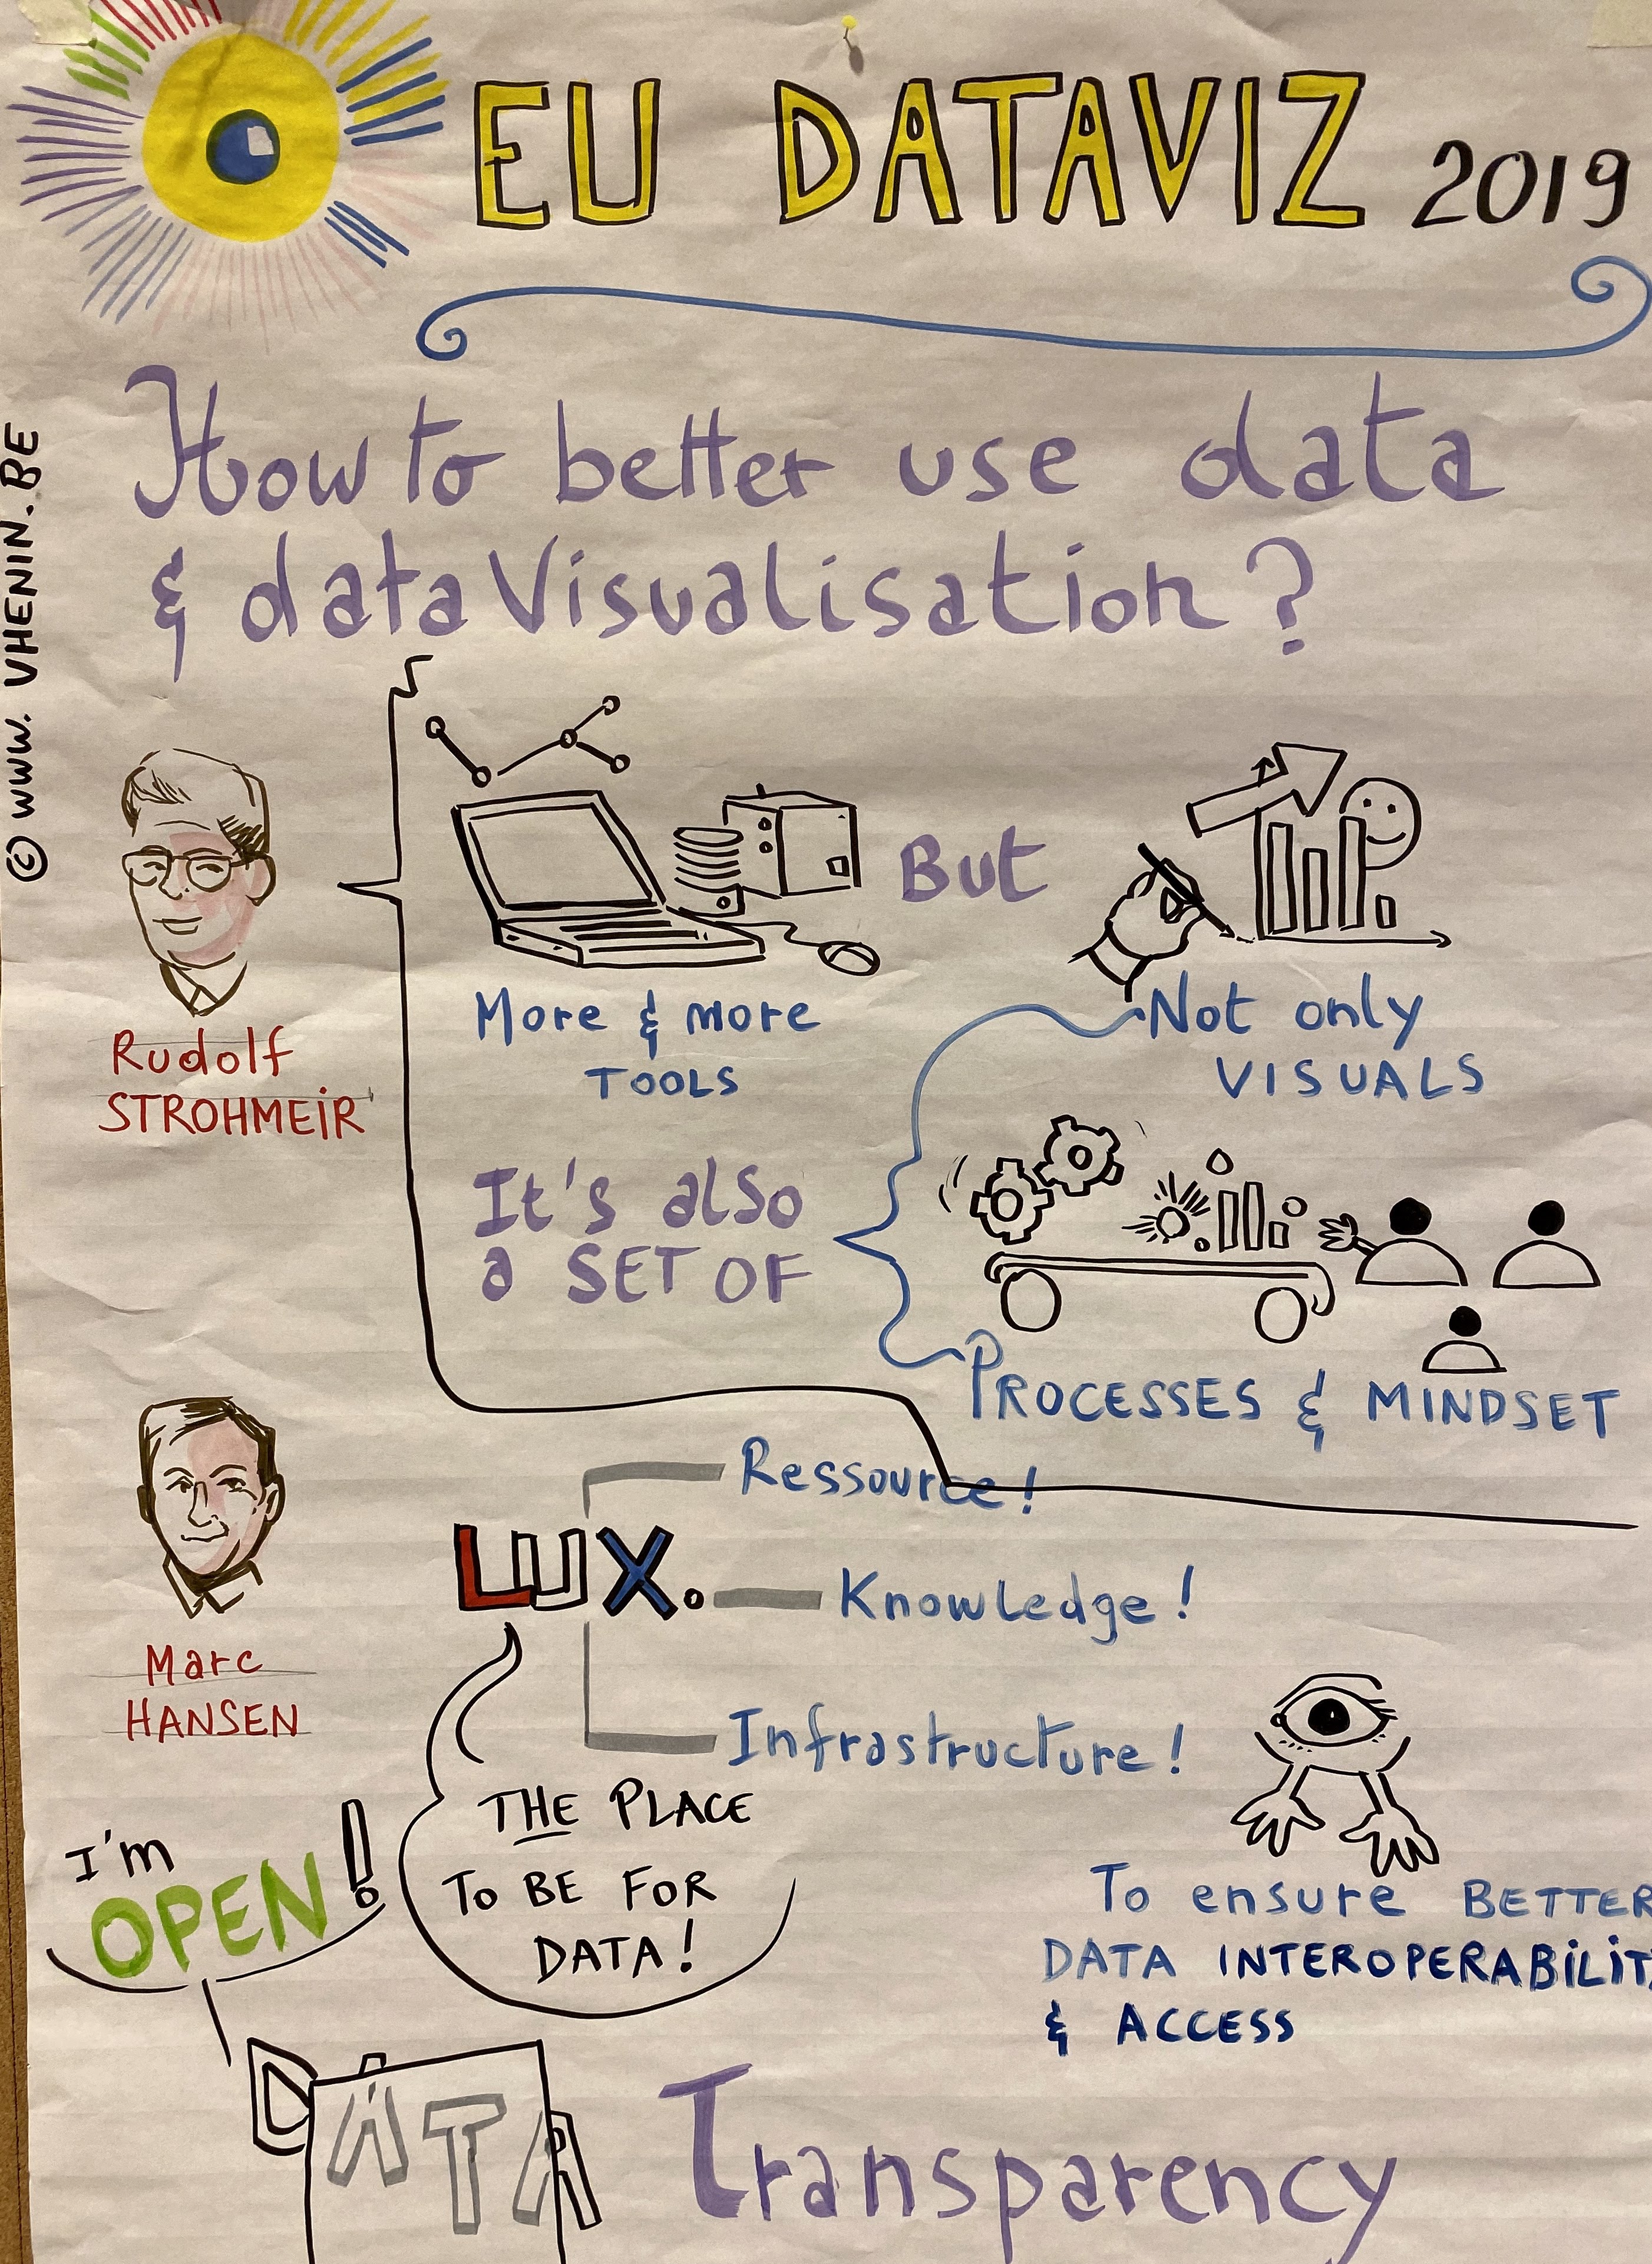
Half of the human brain is dedicated to processing things visually. Therefore, visualising information helps people to perceive and make sense of concepts and relationships in a complex modern world today. As a result, effective visualisations can contribute to a significantly better understanding of data as well as policies. They can achieve a considerably higher impact on policy-makers and citizens and contribute to considerably higher political support. During the event, high-level international experts referred to data visualisation as “a great way to democratise data” and “a game changer”. It is especially relevant to the public sector producing and publishing for reuse huge amounts of data, as the Director-General of the Publications Office Rudolf Strohmeier said in his speech. He continued: “however, data visualisation sounds like an output, like data in a visual form, when in fact the most defining aspects are actually its process and mind-set”. In a few words, visualisation is a communication method that can help your messages be more understandable, credible, memorable, and convincing in a world flooded with information. And as data artist Kirell Benzi added in his speech “combine facts with emotion, and people will better retain the information”.
The EU DataViz experience
In a nutshell the conference addressed exactly this need: to understand how to translate complex issues and knowledge into digestible and relevant language that resonates with EU citizens and policy makers. Additionally, it helps to explore and analyse data to develop better policies.
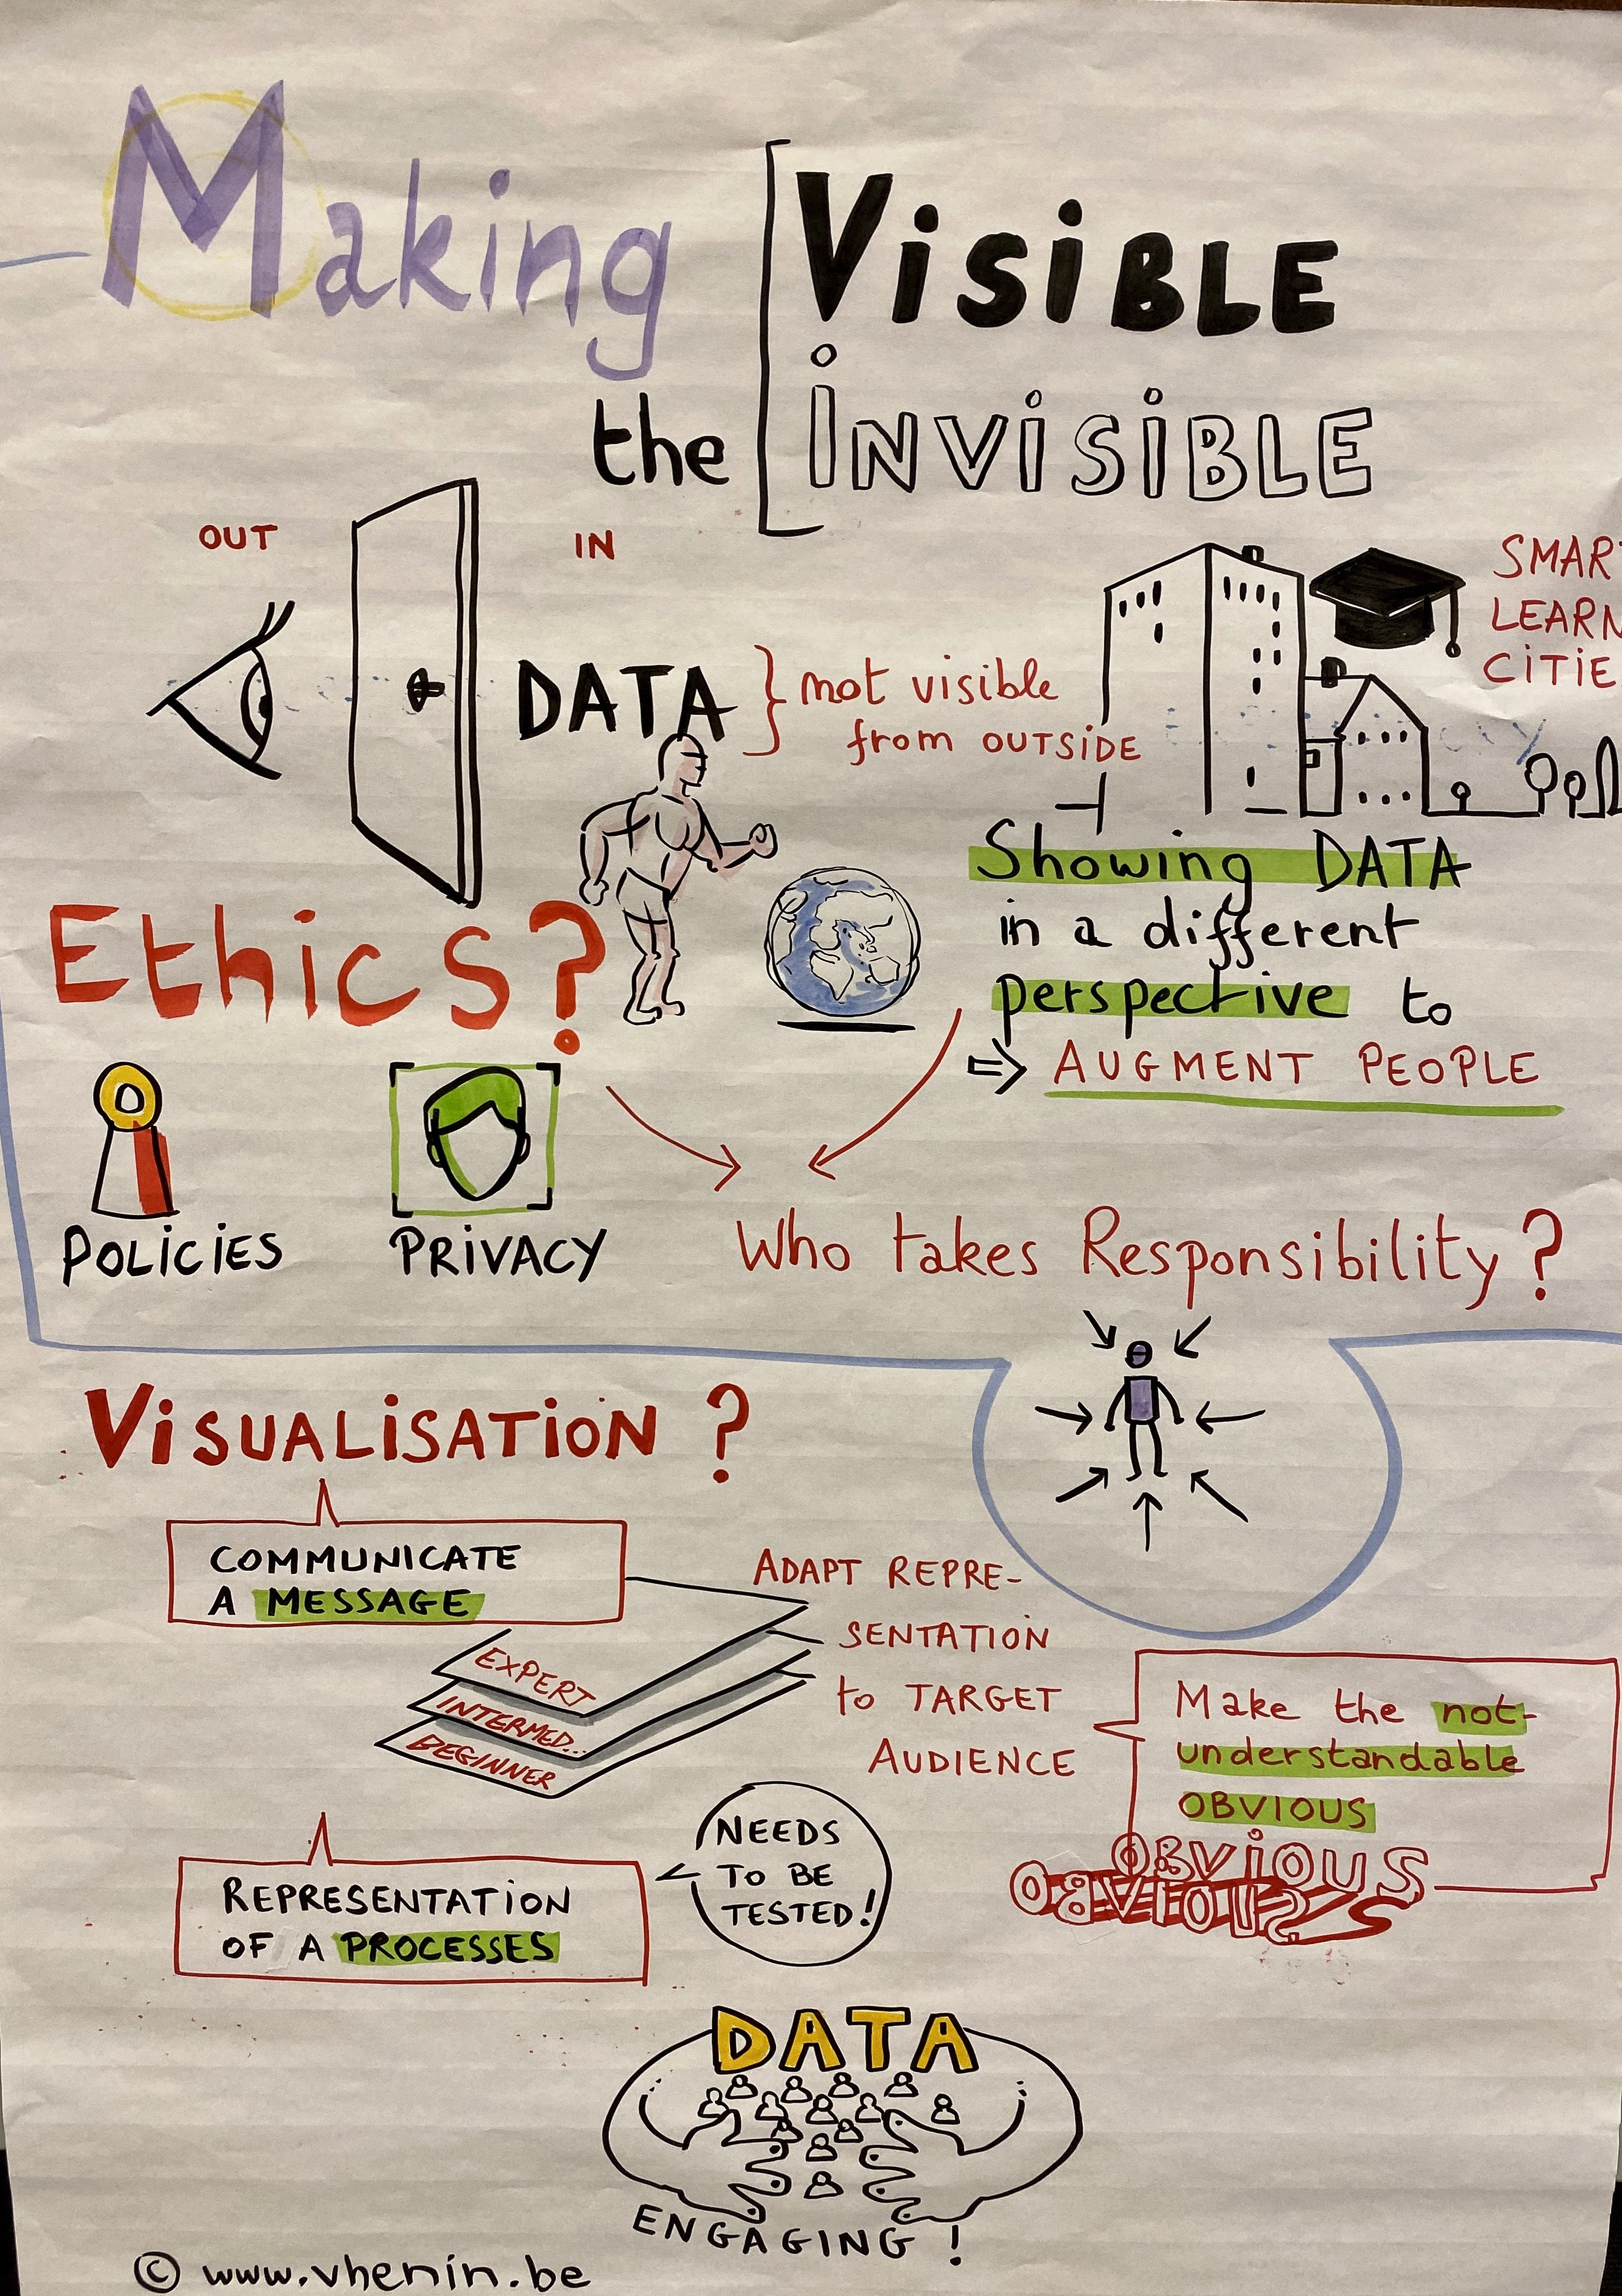
Participants had the chance to hear from CERN scientists how they visualise the cosmos, from the tiniest scales to the massive black holes. They had the chance to watch international experts from the World Bank, the Organisation for Economic Cooperation and Development (OECD), Harvard University and others sharing their best practices in topics ranging from data exploration and new ways to present reports to emerging technologies in the field. They also had the chance to watch an award-winning expert talking about ethics presenting funny examples of using visuals to misrepresent facts intentionally during political campaigns. The need for ethics was particularly highlighted since data visualisation is susceptible to misinterpretation and manipulation like any communication method.
Besides a learning experience, the event was a great networking opportunity, as Athanassios Stavrakoudis, EU DataViz participant and professor at the University of Ioannina (Greece) confirms: “What I particularly enjoyed was the networking opportunities this event offered. The event app that allowed us to book appointments with other participants was great”.
His colleague, Kyriaki Tsilika, assistant professor at the Department of Economics in the University of Thessaly further describes what she gained from her participation in the EU DataViz: “I teach and apply data visualisation techniques in my courses in the University. However, it is not easy to benchmark and keep track of the progress of the fragmented international community when you are confined in your national boundaries, even if you are in a Member State that is a bigger player than Greece. It is at the EU level that you can keep good track of it. This is why such an event was really missing, until now. And I need to add that I particularly enjoyed the diversity of speakers in this event that included not only the public sector and the academia but also, importantly, the private sector”.
The event closed with the president and co-founder of The Lisbon Council, Paul Hofheinz, reminding all that data visualisation used in a responsible way is a powerful tool to help address social challenges of today and inviting participants to share their data with the world. The world can take advantage of it in ways we cannot imagine in advance since collective intelligence is far more powerful than intelligence of one person or a group of people.
“In the end it’s not about sharing data, it’s about sharing knowledge. Go forth and multiply” he concluded in front of an applauding crowd.
Contributors


Valentina Alberti
Joint Research Centre
(EU)


Ariane Aumaitre
European University
Institute of Florence

Juan Arevalo Torres
Randbee consultants
(Spain)


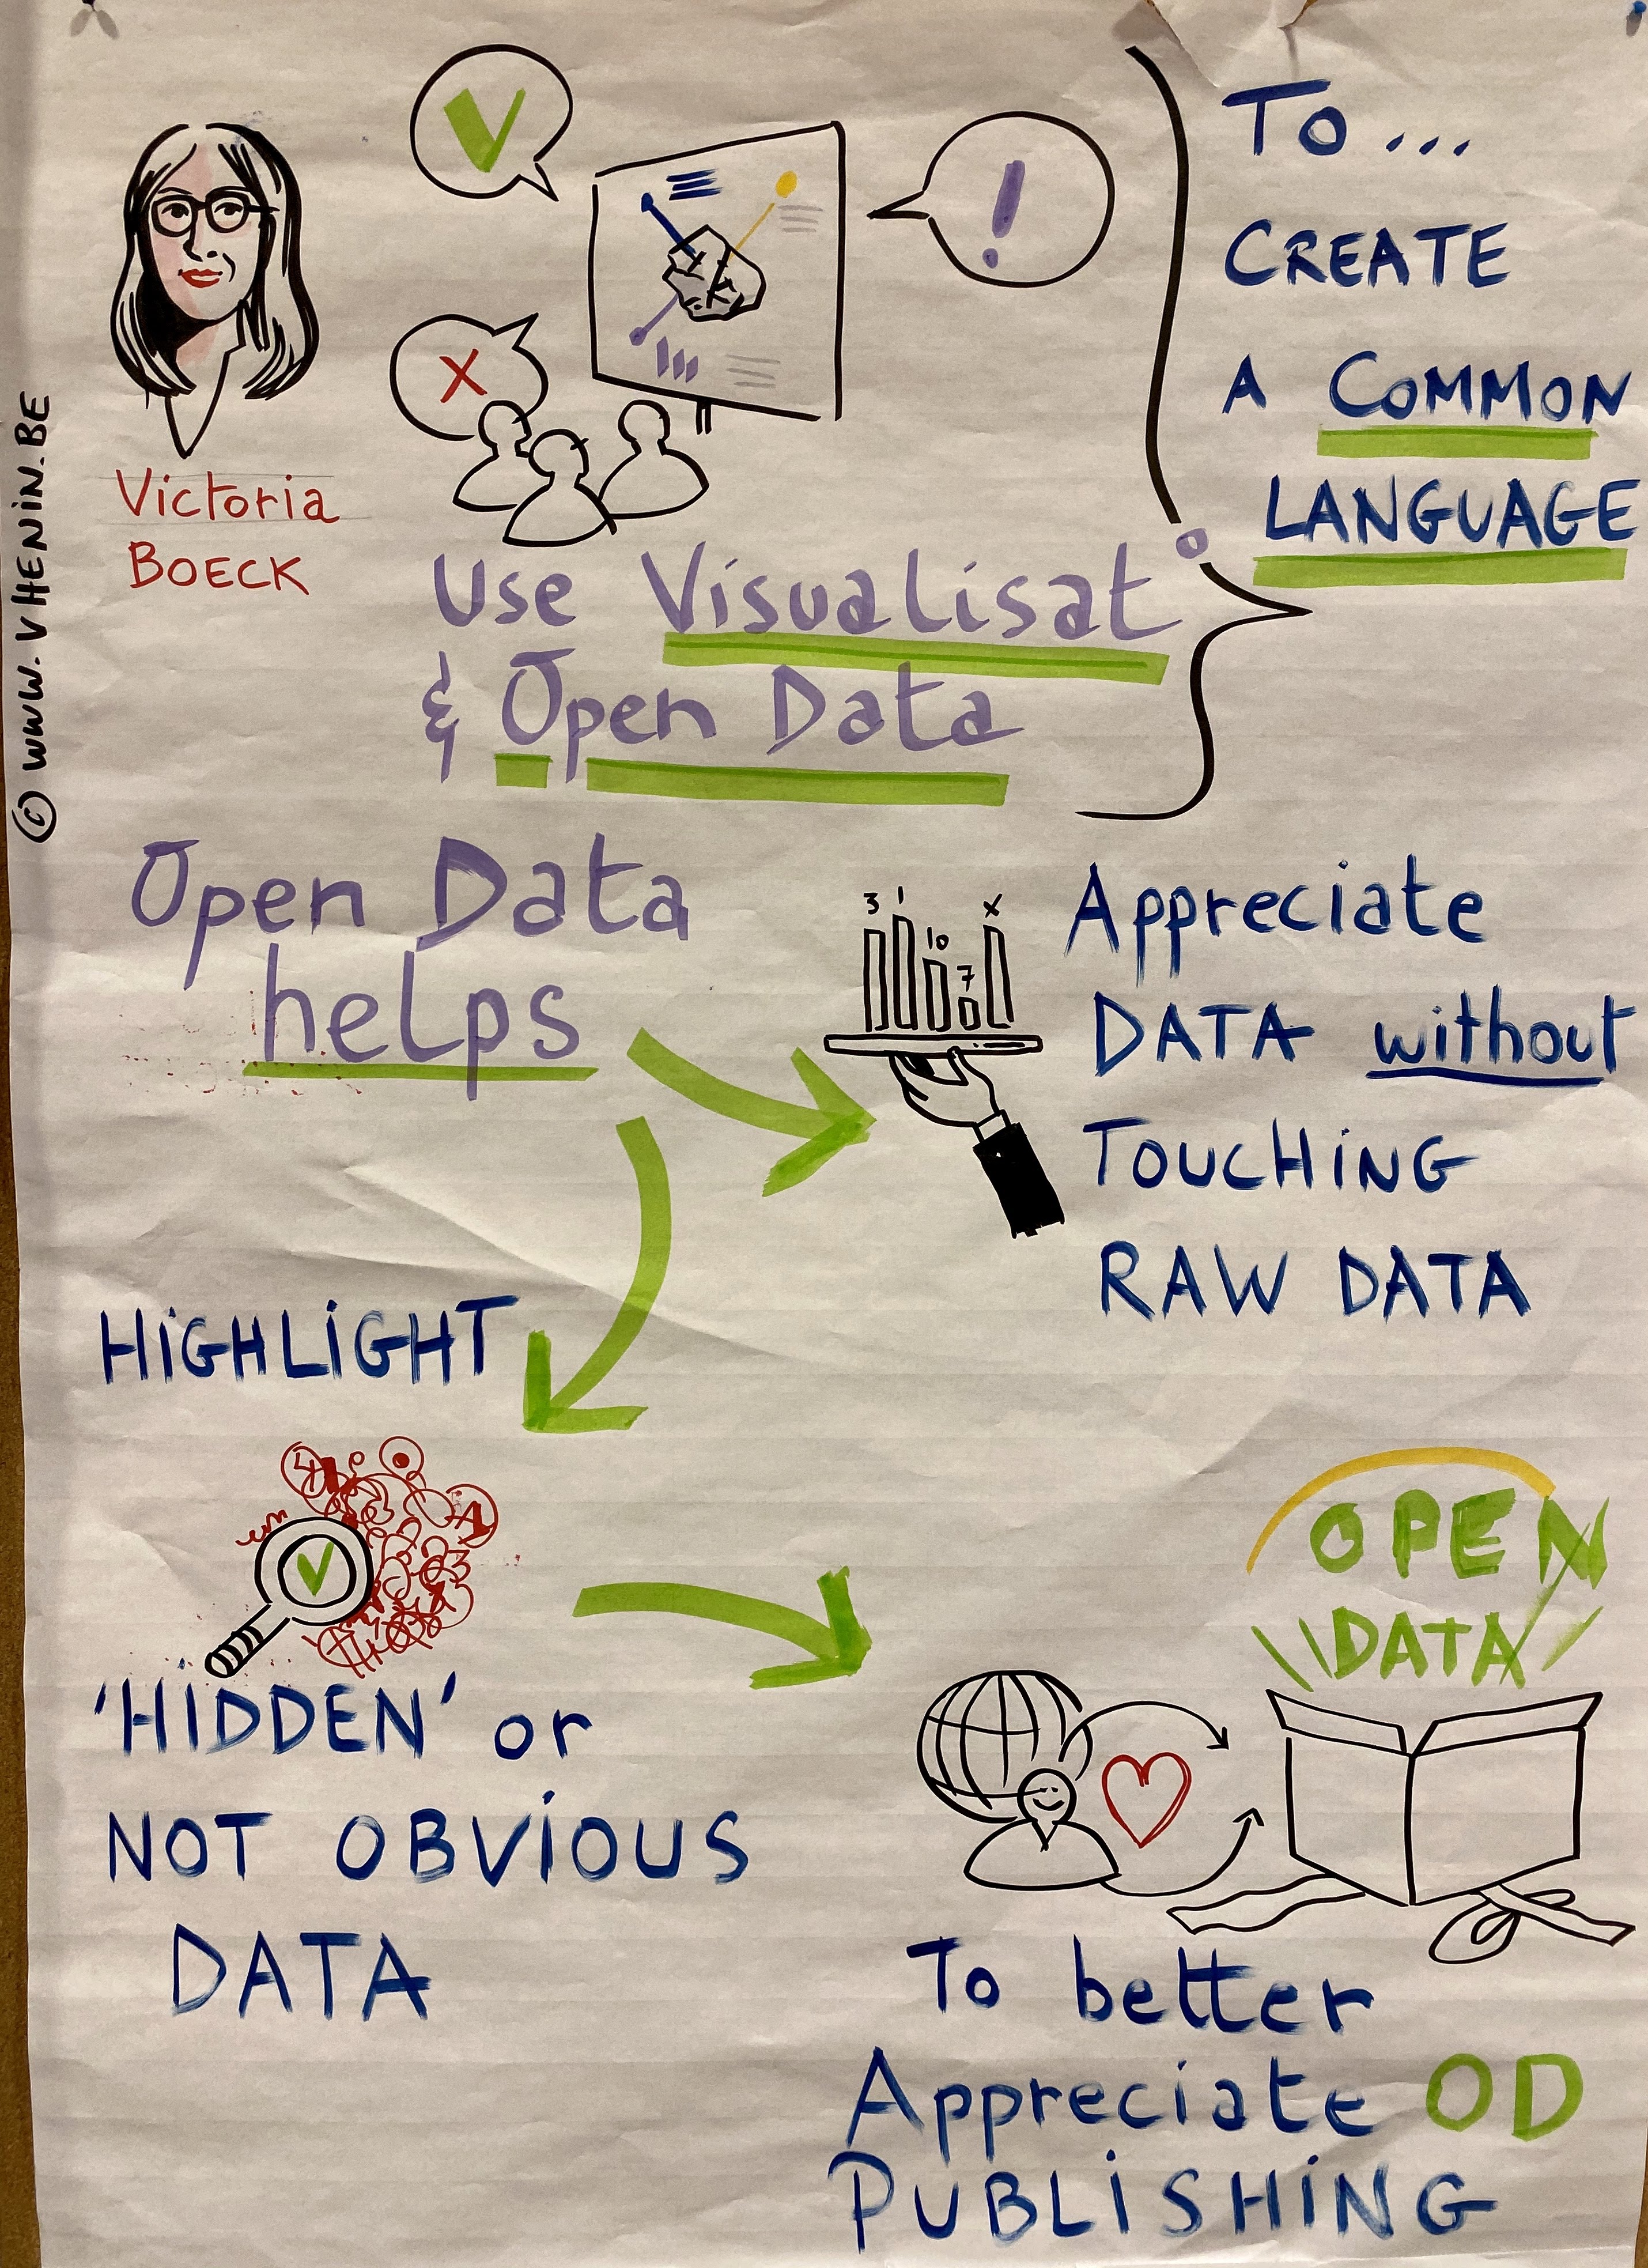
Victoria Boeck
Technologiestiftung Berlin
(Germany)

Matteo Bonera
The Visual Agency
(Italy)


Louis de Charsonville
European Central Bank
(EU)

Annamaria Donnarumma
SIRIS Academic
(Spain)

Edwin de Jonge
Statistics Netherlands
(The Netherlands)


Federica Fragapane
Information designer
(Italy)


Caroline Goulard
Dataveyes
(France)


Marc Hansen
Government of the Grand
Duchy of Luxembourg


Rudolf Strohmeier
Publications Office
(EU)


Xaquín Veira González
Xaquín G.V.
(Spain)


Benjamin Wiederkehr
Interactive Things
(Switzerland)


Programme
The full programme including speakers, stands and posters is available here
| 9.00 | Registration and coffee | |||||
| 9.30 |
|
|||||
Opening speech
|
||||||
Keynote address
|
||||||
Open data and data visualisation: building the virtuous cycle
|
||||||
 Visualisation for knowledge communication: a holistic approach
|
||||||
Honest visuals: ethics in data visualisation
|
||||||
| 11.00 | Coffee break and exhibition and poster session | |||||
| 11.45-13.00 |
|
|||||
|
|
|
|
|
|
||
| Communicating complex economic topics for policymakers Annie White and Nil Tuzcu — Harvard’s Growth Lab |
Building digital dashboards for fully personalised data experience Annika Brauer — Statistics Estonia |
Exploratory visualisation and interactive analysis of big geospatial data Pierre Soille — Joint Research Centre of the European Commission |
Making it easier for citizens to use, adapt and build upon data visualisations: lessons learned by EDJNet Lorenzo Ferrari — European Data Journalism Network |
Applications to publish graphics in newsrooms Rafael Höhr — Prodigioso Volcan |
||
| Visualising ethical frameworks and policy documents in digital spaces Joanna Sleigh and Manuel Schneider — ETH Zürich, Swiss Federal Institute of Technology Zürich |
Visualisation of experimental statistical data from administrative registers in Poland Dr Wiesława Gierańczyk and Dr Leszek Kozlowski — Statistics Poland |
The European Data Portal and the visualisation of geoinformation and real-time data Antje Kügeler — Conterra, Simon Jirka — 52north, and Eline Lincklaen Arriëns — Capgemini Invent |
Using data visualisation to communicate statistics — Experiences from the United Kingdom Martin Ralphs — Office for National Statistics |
Interactive data visualisation using Shiny apps Ariane Aumaitre — European University Institute in Florence |
||
| European Union elections: the case for a harmonised treatment of European election data Arnold Platon — Data visualisation freelancer |
Using visualisation to monitor and explore European market infrastructure regulation data on derivatives Louis de Charsonville — European Central Bank |
Meaningful maps Michael Neutze, Expert at the Destatis — Federal Statistical Office of Germany |
Experience Leonardo da Vinci’s Codex Atlanticus — A new approach in digital humanities Matteo Bonera — The Visual Agency |
Data visualisation technology to improve data access and dissemination Roberto Barcellan — European Commission’s Directorate-General for Informatics and Yasmin Schinasi — European Commission's Directorate-General for Maritime Affairs and Fisheries |
||
| European and international trade: summary for cabinet briefings Lorenzo Isella — European Commission's Directorate-General for Trade |
Six recipes for solving common operational challenges with data analytics Oliver Wise — Tyler Technologies |
Geovisualisation of spatial statistical data Anna Slawinska — Statistics Poland |
How do design students perceive statistics? Laima Grizaite — Statistics Lithuania |
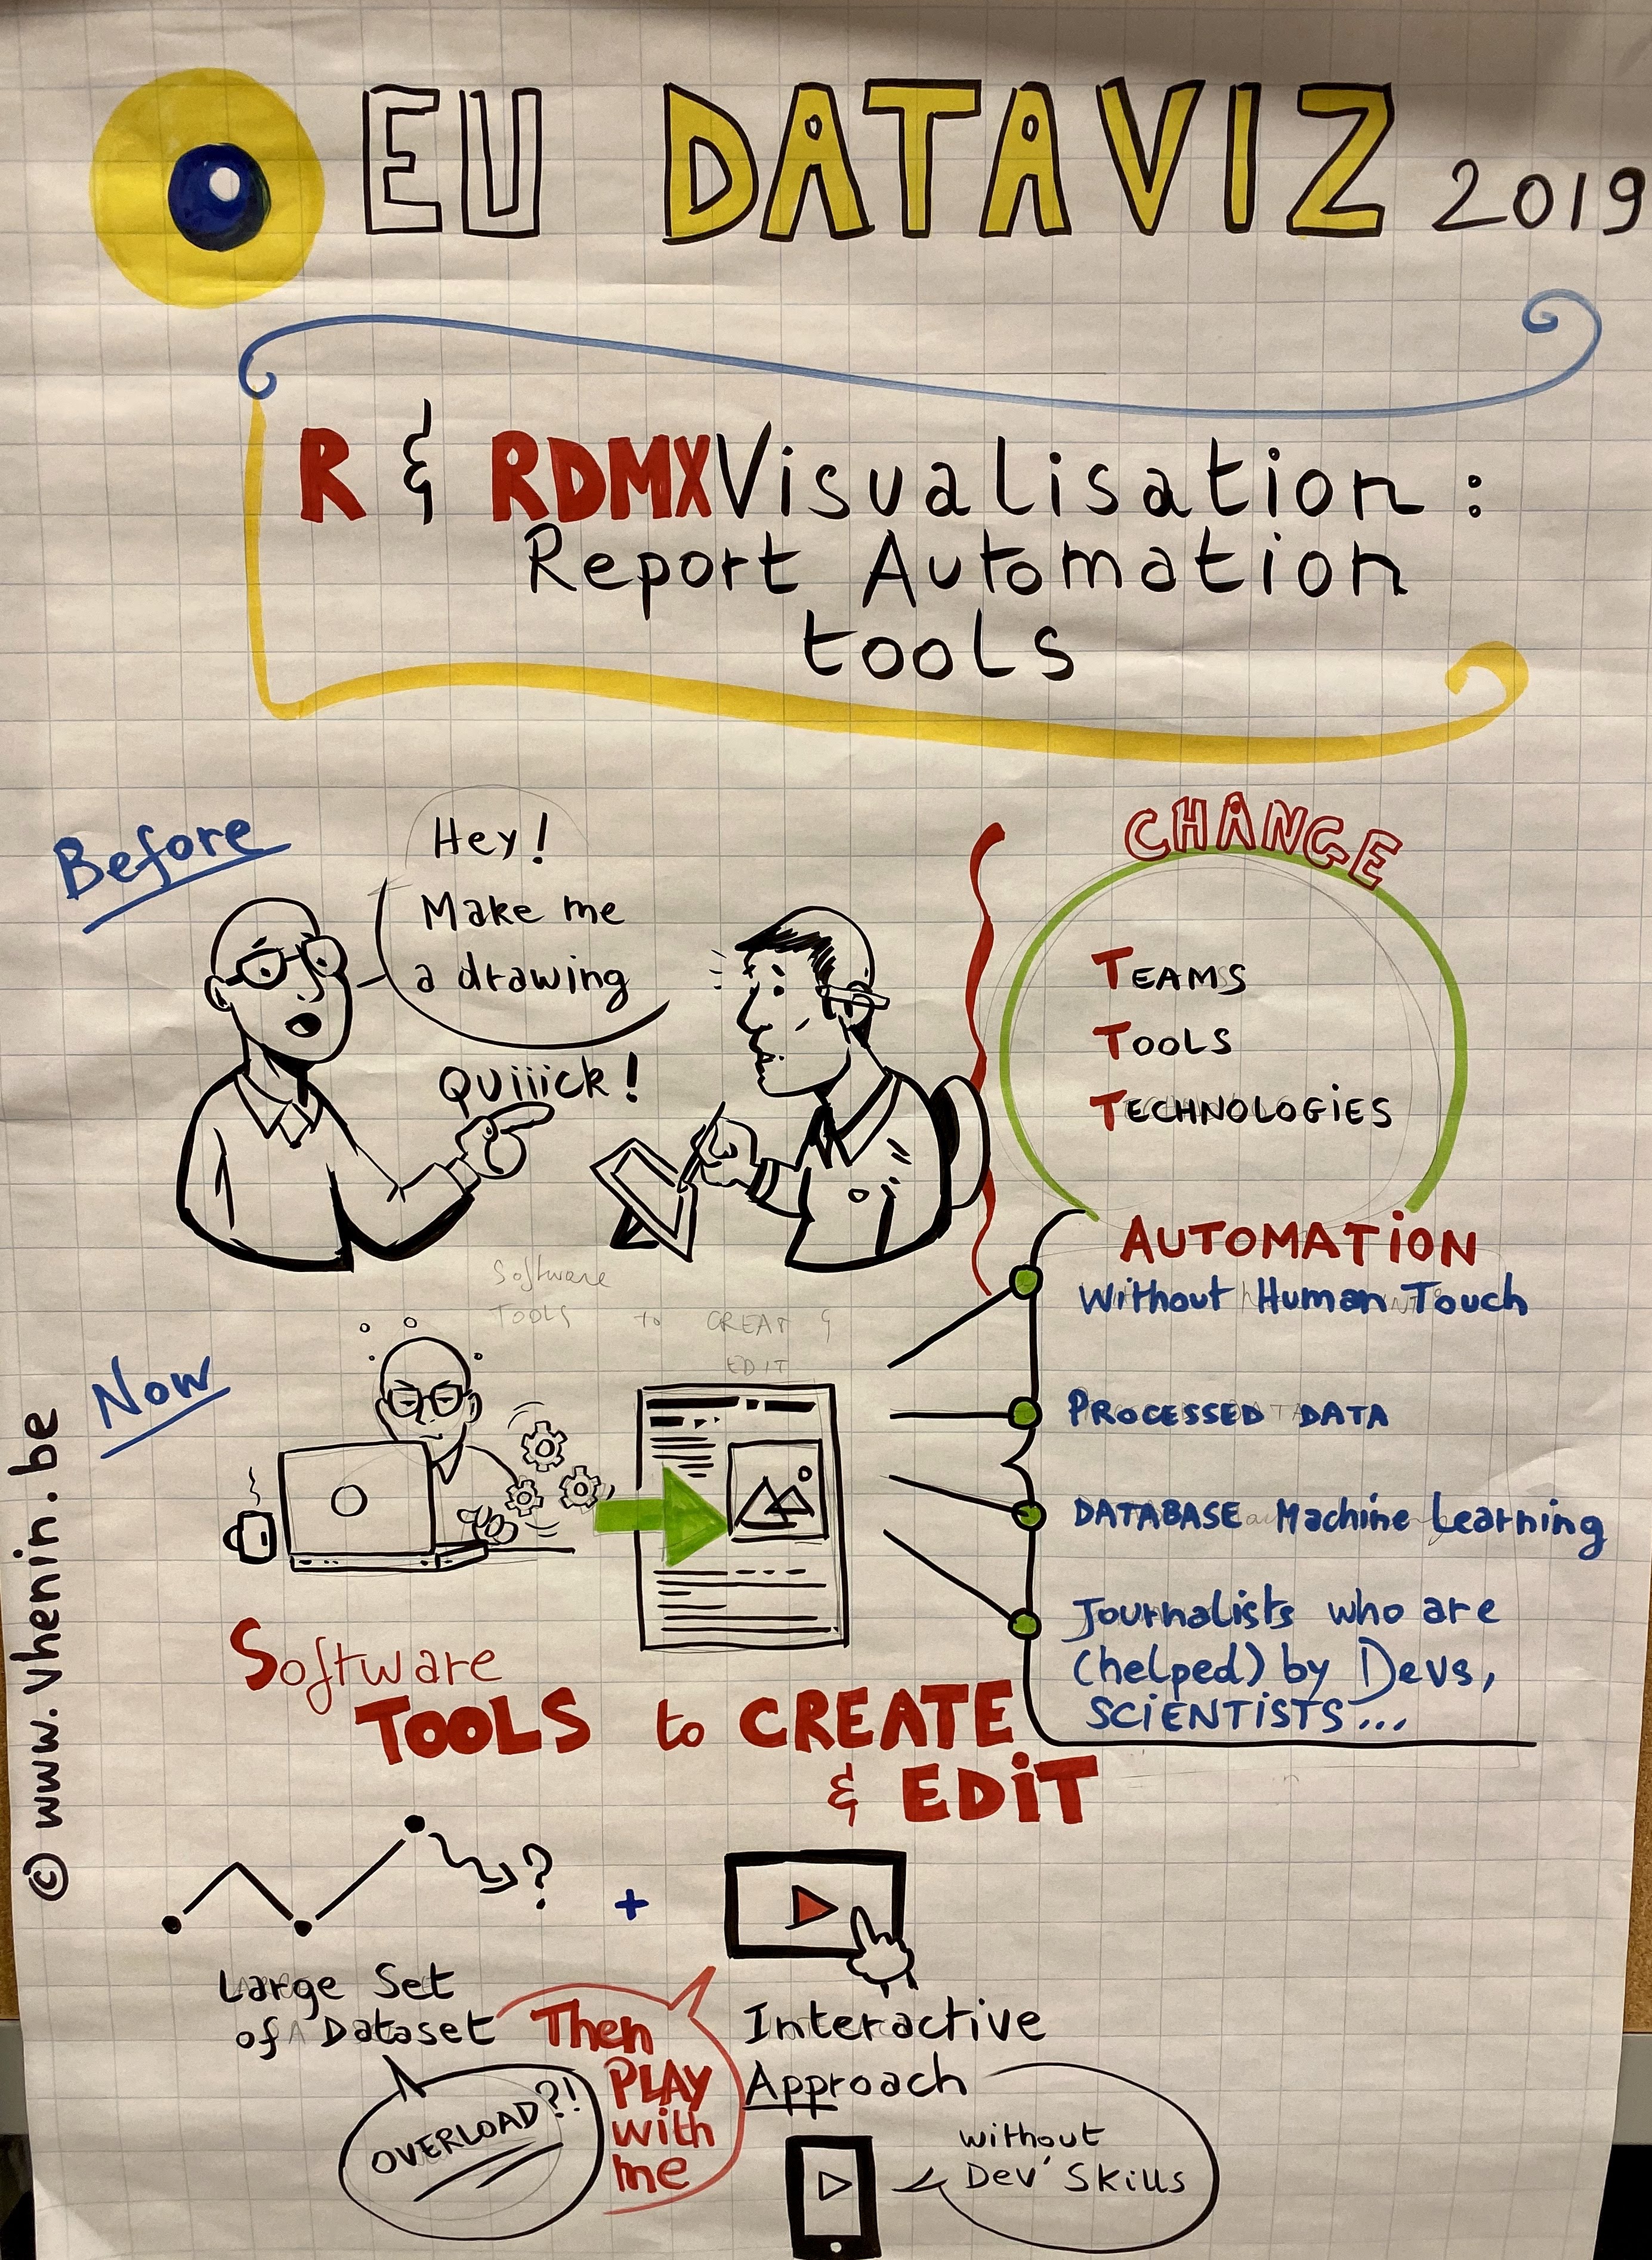
R and SDMX visualisation Athanasios Stavrakoudis — University of Ioannina |
||
| 13.00 | Lunch break and exhibition and poster session | |||||
| 14.00-15.15 |
|
|||||
|
|
|
|
|
|
||
| Open data, open code, open knowledge: visualising development data at the World Bank Tony Fujs — World Bank |
Visualisation aesthetics: a practical approach for better-looking charts Jovan Lekovic — The Synthesis Bureau |
Sharing vision through cutting-edge visualisation in Japan Kentaro Akahoshi — Cabinet Office of Japan |
Data storytelling for public administrations Matteo Moretti — Sheldon.studio |
Visualisation and machine learning: the right mix to reach trustworthy artificial intelligence? Benoît Otjacques — Luxembourg Institute of Science and Technology |
||
| Beyond the PDF — Creating reports that are relevant to your audience Adina Renner — Aalto University, Helsinki |
Using data art for science communication Kirell Benzi — ekino |
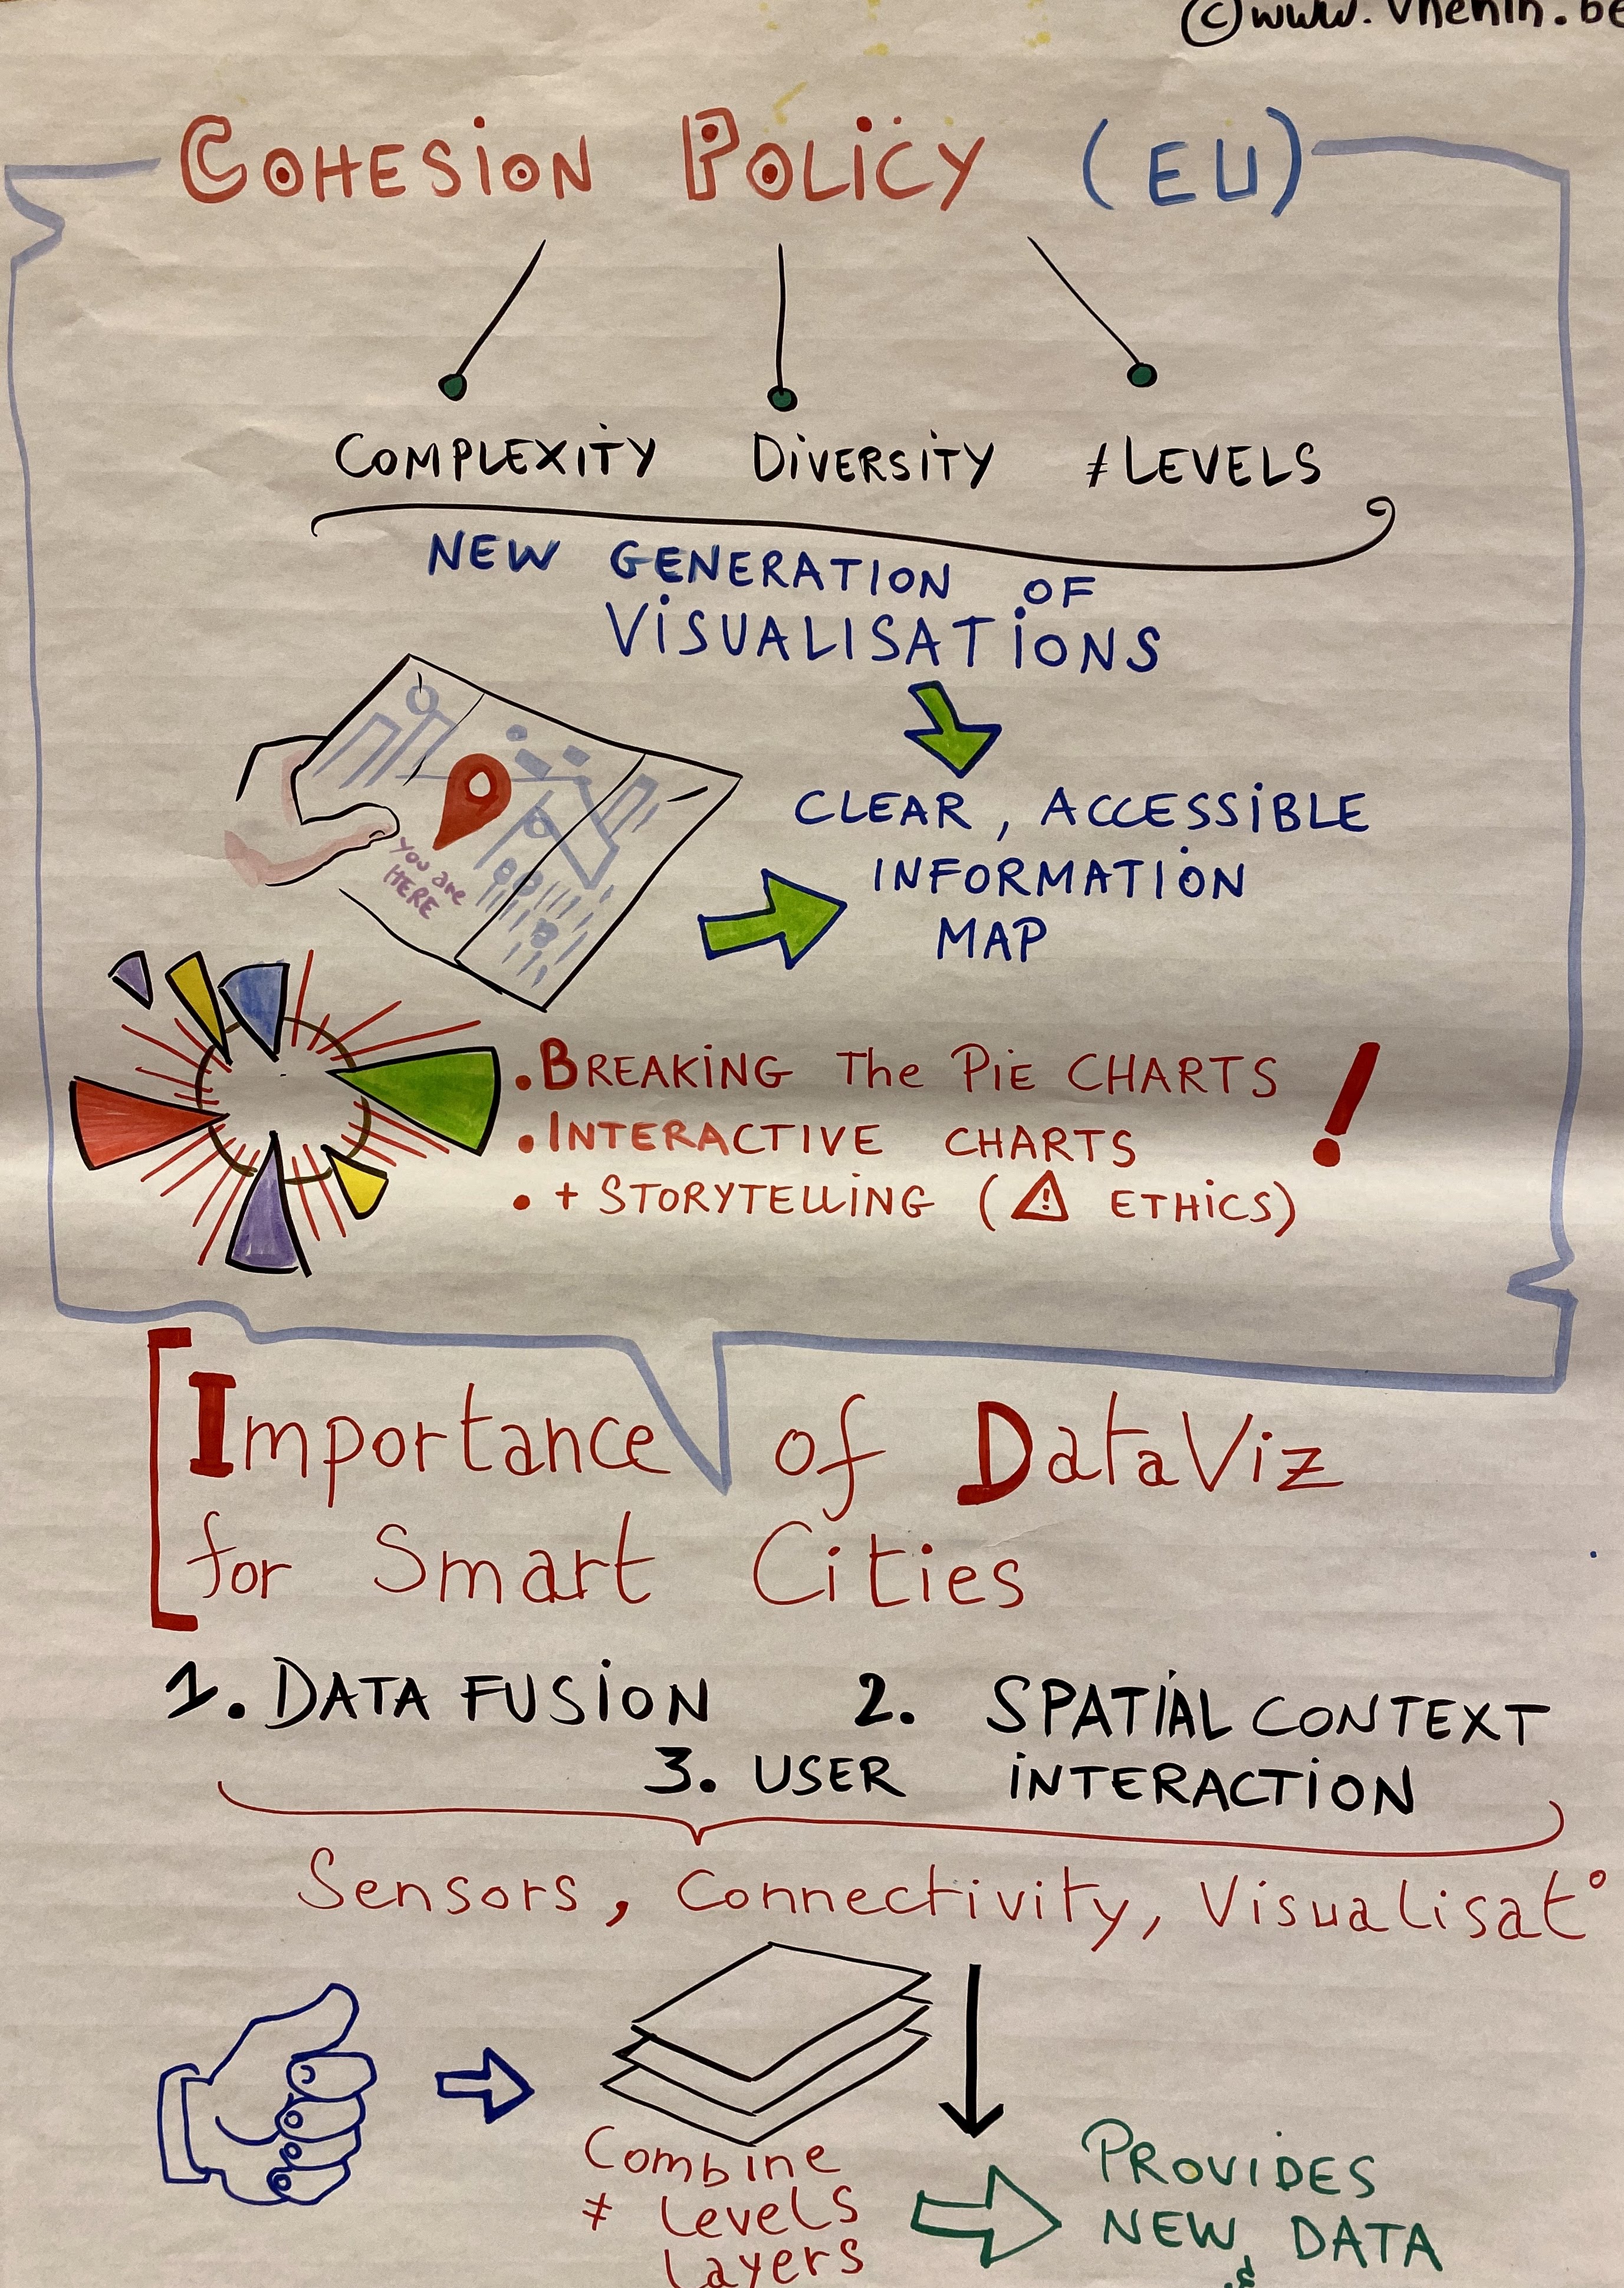
CityVis: urban data visualisation Sebastian Meier and Victoria Boeck — Technologiestiftung Berlin |
Explore, visualise and tell: journalistic secrets to crafting a precise story with data Hassel Fallas — University of Guadalajara |
Data visualisation tools at the European Environment Agency Dr Fernanda Néry and Sébastien Petit — European Environment Agency |
||
| Discover how visual analytics helps the European Investment Fund deliver insights into public funding Steve Albrecht — The Information Lab |
Visual narratives to connect: data visualisation for and with people Federica Fragapane — Information designer |
The power of flying flags: visualisations for transparent EU structural investments John Walsh — European Commission’s Directorate-General for Regional and Urban Policy |
What do Brazilian voters search for in presidency candidates? Carol Cavaleiro — O Globo newspaper |
Accessibility in data visualisation Davide Vernassa — Knowage |
||
| How an annual report became an innovative magazine with infographics and visualised data Suzan Fiack — German Federal Institute for Risk Assessment |
Best practices in information design Birger Morgenstjerne and Jeppe Morgenstjerne — Ferdio |
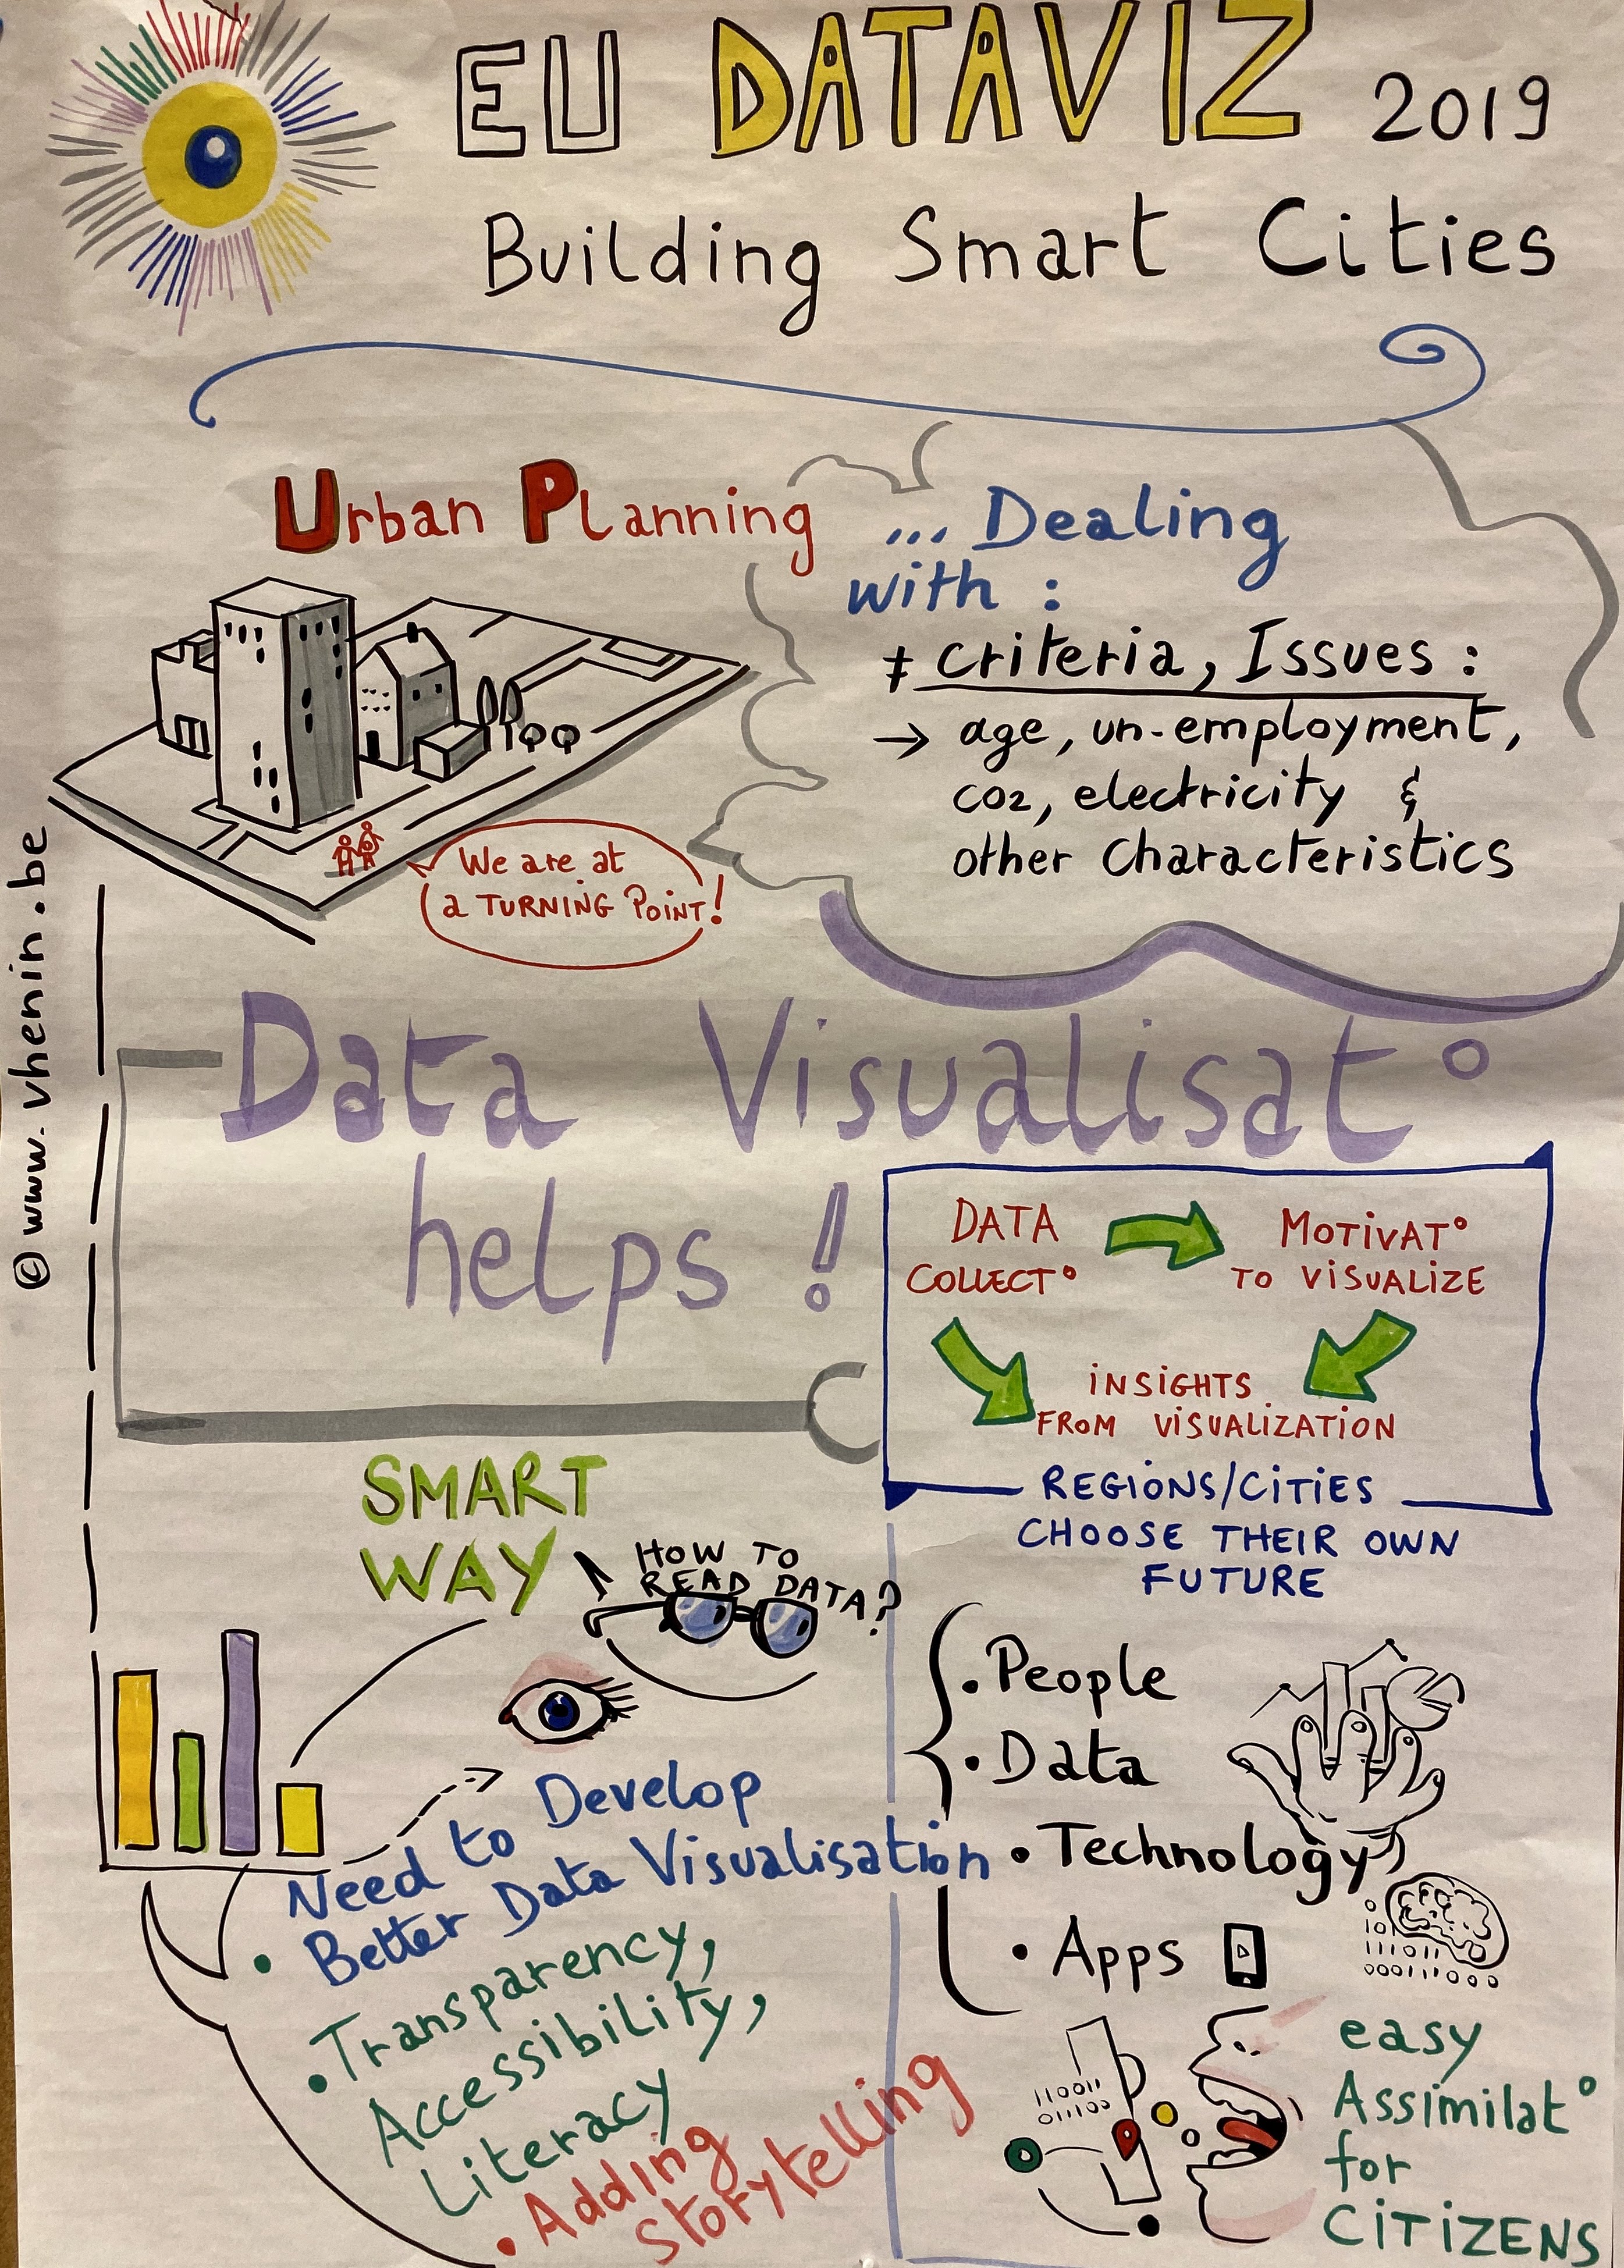
DataViz: an inescapable tool for the development of ‘smart cities’ Milan Kabáč and Mickaël Marchese — Kereon Intelligence |
To murder in Mexico: impunity guaranteed Yosune Chamizo Alberro — Animal Político |
Before and beyond data visualisation Anoop Variyan Kandiyil — PublicBI |
||
| 15.15 | Coffee break and exhibition and poster session | |||||
| 16.00 |
|
|||||
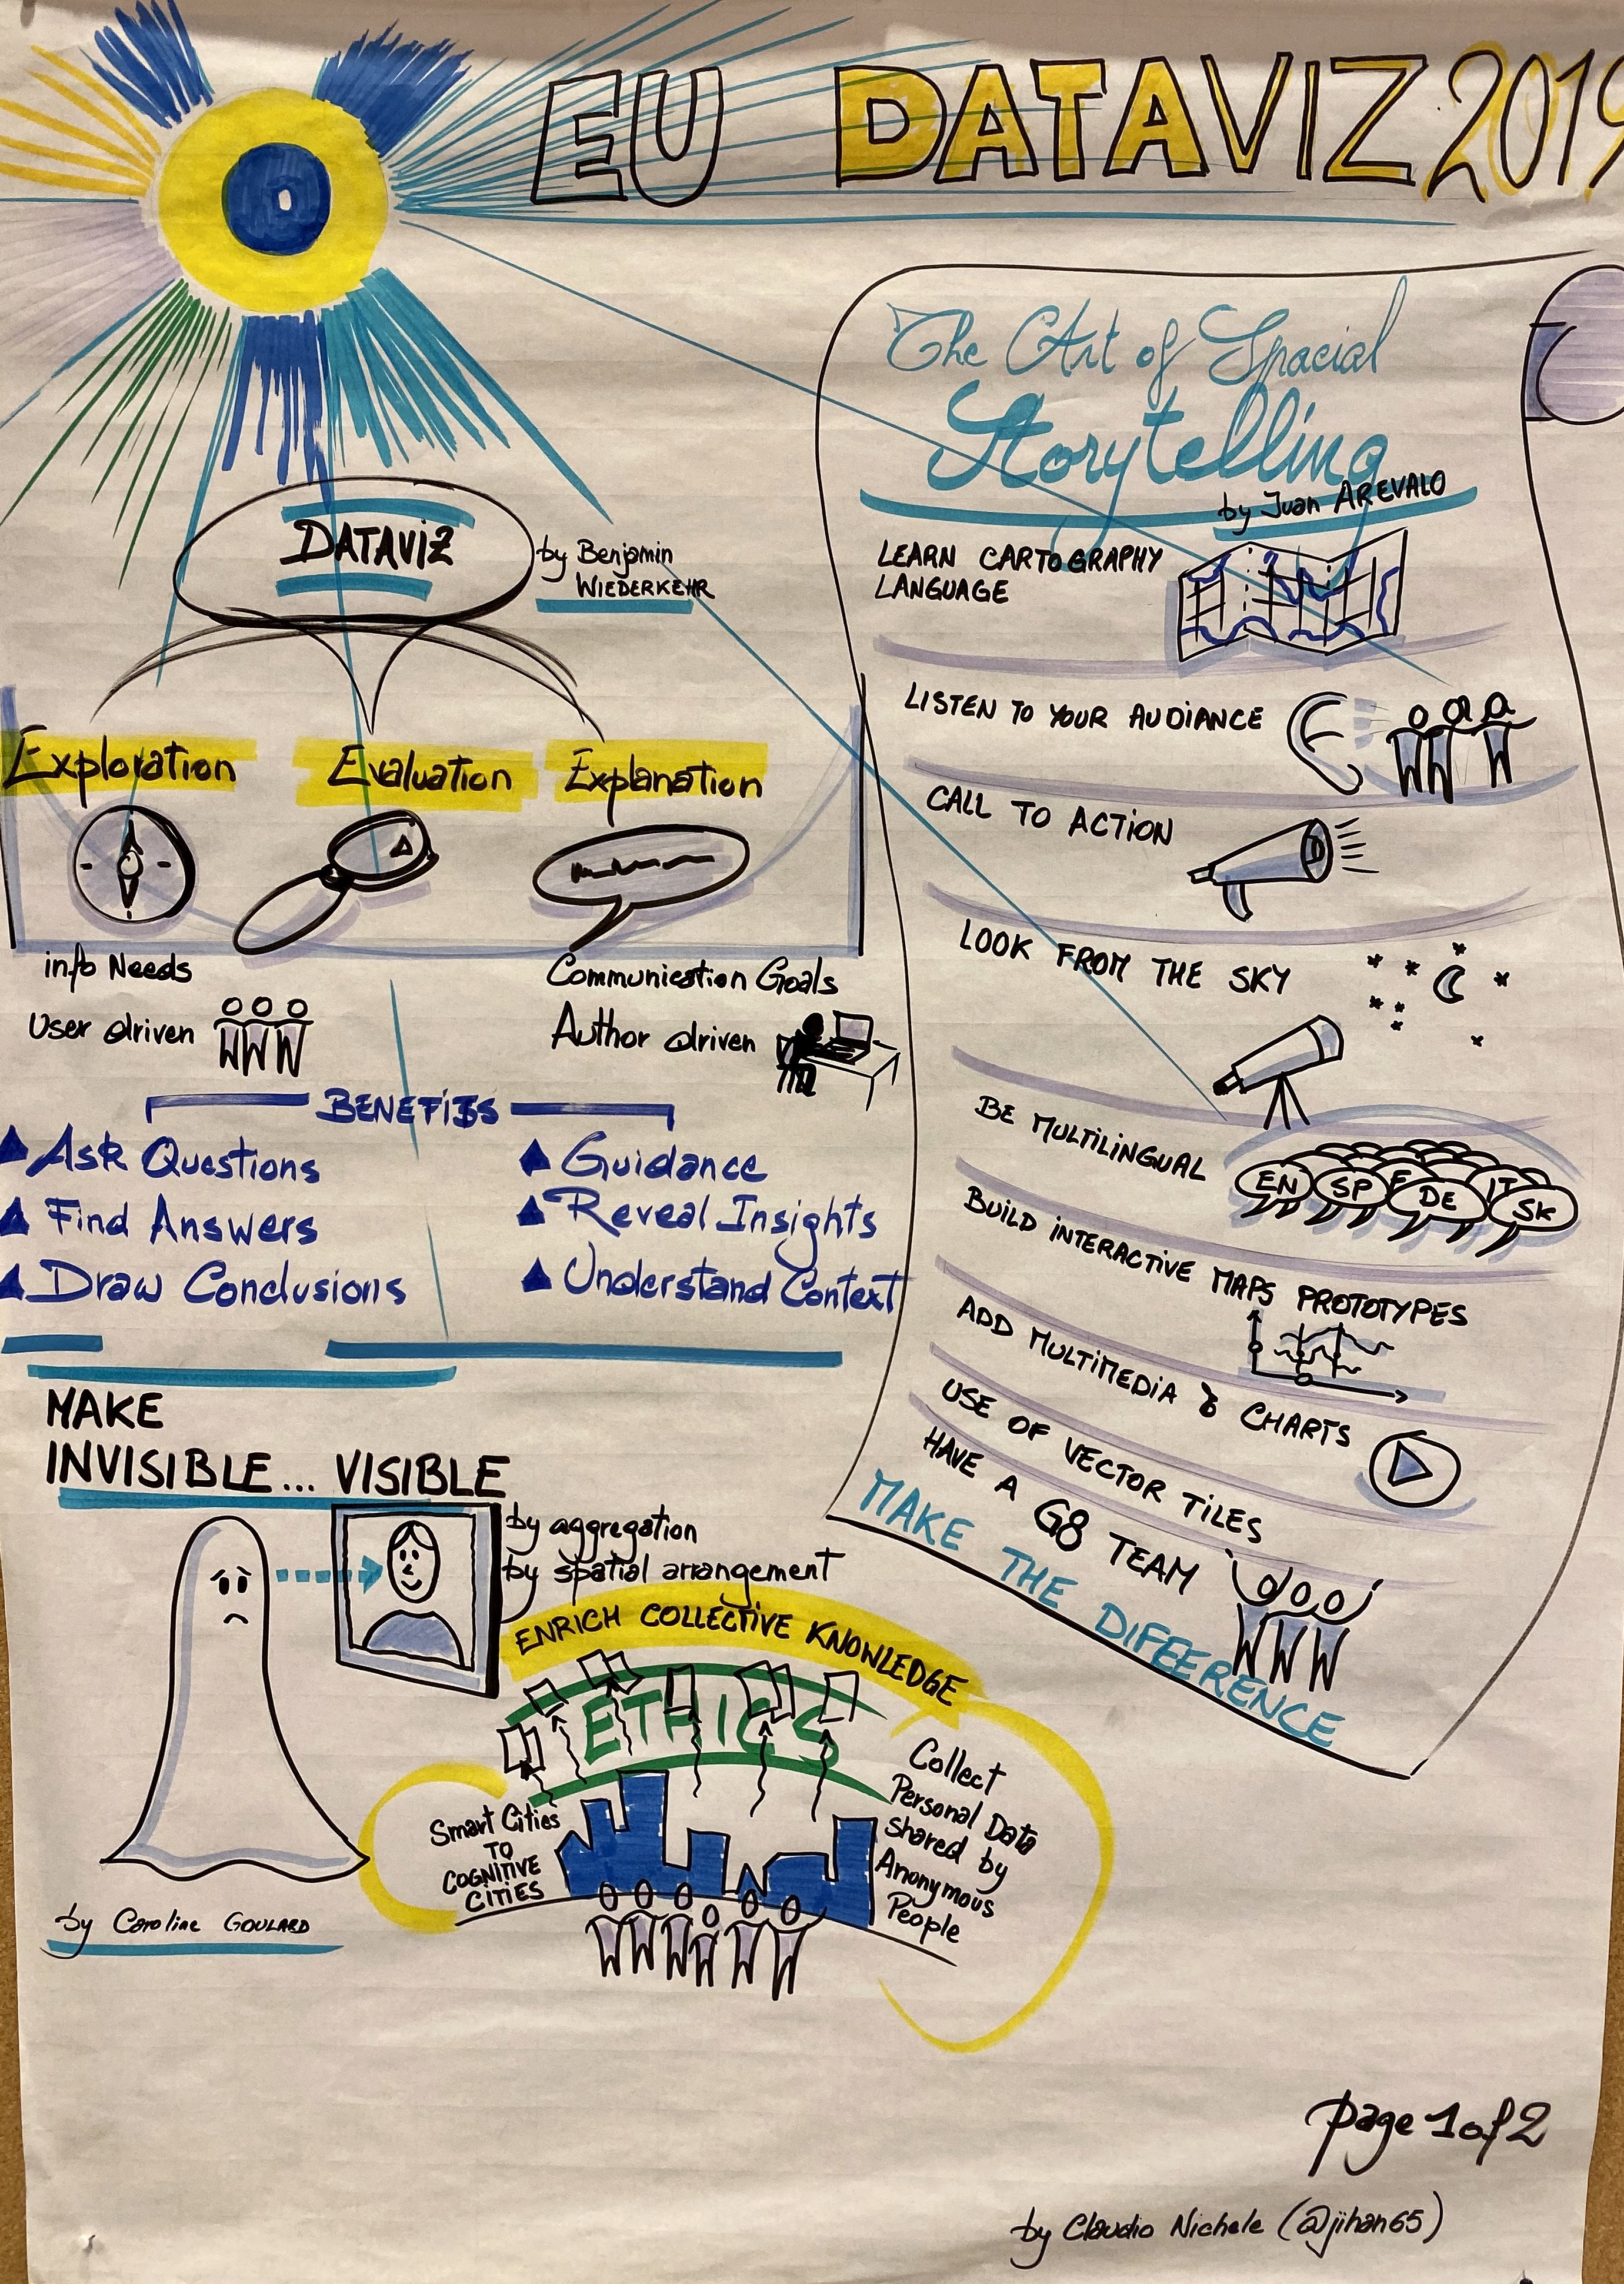
Visualising data for exploration and explanation — and everything in between
|
||||||
The art of spatial data storytelling
|
||||||
Making the invisible visible
|
||||||
 Visualising the cosmos: from the tiniest scales to the massive black holes
|
||||||
 Closing words
|
||||||
| 18.00 | Networking drinks | |||||
Partners


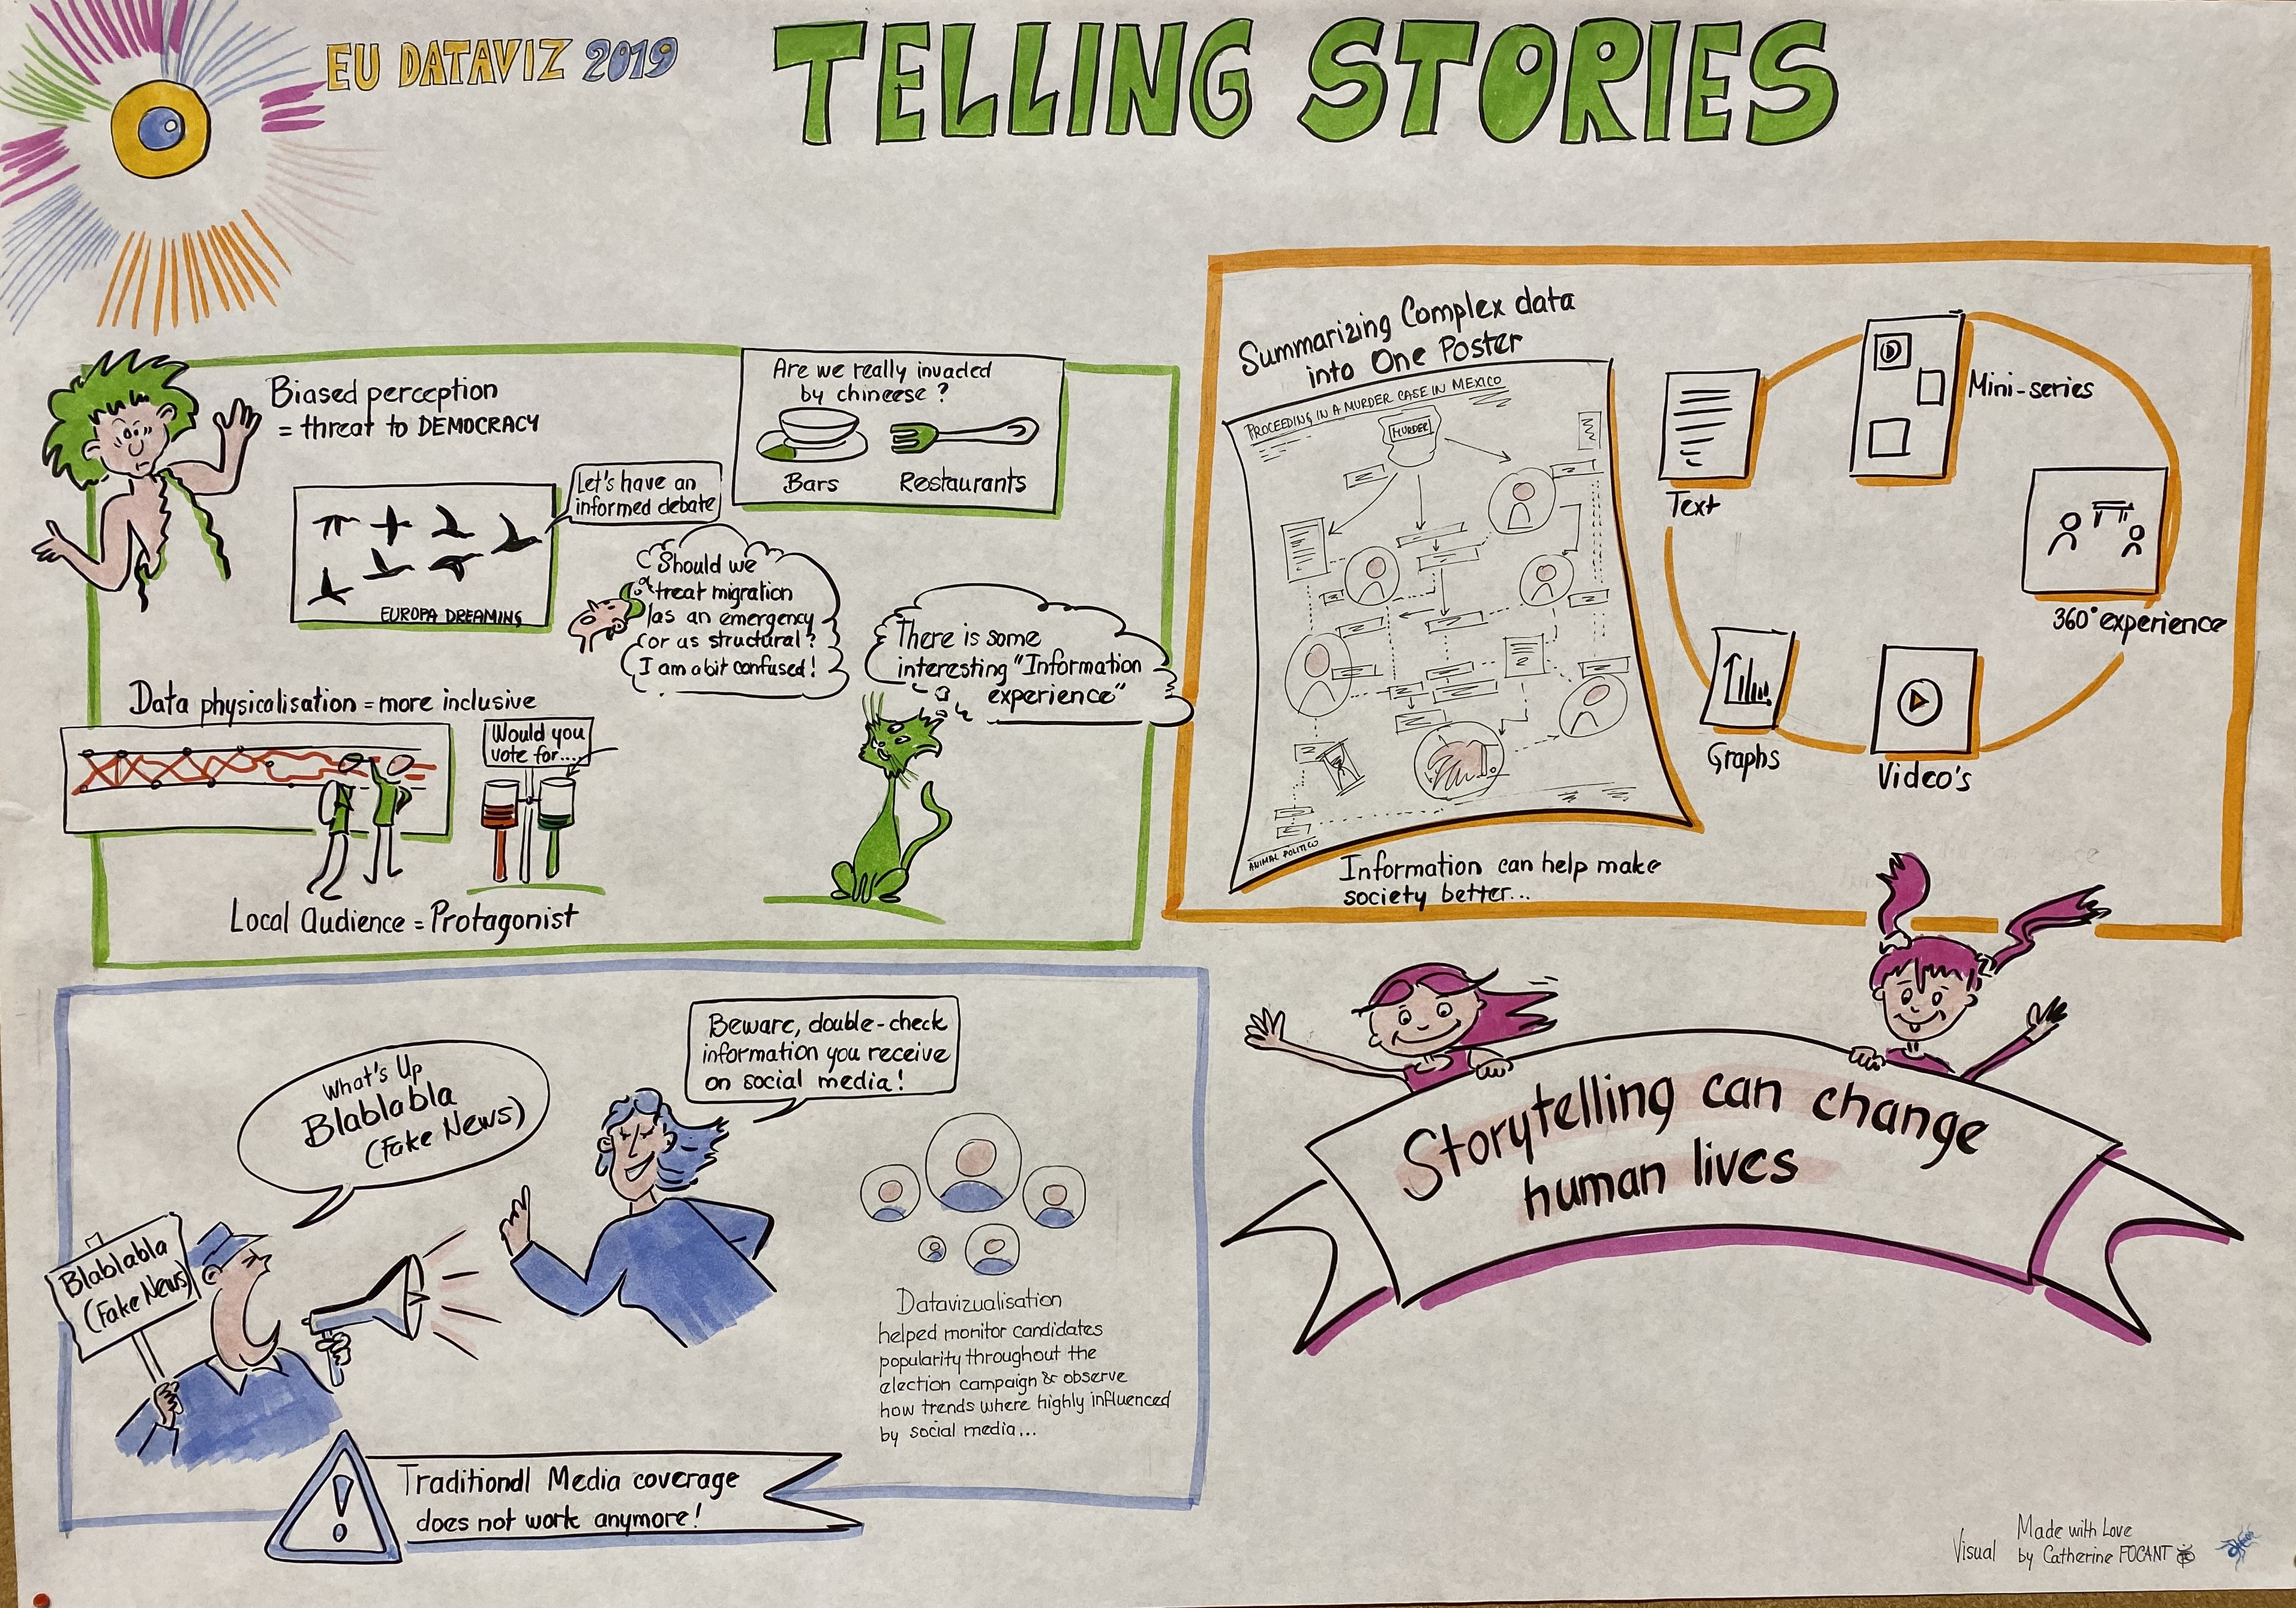
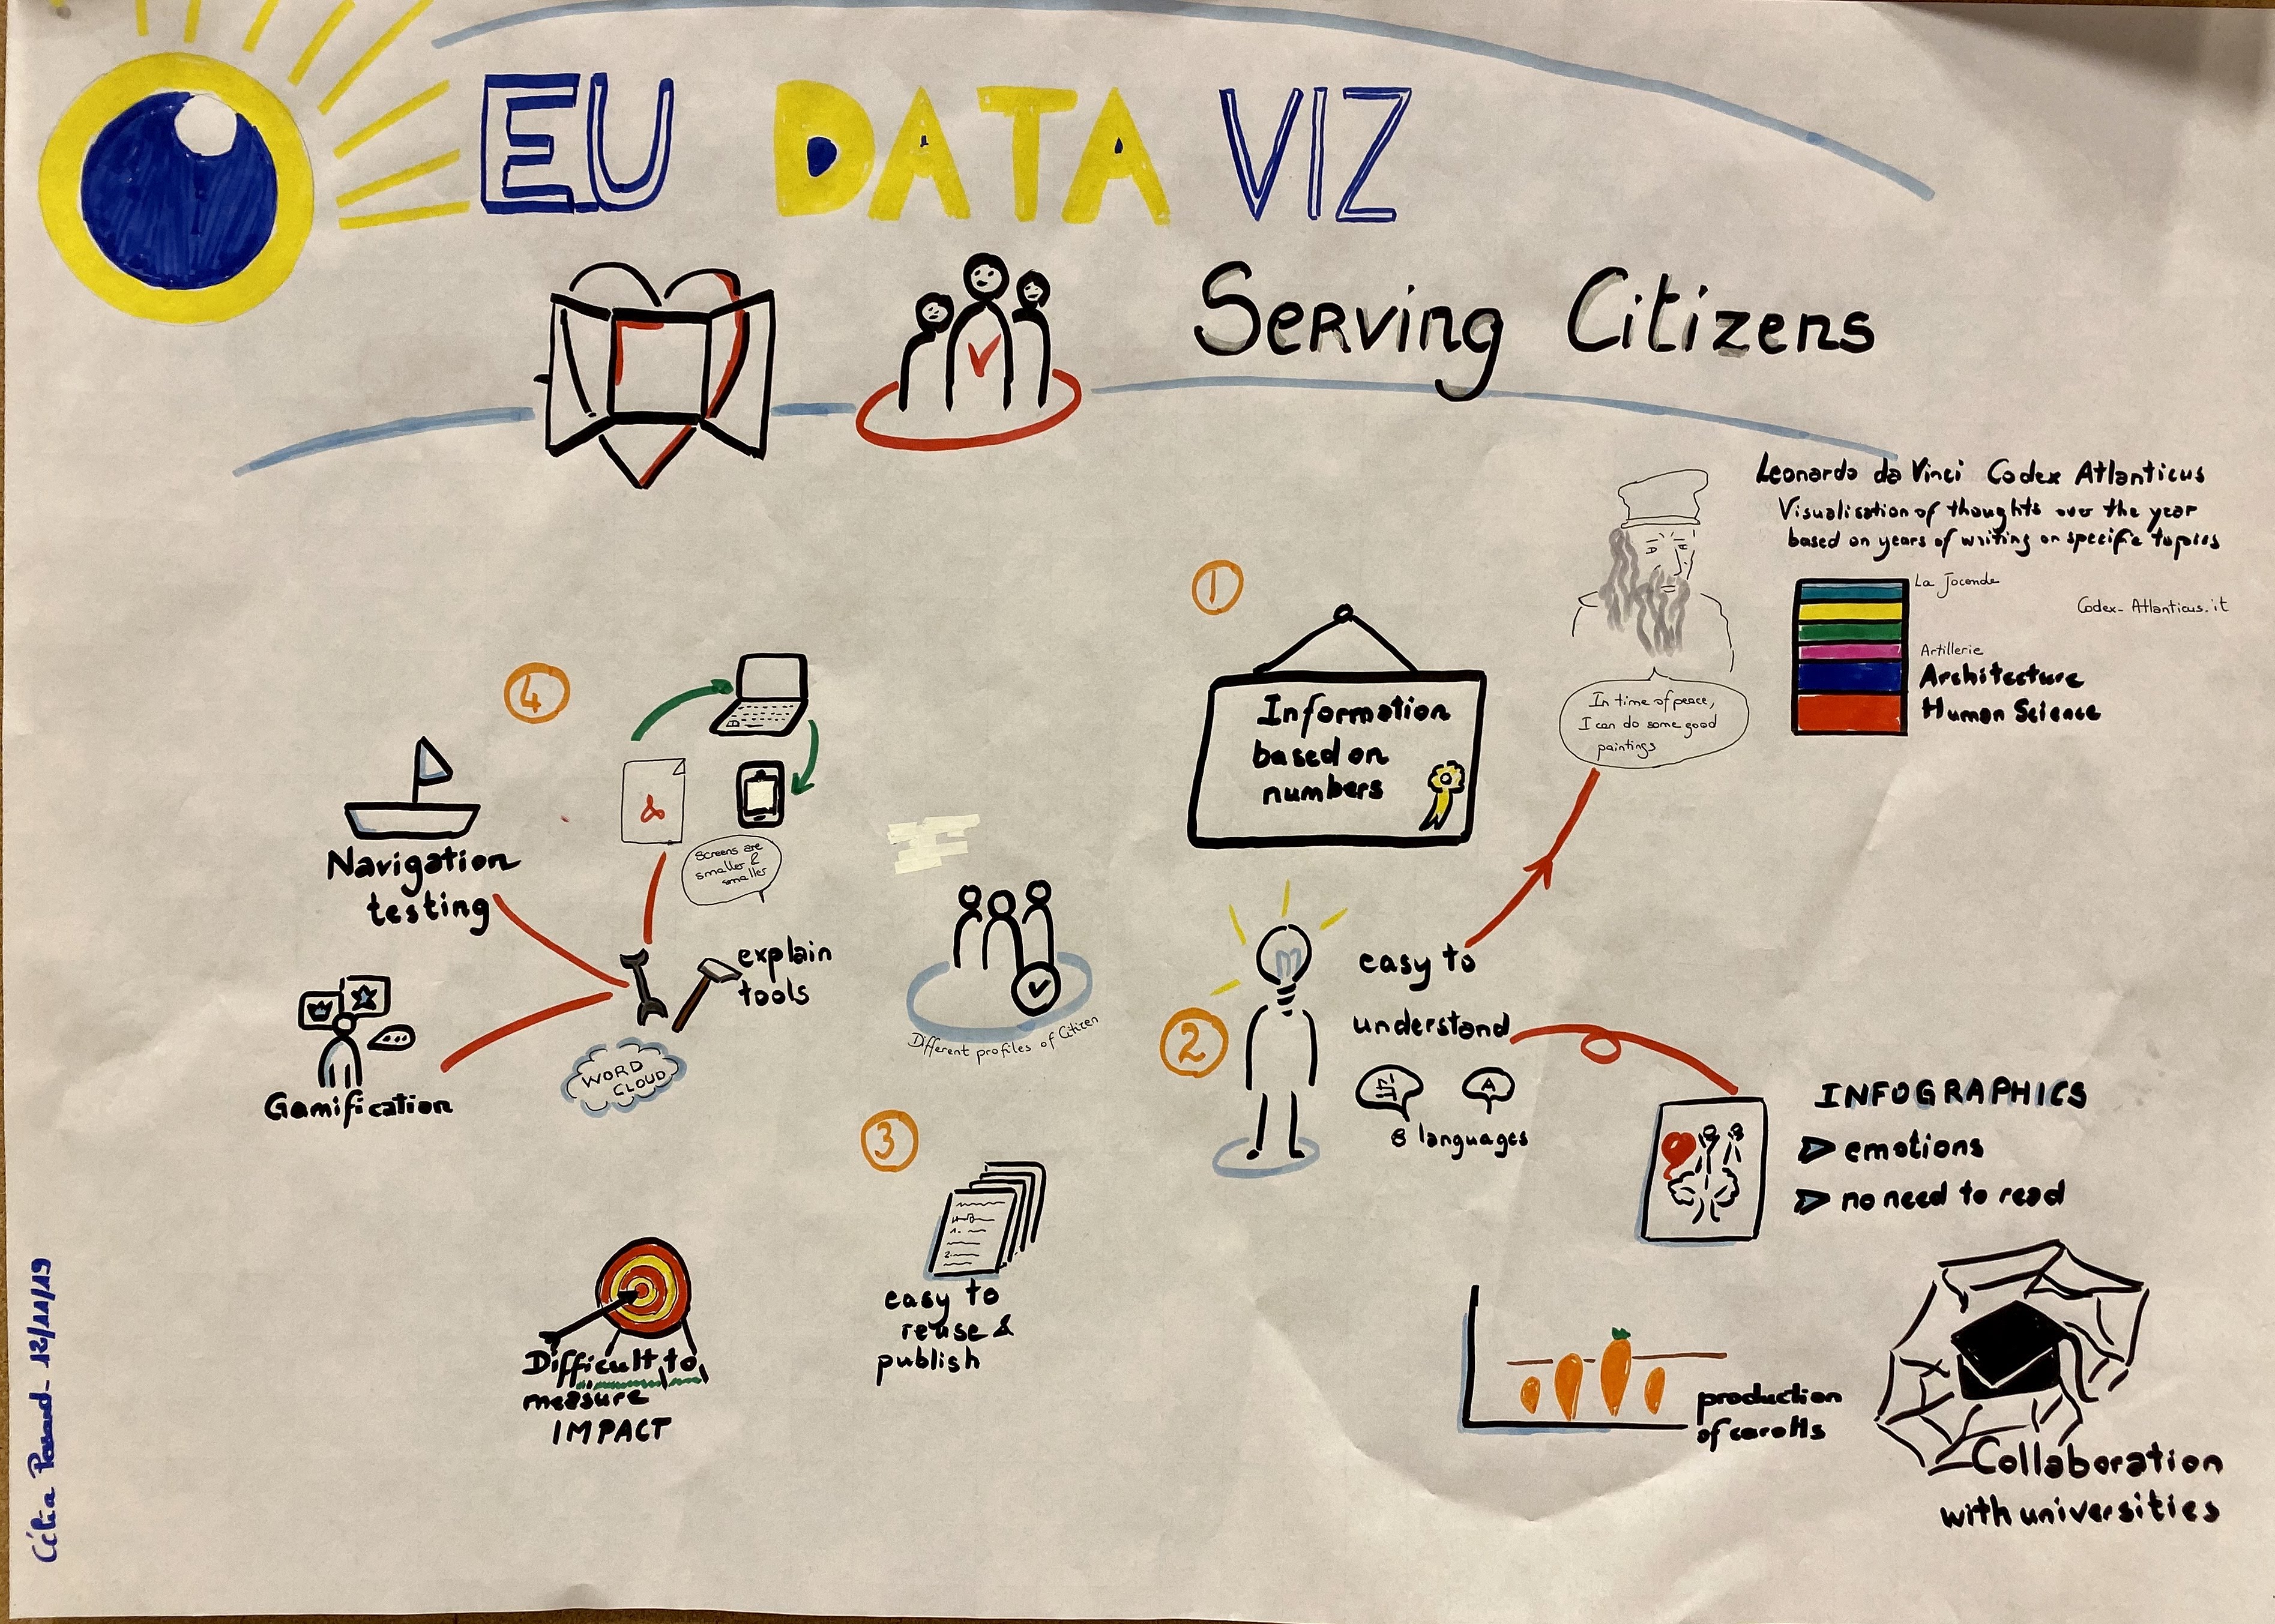
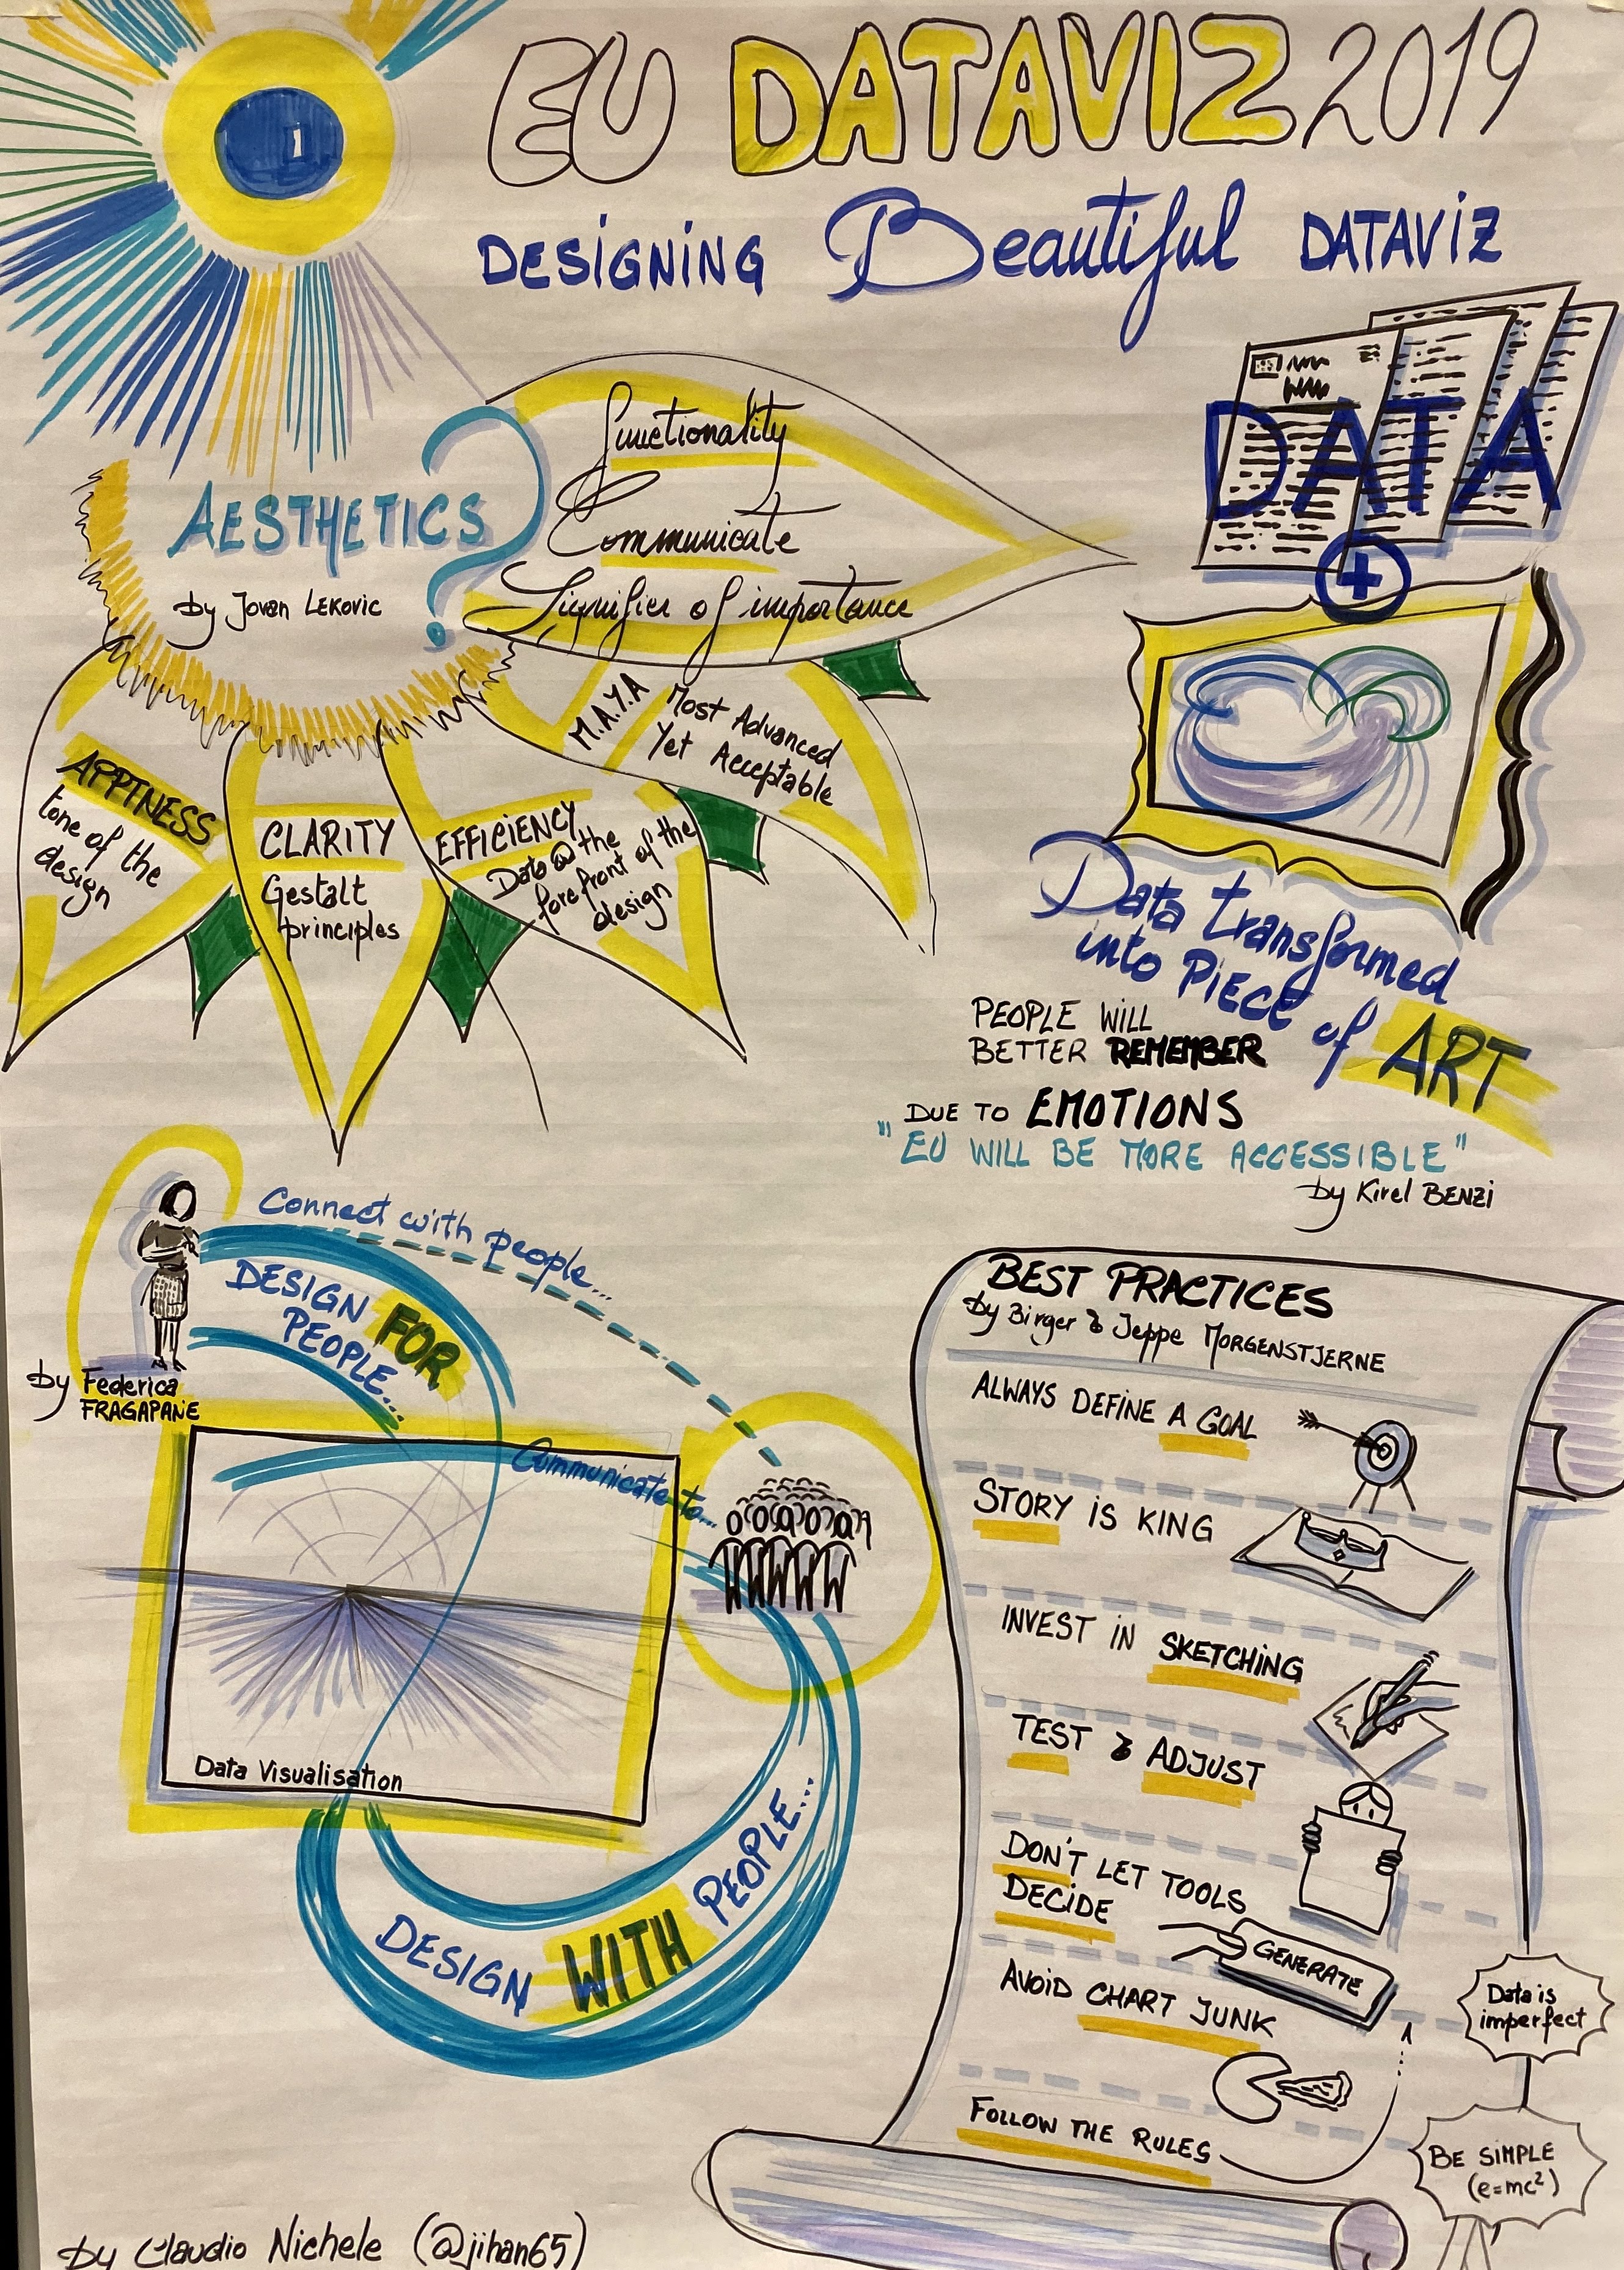
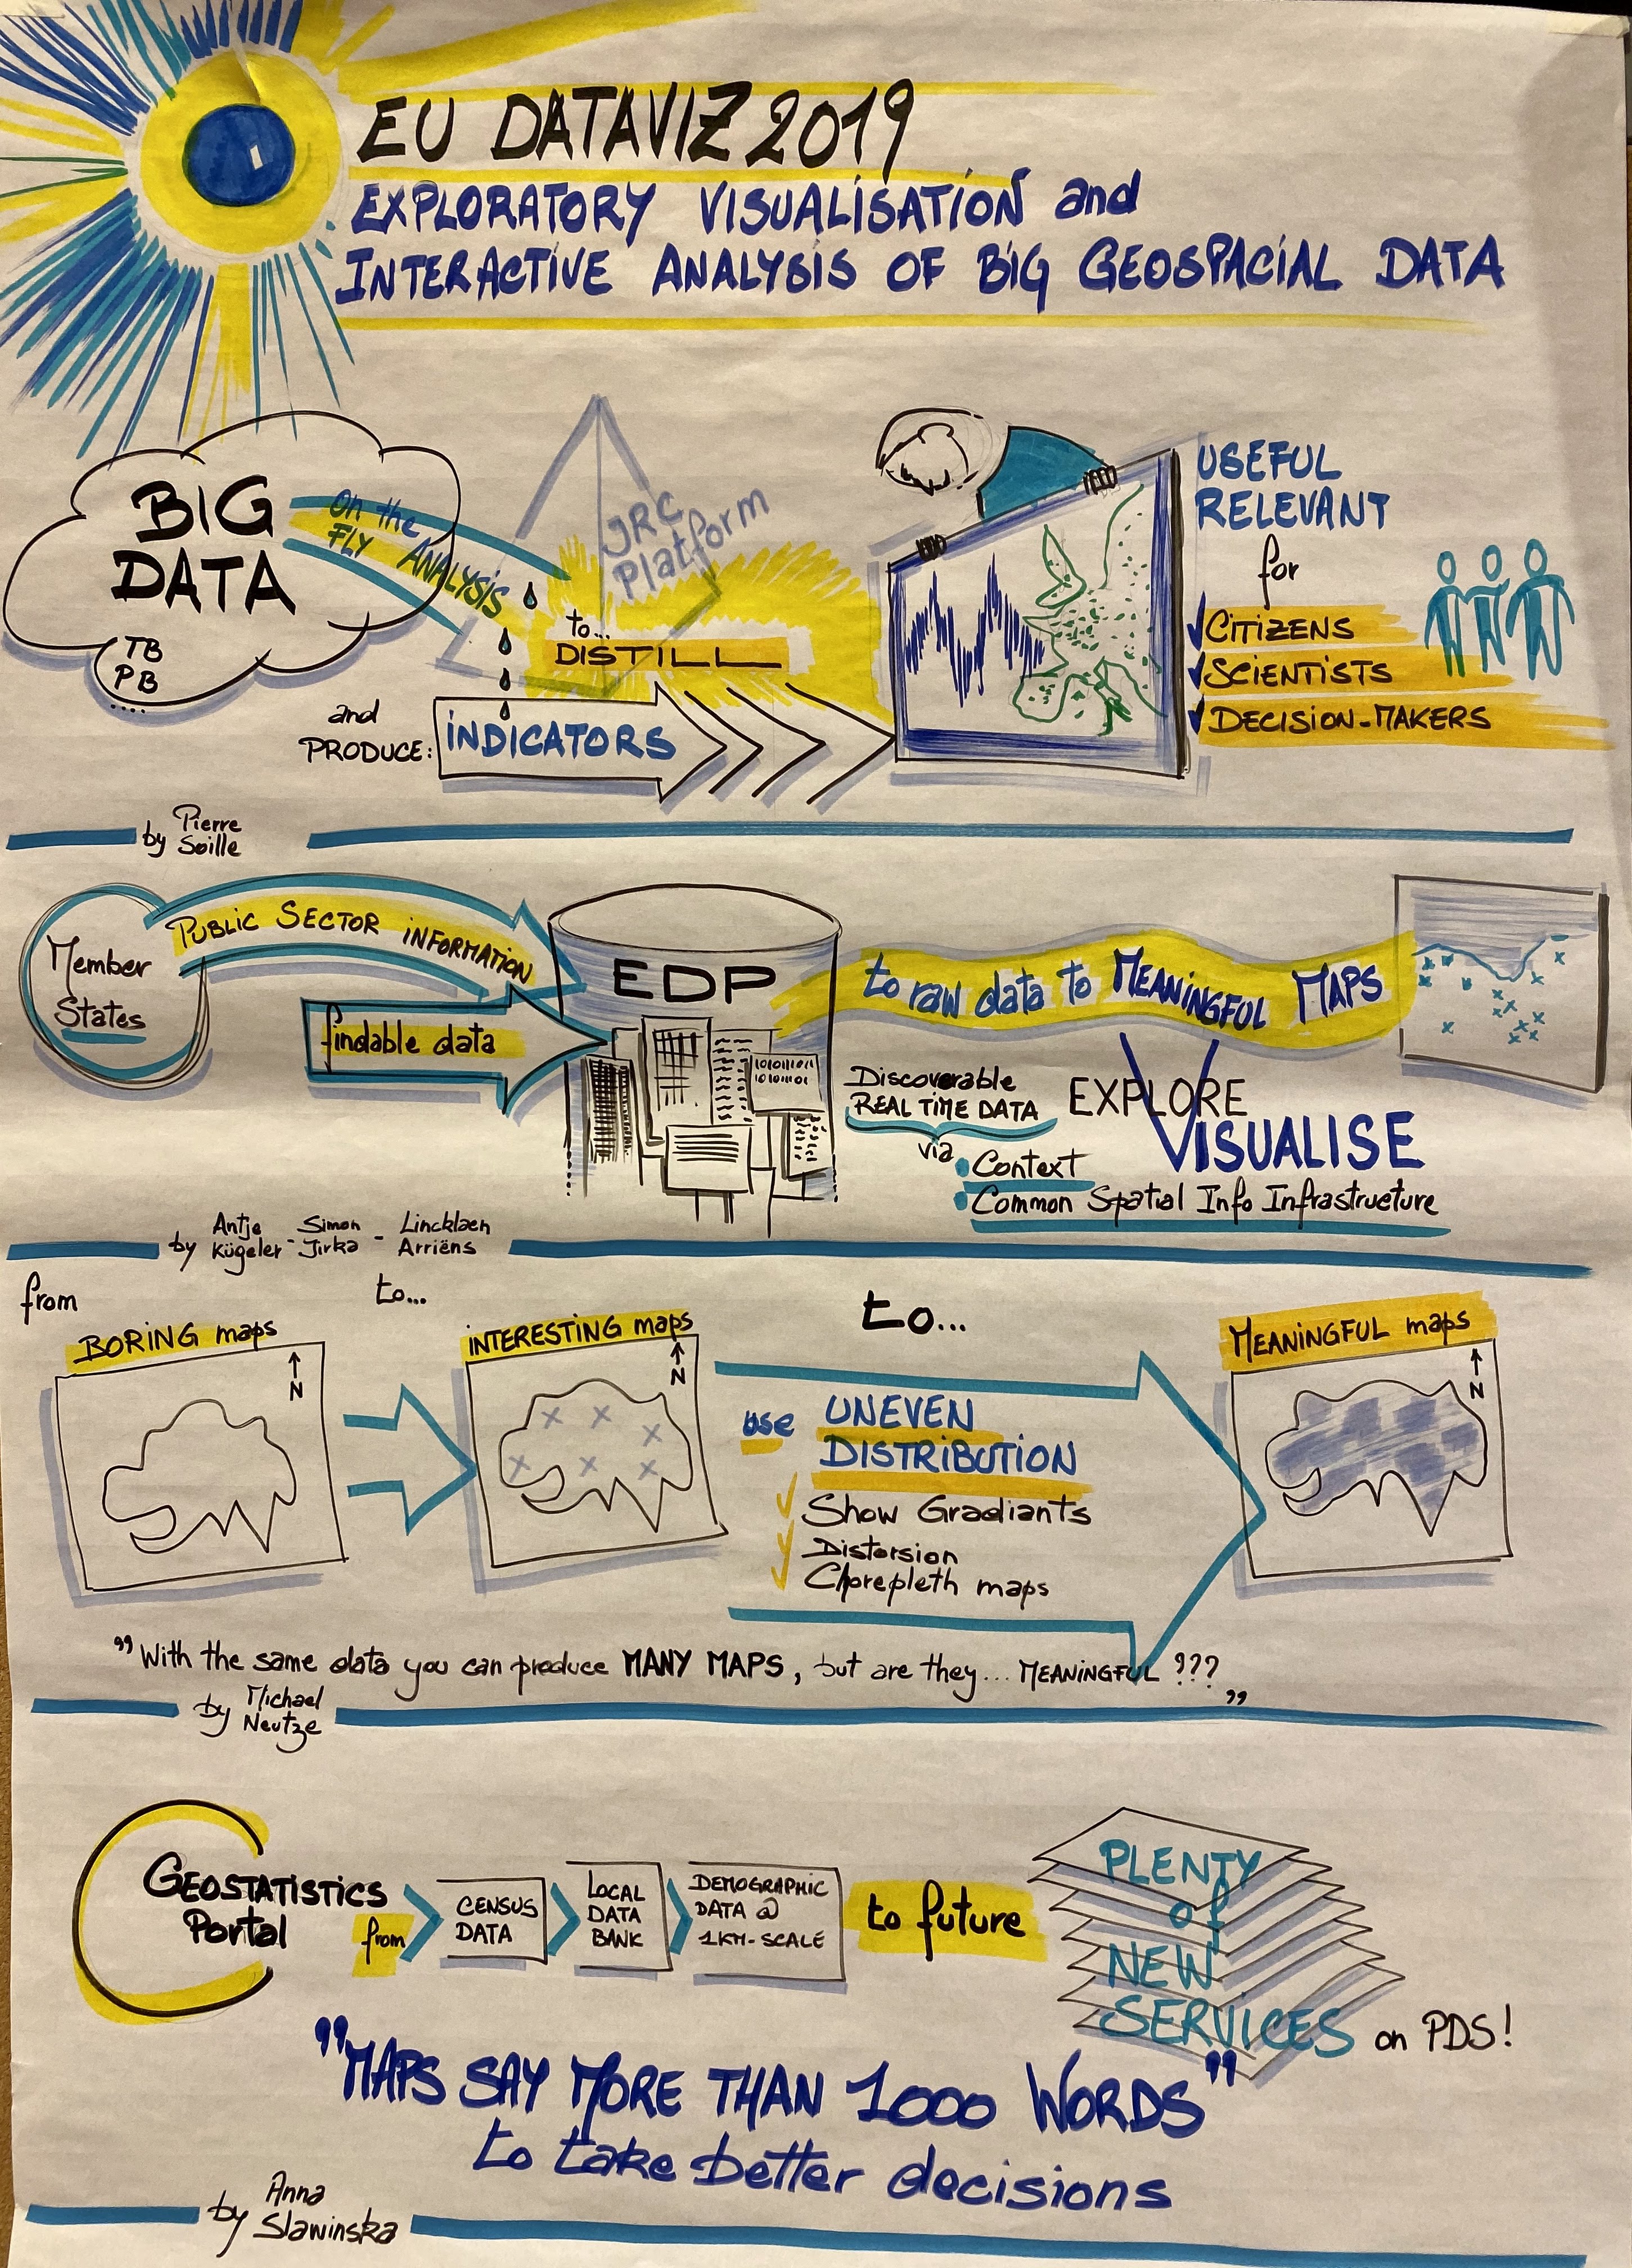
Visual recordings
The Visual Thinkers of the European Commission captured the essence of the speeches in a powerful and unique way


Posters
Discover the posters of the conference


Venue


